Plastic Contamination - EMERGING ISSUES IN FOOD WASTE MANAGEMENT August 2021 - US Environmental Protection Agency
←
→
Page content transcription
If your browser does not render page correctly, please read the page content below
EMERGING ISSUES IN                         August 2021
FOOD WASTE MANAGEMENT

Plastic
Contamination

                        U.S. Environmental Protection Agency
                         Office of Research and Development
                                             EPA/600/R-21/116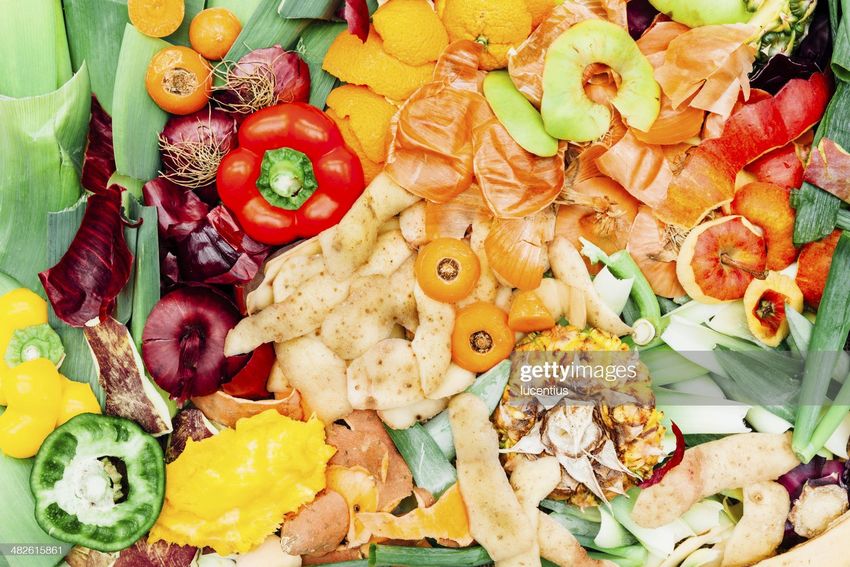
Disclaimer
     This document has been reviewed in accordance with U.S. Environmental Protection Agency policy and approved
     for publication. Mention of trade names or commercial products does not constitute endorsement or
     recommendation for use.

     Acknowledgements
     EPA would like to thank the following reviewers for their valuable comments on the draft paper:

               Michelle Andrews, Washington State Department of Ecology
               Angel Arroyo-Rodriguez, Ohio Environmental Protection Agency
               Elaine Blatt, Oregon Department of Environmental Quality
               Mary Harrington, Washington State Department of Ecology
               Colleen Hetzel, Minnesota Pollution Control Agency
               Travis Hiramoto, Hawaii State Department of Health
               Josh Kelly, Vermont Agency of Natural Resources
               Amy McClure, Indiana Department of Environmental Management
               Ashley Mihle, King County, Washington
               Tom Phillips, Maryland Department of Agriculture
               Kyle Pogue, CalRecycle
               Jackson Sego, City of Seattle, Washington
               Chery Sullivan, Washington State Department of Agriculture

     EPA would like to thank the following people for their independent peer review of the paper:

               Wolf Amelung, Ph.D., University of Bonn, Germany
               Thomas J. Aspray, Ph.D., Solidsense Ltd., United Kingdom
               Nanthi S. Bolan, Ph.D., University of New Castle, Australia

     Cover Photo Credit: U.S. EPA

     This paper was prepared by ICF Incorporated, L.L.C., for the U.S. Environmental Protection Agency, Office of
     Research and Development, under USEPA Contract No. 68HERC19D0003. External peer review was
     coordinated by Eastern Research Group, Inc., under USEPA Contract No. EP-C-17-017.

Plastic Contamination                                                                                               i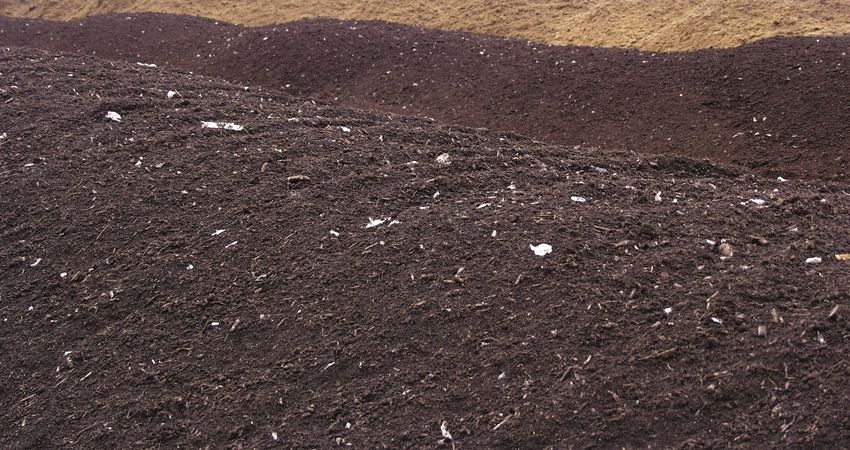
Executive Summary
Food waste is a major global environmental, social, and economic challenge. Recognizing the critical importance
of reducing food loss and waste, in September 2015, the U.S. EPA and U.S. Department of Agriculture
announced the U.S. Food Loss and Waste Reduction Goal to halve food loss and waste by 2030. One of U.S.
EPA’s strategies to help meet this goal is to encourage diversion of food waste from landfills to composting and
anaerobic digestion facilities to reduce methane emissions and recover value (e.g., nutrients or energy) from the
food. However, stakeholders (e.g., municipal governments, waste haulers, compost facility operators) have raised
concerns about the presence of plastic in food waste streams. To achieve the environmental benefits of diverting
food waste from landfills on a large scale, EPA must better understand the potential risks to human health and the
environment of applying plastic-contaminated compost or digestate products to land and the most effective
strategies to prevent or mitigate these risks and communicate these findings to affected stakeholders.
The primary source of plastic contamination in food waste streams collected for processing at compost and
anaerobic digestion facilities appears to be food packaging and containers, most likely from residential,
commercial, and institutional sources. Food itself is also a source of microplastic particles. The level of
plastic contamination present in food waste streams is not well characterized in the scientific literature. A
recent analysis found approximately 300,000 pieces of microplastics per kilogram of food waste collected
from grocery stores in the United States. In addition, limited data from Washington State and Oregon
reports plastic contamination rates up to 2.8 percent (by weight) in mixed waste streams including food
waste that were destined for composting or anaerobic digestion. Plastic contamination rates in purely food
waste streams may be higher, as available evidence indicates plastic contamination levels in food waste
streams may be higher than that of other organics waste streams, such as yard waste.
Techniques to prevent plastic contamination in food waste streams, such as education and outreach, cart
tagging programs, and hauler contract provisions are being used in some jurisdictions. Limited data on
prevention programs shows mixed results. If successful, prevention could reduce the complexity and
increase the desirability of processing food waste streams. Processing facilities also use a variety of
approaches, such as manual picking, screens, and de-packaging technologies, to reduce the amount of
plastic contamination in food waste streams before processing. These approaches can be costly and are
not fully effective. Plastic material, including microplastic, has been repeatedly observed in finished
products. Further, it is unclear to what extent technologies (e.g., shredders, grinders and de-packagers)
may inadvertently introduce microplastics or nanoplastics into the end products by breaking down larger
pieces of plastics.
Current tests for physical contaminants are labor intensive and costly, making it impractical to process
large sample sizes in the laboratory. Tests commonly used in the United States do not account for
contaminants less than 4 mm in size and thus may miss some microplastics (defined as plastic particles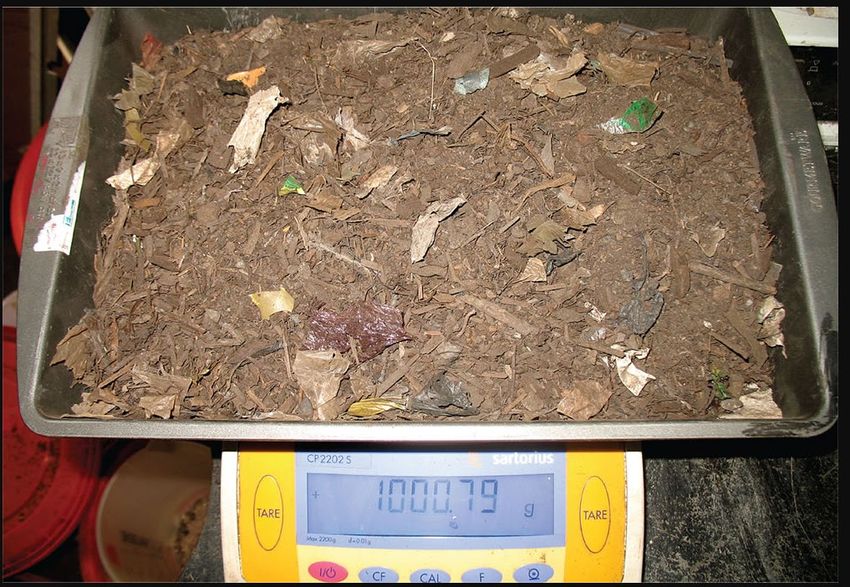
regulate plastic contamination in finished products applied to land; however, some U.S. states and
international governments do. These limits vary in both the allowable levels of contamination and fragment
size thresholds. European standards generally address smaller fragment size thresholds than U.S. state
regulations. Overall, the regulations in the United States typically do not address plastic fragments less
than 4 mm, and regulations identified for other countries do not address sizes smaller than 1 mm. Limits
may be set based upon detection levels, which vary along with the cost and level of complexity of available
testing methods, and aesthetic concerns (e.g., preventing visible plastics) given that exposure and risk
analysis is not available.
Regardless of risks to human health and the environment, the presence of visible plastic particles in
finished products reduces their value and marketability. Processing facilities sometimes prohibit food waste
streams or reject incoming food waste streams collected for processing at compost and anaerobic
digestion facilities due to plastic contamination levels, thus reducing the amount of food waste diverted
from landfills.
Plastic contamination may reduce the environmental and economic benefits of composting and anaerobic
digestion of food waste. For example, an initial study indicated plastic contamination may impede the
production of methane from food waste during anaerobic digestion, and another study found the presence
of microplastics can alter greenhouse gas and ammonia emission levels during composting.
Compostable plastics present a unique set of operational challenges to both consumers and facilities
seeking to compost these products when mixed with food waste. Compostable plastic materials can look
similar to those made with conventional plastics, leading to contamination of the compostable food waste
stream with conventional plastics, and to the removal of the compostable plastics along with conventional
plastics during screening and de-packaging at processing facilities, eliminating the potential environmental
benefit of compostable materials.
Plastic contamination in food waste streams and its implications for food waste management, and for human
health and the environment, is an emerging issue in the early stages of investigation. Scientifically rigorous data
are needed to address several important research gaps:
Research to discover the level of plastic contamination and associated particle sizes (e.g., microplastics or
nanoplastics) in finished composts and digestates generated from food waste and used as soil
amendments in the United States.
Research to ascertain the contribution of food waste to plastic contamination in compost and digestate
used as soil amendments.
Research to determine the impacts of technologies (e.g., shredders, grinders and de-packagers) commonly
used by processors on the level of plastic contamination and size of plastic particles.
Research to determine the effect of microplastic contamination on greenhouse gas and ammonia
emissions levels during composting and methane yield from anaerobic digestion.
Research to identify the most effective strategies to prevent plastic contamination in food waste streams.
Research to assess exposure and the potential risks to human health and the environment from land
application of plastic-contaminated compost and digestates.
Plastic contamination in food waste presents challenges for a broad range of stakeholders, including but not
limited to those involved in waste management and processing facilities, and those who purchase and intend to
use compost and digestate as soil amendments. Many key players contribute to the plastic contamination found in
food waste streams, including packaging and food serviceware manufacturers, food processors, consumers,
businesses, and institutions, and all of them can be a part of the solution.
Plastic Contamination iii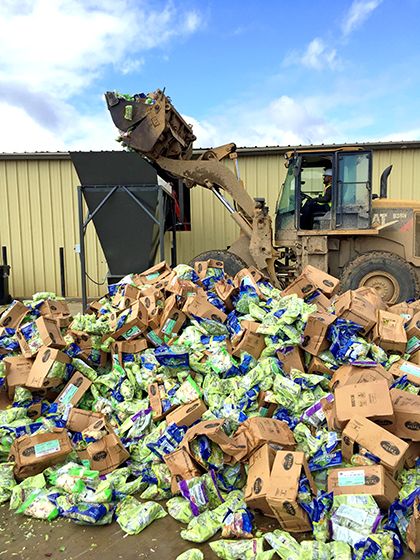
Table of Contents
     1. Introduction........................................................................................................................................ 1
         1.1. Background ................................................................................................................................ 1
         1.2. Overview .................................................................................................................................... 2
         1.3. Scope and Methods ................................................................................................................... 2

     2. Plastic Contamination in Food Waste ................................................................................................ 3
         2.1. Sources of Plastic Contamination in Food Waste Streams ......................................................... 3
         2.2. Levels of Plastic Contamination in Food Waste Streams............................................................ 5
         2.3. Sector Contributions to Plastic Contamination ............................................................................ 7

     3. Impacts on Food Waste Recycling .................................................................................................... 8
         3.1. Composting and Anaerobic Digestion ........................................................................................ 8
         3.2. Rejection of Contaminated Waste Streams ................................................................................ 9
         3.3. Operational Challenges Caused by Plastic Contamination ......................................................... 9
         3.4. Removal of Plastic Contamination ............................................................................................ 10

     4. Plastic Contamination in Finished Products ..................................................................................... 15
         4.1. Levels of Plastic Contamination in Finished Products............................................................... 15
         4.2. Effect of Plastic Contamination on Value and Use of Finished Products................................... 19

     5. Risks to Environment and Human Health ........................................................................................ 20
         5.1. Application of Soil Amendments Made from Food Waste ......................................................... 20
         5.2. Other Food Waste Management Pathways .............................................................................. 22
         5.3. Comparing Food Waste Management Pathways...................................................................... 22
         5.4. Levels of Plastic Contamination in Background and in Other Land Applied Products ............... 23

     6. Standards and Regulations ............................................................................................................. 24
         6.1. Standards and Regulations in the United States ...................................................................... 26
         6.2. International Standards and Regulations .................................................................................. 28
         6.3. Comparing U.S. and International Standards and Regulations ................................................. 29

     7. Preventing Plastic ContaminatioN ................................................................................................... 30
         7.1. Education and Outreach Campaigns ........................................................................................ 30
         7.2. Cart-Tagging Programs ............................................................................................................ 31
         7.3. Waste Management Contract Provisions.................................................................................. 32
         7.4. Stakeholder Meetings............................................................................................................... 32
         7.5. Food Industry Efforts ................................................................................................................ 32
         7.6. Local Ordinances ..................................................................................................................... 32

     8. Role of Compostable Products ........................................................................................................ 34
         8.1. Sources of Compostable Plastics in Food Waste Streams ....................................................... 34
         8.2. Levels of Compostable Plastics in Food Waste Streams .......................................................... 35
         8.3. Impact of Compostable Plastics on Food Waste Recycling ...................................................... 35
         8.4. Effect of Compostable Plastics on the Value and Use of Finished Products ............................. 37

Plastic Contamination                                                                                                                                            iv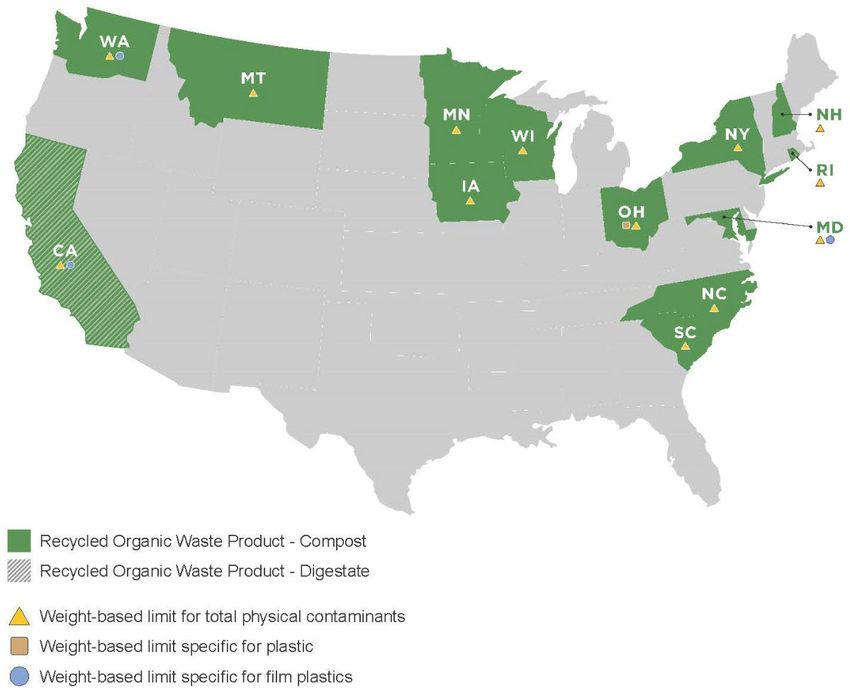
9. Conclusions and Research Gaps .................................................................................................... 38
         9.1. Conclusions ............................................................................................................................. 38
         9.2. Research Gaps ........................................................................................................................ 40

     References .......................................................................................................................................... 43

     Appendix A: Literature Search Methodology ........................................................................................ 54
         A.1. Methodology for Peer-Reviewed Literature.............................................................................. 54
         A.2. Methodology for Grey Literature .............................................................................................. 57

     Tables
     Table 1. Plastic Contamination Rates in Food ....................................................................................... 4

     Table 2. Contamination Rates in Food Waste Streams Collected for Composting and Anaerobic
              Digestion in the United States ................................................................................................. 6

     Table 3. Plastic Contamination Rates in Finished Compost and Digestate .......................................... 17

     Table 4. Regulatory Limits for Plastic Contamination in Finished Compost and Digestate ................... 25

     Figures
     Figure 1. State Regulatory Limits for Plastic Contamination in Finished Compost and Digestate in the
               United States ........................................................................................................................ 27

Plastic Contamination                                                                                                                                           v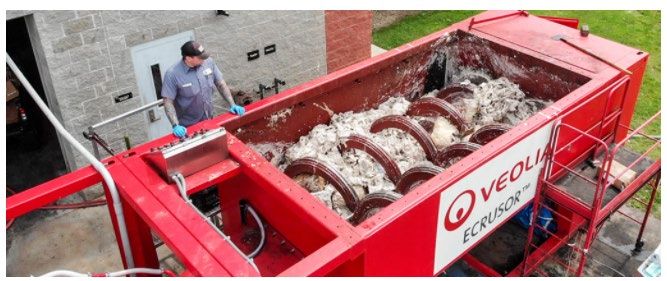
1. INTRODUCTION
The purpose of this issue paper is to inform federal, state, and local policymakers of the latest science related to
plastic contamination in food waste streams and its impacts on food waste recycling, the environment, and human
health, and to prioritize research needs in this area.
1.1. Background
Wasted food is a major global environmental, social, and economic challenge. When food is produced but
unnecessarily wasted, also wasted are all the embedded resources required for the food to be grown and make
its way through the food supply chain to consumers. In addition, food waste is typically landfilled in the U.S.,
resulting in significant methane emissions. The U.S. Environmental Protection Agency (EPA) estimates that more
food reaches landfills than any other single material in our everyday trash, constituting 24 percent of landfilled
municipal solid waste (MSW) (U.S. EPA, 2020a). Reducing food waste will help the United States address climate
change, as approximately 20 percent of total U.S. methane emissions come from landfills (U.S. EPA, 2020d).
Recognizing the critical importance of reducing food loss and waste, in September 2015, the EPA and U.S.
Department of Agriculture (USDA) announced the U.S. Food Loss and Waste Reduction Goal to halve food loss
and waste by 2030 1 (U.S. EPA, 2020f). One of EPA’s strategies to help meet this goal is to encourage diversion
of food waste from landfills to composting and anaerobic digestion facilities to reduce methane emissions and
recover value (e.g., nutrients or energy) from the food. EPA estimates that in 2018 only 4 percent of wasted food
in the United States was composted and 8 percent was anaerobically digested, while much of the remainder was
sent to landfills (56 percent) or combusted (12 percent) (U.S. EPA, 2020a, f). Many states and municipalities have
also established food waste reduction goals or initiated programs to reduce food waste. For example, laws and
executive orders in at least three states (New Jersey, Oregon, and Washington) have established goals to reduce
food waste by half by 2030 (NCSL, 2020; State of Oregon, 2020; State of New Jersey, 2017), and six states
(California, Connecticut, Massachusetts, New York, Rhode Island, and Vermont) have enacted organic waste
recycling laws to divert food waste from landfills.
Given these developments, interest in alternatives to landfilling or incinerating food waste, such as composting
and anaerobic digestion, has increased. However, stakeholders (e.g., municipal governments, waste haulers,
compost facility operators) have raised concerns about the presence of plastic in food waste streams.
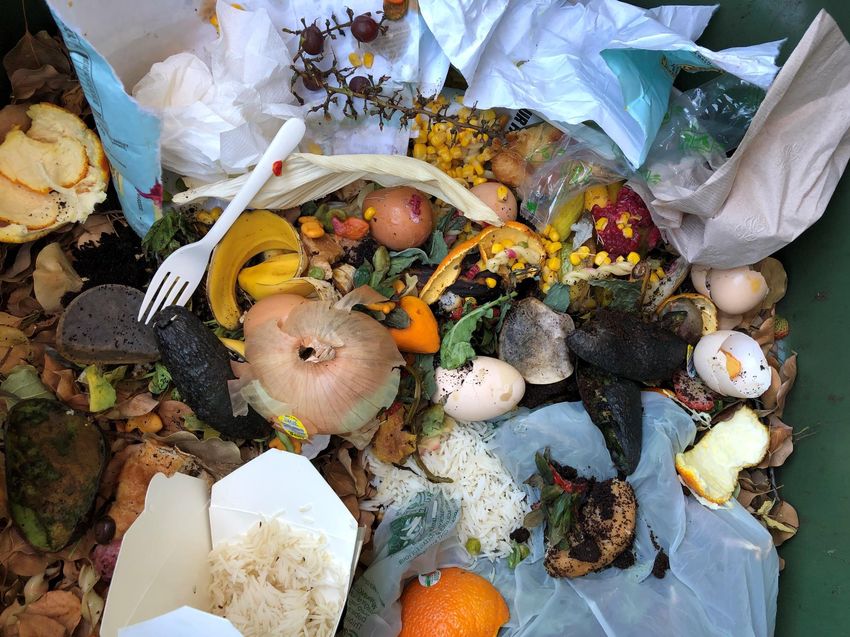
Plastic contamination found in food waste streams can include fragments and films of varying size that originate
from material such as food packaging, containers, bags, produce stickers, and serviceware (Harrington, 2015).
Plastic contamination in food waste causes operational problems for compost and anaerobic digestion facilities
and can reduce the value of their final products (U.S. EPA, 2019a; Arsova, 2010). Facilities sometimes prohibit
food waste streams or reject contaminated food waste streams for this reason, thus reducing the amount of food
waste diverted from landfills. Plastic-contaminated compost and digestate products may also pose risks to human
health and the environment when applied to land; however, data is very limited.
As EPA seeks to increase the amount of food waste composted or anaerobically digested rather than landfilled or
combusted, we seek to better understand the nature and magnitude of this problem and find solutions, where
necessary.
________________
1
The goal is to reduce per capita retail and consumer waste by 50% from 2010 levels by 2030.
Plastic Contamination 11.2. Overview
This issue paper reviews and summarizes information available in the literature on:
1) Sources and levels of plastic contamination in food waste streams;
2) Impacts of plastic contamination on the recycling of food waste and use of compost and
digestate;
3) Potential risks to the environment and human health caused by land application of plastic-
contaminated compost or digestate;
4) Approaches for preventing and mitigating plastic contamination in food waste intended for
recycling (including the use of regulatory measures); and
5) Effects of compostable food service products on plastic contamination in food waste streams.
After synthesizing findings in the available literature in each of the five research areas listed above, conclusions
and research gaps are presented to guide future efforts.
1.3. Scope and Methods
This issue paper focuses upon plastic contamination in U.S. food waste streams. In the paper, we use the term
food waste 2 to describe food that was not used for its intended purpose (i.e., being eaten by people) and is
managed in various ways, including composting or anaerobic digestion, or by sending it to landfills or combustion
facilities.
The paper includes data from the peer-reviewed literature as well as from publicly available gray literature from
government agencies, multi-stakeholder working groups, nonprofit organizations, and industry stakeholders and
associations. The sources of this additional information are clearly identified and can provide insights in areas
where the peer-reviewed data was sparse. For example, a report from the Washington State Organics
Contamination Workgroup (comprising state, county, and city officials plus businesses) provided the most robust
information on sources and levels of plastic contamination in food waste streams as well as strategies to reduce
plastic contamination in food waste diverted to composting and anaerobic digestion. The search strategy used to
identify available peer-reviewed and gray literature is summarized in Appendix A.
Throughout this issue paper, significant findings and conclusions are indicated by sidebars on the left margin of
the page.
________________
2 The term food waste in this report includes everything EPA typically includes in the term “wasted food,” except food which is donated to feed people (U.S. EPA,
2020a).
Plastic Contamination 22. PLASTIC CONTAMINATION IN FOOD WASTE
Sources and levels of plastic contamination in food waste streams are discussed in Sections 2.1 and 2.2,
respectively.
2.1. Sources of Plastic Contamination in Food Waste Streams
Conventional fossil fuel-based plastics are used in a variety of ways in the food industry, but their primary use is
to protect or preserve foodstuffs, thereby helping to reduce the amount of food wasted due to damage or spoilage
(Heller, 2019; Wohner et al., 2019; OECD, 2018). Plastic is also used for food product labeling and advertising
materials. Despite their role in reducing food waste, some non-compostable plastic does enter the food waste
stream, complicating the processing of food waste. (Note: See Section 8 of this paper for a separate discussion of
compostable materials.)
The available literature indicates that the primary sources of plastic contamination in food waste streams are food
packaging and containers, and more specifically those manufactured as multilayer paper products coated in
plastic, which are designed to provide a high level of resistance to water and gas transfer to the food they are
meant to protect (Brinton et al., 2018; Barlow and Morgan, 2013).
Examples of these products include frozen-food and take-out containers, cartons for beverages such as juice and
milk, plastic-lined paper bags, and paper plates designed to provide moisture protection (Brinton et al., 2018).
Other food serviceware, such as plates, serving trays, hot and cold beverage cups, and utensils, are also often
collected with food waste, and these can be made of plastic-coated paper (i.e., multilayer paper products) or
plastic alone (Cadwallader, 2019).
Other common sources of plastic in food waste streams include non-compostable bags and stickers (Harrington,
2015). Non-compostable plastic bags, including produce bags and can liners, are used to preserve and store food
intended for consumption but can enter food waste streams (Oregon Metro, 2020; State of Washington, 2017).
While some collection programs allow food waste to be collected in compostable film liners, residents and
businesses sometimes use liners made from conventional plastic instead, thus contaminating the food waste
stream (Oregon Metro, 2020). Stickers found on produce and other foodstuffs include a layer made of either
plastic or vinyl and can be found on many fruits and vegetables to display brand information or price-look up
codes (Nosowitz, 2018). Plastic stickers typically are removed before eating fruits and vegetables that have an
edible skin or outer layer. However, for fruits and vegetables with skin or an outer layer that is not consumed (e.g.,
avocado, orange)—or fruits and vegetables that are not consumed at all—the plastic sticker sometimes remains
attached to the food material (Nosowitz, 2018) and is collected with food waste streams.
Plastic particles may also enter the food waste stream due to their presence in the food itself. Table 1 presents
the range of plastic contamination rates in food as reported in the available literature. Several studies have
documented the presence of microplastic particles (MPs) (defined as plastic particlesTABLE 1. PLASTIC CONTAMINATION RATES IN FOOD
Number of
Particle Size Sampling
Food Item Plastic Reference
Categorya,c Location
Particlesa,b
United States
Keisling et al.
(2020), Baechler et
al. (2019), Waite et
Seafood 0.16–3.84 MPs/g Microplastic United States
al. (2018), Zhao et
al. (2018), Rochman
et al. (2015)
Sea salt 0.212 APs/gd,e Conventional plastic United States Kosuth et al. (2018)f
Beer 0.05 APs/Le Conventional plastic United States Kosuth et al. (2018)
Tap water 9.24 APs/L f
Microplastic United States Kosuth et al. (2018)
United States and
Bottled water 325 MPs/Lg Microplastic Mason et al. (2018)
other countriesh
Outside United States
Salt 0.11 MPs/g Microplastic Multiple countries Cox et al. (2019)
Sugar 0.44 MPs/g Microplastic Germany Cox et al. (2019)
Seafood 1.48 MPs/g Microplastic Multiple countries Cox et al. (2019)
Honey 0.10 MPs/g Microplastic Multiple countries Cox et al. (2019)
Beer 32.27 MPs/L Microplastic Canada, Germany Cox et al. (2019)
Bottled water 94.37 MPs/L Microplastic Multiple countries Cox et al. (2019)
MPs = microplastics; APs = anthropogenic particles; g = gram; L = liter
a Microplastic particles are plastic particles 5 millimeters in size.
d Concentration reported in APs/kg; converted to APs/g.
e Particles of size >11 µm.
f Particles of size >2.5 µm. Kosuth et al. (2018) reported their results as “anthropogenic debris” rather than microplastic because spectroscopic analyses were not
performed to confirm their assumption that the particles found were most likely microplastic.
g Particles of size >6.5 µm. Note this particle size is greater than the size typically categorized as “microparticles.”
h Data from United States and international bottled water combined.
In addition to the different types of plastic products found in food waste streams, the use of many different types
of plastic to make these products adds another layer of complexity to the processing of plastic-contaminated food
waste streams (WPO, 2008). Specific types of plastic used in the food industry include polyethylene terephthalate
(PET), commonly used in soft drink and water bottles; high-density polyethylene (HDPE), commonly used in milk
and water jugs; low-density polyethylene (LDPE), commonly used in film products (including bags and sacks) and
plastic-coated paper products; and polyvinyl chloride (PVC), polystyrene, polypropylene, and other resins,
commonly used to manufacture clamshell containers, trays, caps, lids, egg cartons, loose fill, produce baskets,
coatings, and closures (U.S. EPA, 2020c, 2019b; Brinton et al., 2018). The multilayer paper products coated in
plastic (discussed above) often use polyethylene, which includes both LDPE and HDPE (WRAP, 2017).
Information on the amounts or percentages of the plastic contamination in food waste streams attributable to each
type of product or type of plastic has not been published to date. The overall use of plastic for food packaging and
the employment of more sophisticated food packaging technology continues to increase over time (U.S. EPA,
2020b), but the impact on contamination levels is unknown.
Plastic Contamination 42.2. Levels of Plastic Contamination in Food Waste Streams
Comprehensive national studies of plastic contamination levels in food waste streams across the country are not
available, but organizations in Washington State and Oregon have collected relevant data. The available data
confirms the presence of plastic in food waste streams at the time of collection before it enters composting or
anaerobic digestion facilities.
However, because food waste is often collected with other organic waste, it can be difficult to determine how
much plastic contamination is attributable to food waste and how much is entering via other organic waste
streams, such as yard waste. In addition, often only total contaminant loads are measured, which may include
glass and other non-compostable items in addition to plastics (King County Solid Waste Division, 2019a, b; State
of Washington, 2017). While weight is the most common metric for contamination, volume measurements can
also offer insights, especially given the lighter weight of film plastics compared to other common contaminants
such as glass.
In 2019, Oregon Metro completed a Commercial Food Scraps Composition Study to evaluate the amounts and
types of contaminants placed in food scrap bins by businesses and their employees in the Metro region that
encompasses Portland and 23 surrounding cities (Oregon Metro, 2020). This program is just for food waste
destined for composting and anaerobic digestion facilities, and the only acceptable materials are food and
compostable film can liners. The study showed that average total contamination in the commercial food scraps
stream was 3 percent by weight and 6 percent by volume. Plastic food serviceware made up 1 percent by weight
and volume of the samples analyzed. Plastic bags and films made up 1 percent by volume of the samples
analyzed. Other contaminants found included yard debris and plants, paper napkins and towels, and fiber-based
serviceware. At the time of the study, the program was voluntary. The report notes that contamination may
increase when the program changes from voluntary to mandatory in March 2021 (Oregon Metro, 2020).
A report by the King County Solid Waste Division (2019a), including the organics waste stream data for King
County, Seattle, and Snohomish County in Washington, reported total contamination levels of approximately 3.9
percent by weight (19,900 tons) of the material collected for processing at compost facilities. This estimate
includes plastics and plastic-coated papers, but also other contaminants such as glass. More detailed data from
specific jurisdictions can be found in Table 2 and are summarized below. All estimates of composition are by
weight.
In King County (excluding Seattle), plastic contamination was 2.8 percent of the materials collected from
commercial curbside carts (from businesses and institutions) in March of 2019. No yard waste was collected
during that time period from commercial carts, so food waste made up most of the materials along with
compostable packaging and paper products (King County Solid Waste Division, 2019a). Also in King County
(excluding Seattle), contamination (non-compostable material) made up about 5 percent by weight of the material
collected in single-family curbside organics service carts in 2017. This collection was primarily of yard waste (85
percent), with food waste constituting only 6 percent (King County Solid Waste Division, 2018). Recyclable plastic
was 0.1 percent of the of material collected, and “other materials” constituted 4 percent. Other materials included
animal waste, kitty litter, treated wood, construction materials, Styrofoam, and plastic trash bags (King County
Solid Waste Division, 2018).
The City of Seattle’s 2016 Organics Stream Composition Study found that non-compostable contaminants
accounted for almost 3 percent by weight of the material collected. In this study, food waste made up
approximately 41 percent of the total organic materials collected that were intended for composting, whereas yard
waste contributed approximately 46 percent (Seattle Public Utilities, 2018). Estimates were reported separately
for certain plastic contaminants as percent of total material collected: non-compostable plastic film (0.7 percent),
non-compostable plastic containers (0.2), other plastic (0.1 percent), and polycoated paper (0.3 percent).
Plastic Contamination 5The City of Seattle’s results were reported individually for the three waste-generating sectors: single-family
residential, multifamily residential, and commercial (i.e., business and institutions), though comparisons remain
difficult, as the percentage of food waste in each sector’s waste stream varied. The percentage of plastic
contamination was highest in the organic waste collected from the multifamily residential sector for which food
waste constituted approximately 59 percent of the organics collected (the sum of plastic contaminants was 2.2
percent and 0.3 percent was polycoated paper). In the commercial sector, in which food waste contributed
roughly 75 percent of the organics collected, the sum of plastic contaminants was 1.9 percent and polycoated
paper made up 0.5 percent. In the single-family residential sector, in which food waste contributed only 13 percent
of the organics collected, the sum of plastic contaminants was only 0.2 percent and polycoated paper made up
0.1 percent (Seattle Public Utilities, 2018).
TABLE 2. CONTAMINATION RATES IN FOOD WASTE STREAMS COLLECTED FOR COMPOSTING AND
ANAEROBIC DIGESTION IN THE UNITED STATES
Contamination Rates in Food Waste
Feedstock Streams
Area Sector
composition
Total contamination Plastic contamination
(by weight) (by weight)
Single
King County, WA 6% FW 0.1%
Family 5%
(excluding Seattle) recyclable plastics
Residential
Single
Seattle, WA 13% FW Family – 0.2%
Residential
Seattle, WA 75% FW Commercial – 1.9%
Portland, OR and 100% FW and
23 surrounding compostable Commercial 3% 2%
cities linersa
Multi-Family
Seattle, WA 59% FW – 2.2%
Residential
100% FW and
King County, WA
compostable Commercial – 2.8%
(excluding Seattle)
paper/packaging
Source: King County Solid Waste Division (2019a); Oregon Metro (2020)
FW=food waste
a Includes bags for compost collection bins
Plastic Contamination 6In summary, the limited available data from Oregon and Washington reports plastic contamination rates up to 2.8
percent (by weight) in waste streams including food waste and destined for composting or anaerobic digestion.
Total contamination rates of the same streams are up to 5 percent (by weight). However, plastic contamination
rates in purely food waste streams may be underestimated here, as food waste was not the major component of
many of the waste streams analyzed. Available evidence indicates plastic contamination levels in food waste
streams may be higher than that of other organics waste streams, such as yard waste.
When food scraps were added to curbside yard waste collection programs over the past decade, composting
facilities observed an increase in the types and amounts of physical contaminants mixed with the incoming loads
of organic waste (State of Washington, 2017). In addition, a report by CalRecycle (2019) indicates that food
scraps have a higher percentage of plastic and glass than other feedstocks. Additional data on waste streams
primarily composed of food waste would be helpful to confirm magnitude of contamination.
In addition to the visible plastic items that were analyzed in the available waste stream studies, food waste
collected for processing is likely to contain microplastic particles of varying sizes (that may or may not be visible).
These particles could originate from fragmentation of larger plastic pieces or from the food itself. Preliminary
analysis by Golwala et al. (2021) found approximately 300,000 pieces of microplastics per kg of food waste
collected from grocery stores in the United States (unpublished data).
The significance of plastic contamination may also be underestimated by measuring contamination by weight, as
the smallest particles may pose the greatest risk to human health and the environment. Measuring by volume
places more emphasis on the lighter weight plastics, such as film plastics, but neither measurement technique
accounts for the potential importance of tiny fragments.
2.3. Sector Contributions to Plastic Contamination
While no comprehensive data exists on plastic contamination contributions by sector, inferences may be drawn
about the potential significance of each sector’s contribution based upon how food waste is generated and
collected in the sector. While food waste is generated all along the supply chain, much of the upstream waste
(e.g., on-farm and food processing) is unlikely to be packaged in plastic. For example, many of the drivers of food
waste generated during food manufacturing—such as trimming for end-use, processing inefficiencies, equipment
malfunctions, human error, and food safety and quality concerns—produce food waste before the products are
packaged (CEC, 2019; FAO, 2019; Snyder and Worobo, 2018; ReFED, 2016). Some manufacturing-generated
food waste could include plastic packaging, however; consequently, this step in the process remains a potential
source of plastic contamination.
Food waste generated from residential, commercial, and institutional sources is likely to include a greater amount
of plastic contamination than food waste generated on-farm or from food manufacturing, during which the waste is
largely generated before food is put into packages.
For instance, a large share of the food waste stream generated by the commercial sector is packaged food
products that are spoiled, expired, mislabeled, or otherwise unfit for consumption (Gorrie, 2015). At residences,
commercial locations, and institutions, individuals consume food and then discard uneaten food and any plastic
packaging or serviceware into available collection bins, including those designated for composting, recycling, or
processing outside of a landfill which results in some mixing of food waste and plastic materials at these locations
(State of Washington, 2017).
Plastic Contamination 73. IMPACTS ON FOOD WASTE RECYCLING
The presence of plastic in food waste collected for processing presents operational challenges for composting
and anaerobic digestion facilities, making it difficult for them to accept feedstock with high levels of plastic
contamination (U.S. EPA, 2019a; State of Washington, 2017; Arsova, 2010). These facilities use a variety of
approaches to remove plastic from contaminated feedstock they receive. Despite these efforts, some plastic has
been observed in finished materials, including compost (Braun et al., 2020; NSW EPA, 2019; Brinton et al., 2018;
Weithmann et al., 2018; State of Washington, 2017). Also, if plastic is not removed from contaminated feedstock
before composting or anaerobic digestion, products generated by these facilities will be lower in quality, thereby
decreasing their value and ability to be used (see Section 4 for further discussion).
This section describes composting or anaerobic digestion processes, the rejection of contaminated food waste by
processing facilities, operational issues caused by plastic contamination in food waste streams, and methods and
technologies to remove plastic contamination from food waste. Measures to prevent plastic contamination before
it reaches composting and anaerobic digestion facilities are discussed in Section 7.
3.1. Composting and Anaerobic Digestion
The collection and processing of food waste is an important strategy for minimizing environmental and waste
management issues related to its disposal (Dilkes-Hoffman et al., 2018). Food waste diverted from landfills can be
used to generate energy and recover nutrients. Furthermore, diverting food waste helps to reduce solid waste
volumes and greenhouse gas emissions from landfills (Morelli et al., 2020).
Composting, a form of aerobic food processing, involves the decomposition of wasted food in the presence of
oxygen. Composting converts organic biological matter into humic substances through decomposition.
Decomposition of food waste takes place in aerobically controlled conditions. Factors that affect compost
development and influence the stage or direction of the process primarily include the particle size, moisture
content, temperature, airflow, and microbes present (U.S. EPA, 2016). Aerobic composting methods include pile
composting, aerated static pile (ASP) composting, closed mechanical reactor composting (in-vessel composting),
vermicomposting, and less commonly, insect composting (e.g., black soldier fly). Pile composting, also called
aerated or turned windrow composting, is the most common composting method; as its name implies, this method
includes the creation of piles, typically in long rows, which are mechanically turned to maintain a consistent
temperature throughout the pile, for aeration, and to distribute moisture. In ASP composting, organic waste is
mixed in a large pile. Layers of loosely piled bulking agents (e.g., wood chips, newspaper) are added to aerate the
pile. Piles can also be placed over pipes that deliver air to the pile or draw air out of the pile. In-vessel composting
involves feeding organic material into a drum, silo, concrete-lined trench, or similar vessel, which allows for
careful control of environmental conditions such as temperature, moisture, and airflow (U.S. EPA, 2016). Pile,
ASP, and in-vessel composting have three stages: mesophilic (25°C–40°C), thermophilic (40°C–65°C), and
cooling and maturation (10°C–40°C). Finished compost is applied to land to improve soil health, among other
benefits.
Anaerobic digestion is the process by which organic material is broken down in an oxygen-free environment to
produce renewable energy (e.g., biogas and biofuel) and digestate (e.g., soil amendments). Commercial
anaerobic digestion facilities were first introduced in the 1950s (Pham et al., 2015); however, in recent years
interest in the technology as a food waste management mechanism has accelerated (Anukam et al., 2019). Some
advantages of anaerobic digestion are its limited environmental footprint, high energy recovery potential, and that
the resulting digestate can be used in the production of agricultural fertilizer and soil amendments (Braguglia et
al., 2018). As of 2016, according to EPA, 198 operational anaerobic digestion facilities process food waste either
as stand-alone or co-digestion facilities (U.S. EPA, 2021b). 3 Currently, anaerobic digesters can be found either as
stand-alone facilities, on-farm food digesters, or co-digestion facilities located at water resource recovery facilities
(WRRFs). Co-digestion means the simultaneous combination of multiple feedstocks (i.e., sewage sludge and food
waste) in the digestion system. Anaerobic digestion technologies are widespread, with approximately 40 different
________________
3 Stand-alone digesters: 68; on-farm co-digesters: 59; co-digestion systems at water resource recovery facilities: 77.
Plastic Contamination 8technologies on the market as of 2010 (Arsova, 2010). Digesters are generally one of two styles: wet digesters or
dry digesters. Wet digesters are the more common type and process the substrate (e.g., food waste) into a liquid
slurry form. Dry digesters treat the substrate in dry form and process it into a stacked pile (Arsova, 2010). The
resulting product of anaerobic digestion (digestate) may be dewatered and land applied as a soil amendment,
further processed through composting, or landfilled. After additional pressing and/or centrifugation, the liquid
fraction (or liquor) of the digestate generated by the dewatering process may be land applied as a liquid fertilizer.
The liquor must be fine-filtered prior to application to prevent blockage of feeder pipes or irrigation systems (David
et al., 2016).
3.2. Rejection of Contaminated Waste Streams
When food waste arrives at a composting or anaerobic digestion facility, the material is inspected against criteria
that have been agreed upon with the waste hauler and the facility (Harrington, 2015). Contracts between waste
haulers and facilities may include provisions for the facility to flag a contaminated load, accept a contaminated
load at a higher price to offset contaminant-removal costs, or reject a load if the amount of contamination is too
high (State of Washington, 2017; Harrington, 2015). Reports indicate that rejected loads may be sent to landfills
or combustion facilities instead of being composted or digested (Aspray et al., 2019; ADBA and REA, 2018;
Dilkes-Hoffman et al., 2018; OECD, 2018).
The amount of plastic or other physical contaminants present in food waste that warrants rejection by facilities
before processing is not reported in the available literature, nor is the frequency with which incoming material is
rejected by food waste processing facilities in the United States. However, a 2017 survey of Scottish composters
reported that five of the 15 surveyed site operators rejected between one and three loads because of
contamination and one site operator rejected eight loads due to contamination (Aspray et al., 2019). Nine of the
surveyed site operators did not reject any loads (Aspray et al., 2019). Contamination was defined as plastic,
glass, and metal and the amount of plastic present in these rejected loads was not reported.
In addition to rejecting individual loads of food waste, composters may choose not to accept any food waste
streams for composting due to concern about plastic contamination levels. A 2019 CalRecycle-funded survey
found that 38 percent of large composting facilities in California avoid acceptance of food waste to avoid
contamination (CalRecycle, 2019).
3.3. Operational Challenges Caused by Plastic Contamination
Rejection of incoming food waste with levels of plastic contamination above a facility’s handling capabilities is
critical to maintaining the facility’s operations (ADBA and REA, 2018). Inclusion of plastic-containing products in
collected food waste streams can create problems for composting and anaerobic digestion facilities, which might
not be designed to process feedstock with high volumes of plastic (ADBA and REA, 2018; Brinton et al., 2018).
The overall environmental effect of microplastic contamination in composting operations is still unknown. Under
experimental conditions, polyurethane plastics have been observed degrading during composting, and new
research indicates microplastics may increase or decrease greenhouse gas and ammonia emissions during
composting, depending on the types and characteristics of the plastics (Sun et al., 2020).
It is unknown how composting affects the concentration of microplastics in feedstocks. Given that there is not
sufficient data on microplastic contamination of incoming feedstock and outgoing finished products, it is
impossible to determine the effect of composting on microplastic concentrations. An experimental study by Chen
et al. (2019) indicated that composting decreased microplastics in sewage sludge by almost 44 percent.
Additional data needs to be gathered to determine the effect of composting on microplastics in food waste.
In anaerobic digestion, wet digesters and dry digesters typically can accept different levels of feedstock
contamination due to the different level of solids in the feedstocks they process (McKiernan, 2015). Wet digesters
typically process feedstock with less than 15 percent total solids, whereas dry digesters generally process
feedstock with greater solid content (U.S. EPA, 2021b), thus allowing dry digesters to handle more contamination.
Plastic Contamination 9Dry digesters typically receive food waste from larger operations, such as grocery stores, which regularly dispose
of expired foods or rejected produce (McKiernan, 2015). The different nature and higher content of total solids in
the feedstocks sent to dry digesters require a different approach to pretreatment than is used with wet digesters
(Garaffa and Gröll, 2013).
In summary, dry anaerobic digesters can handle more contamination than wet anaerobic digesters; however, dry
digesters are far less common than wet digesters in the United States. A survey of anaerobic digestion facilities
(U.S. EPA, 2021a, b) reported that all digesters located on-farm or at WRRFs employ wet operations, as did 89
percent of the stand-alone digesters in the U.S.
Plastic contamination may also reduce the environmental and economic benefits of anaerobic digestion, beyond
reducing the quality of products for land application. In general, anaerobic digestion operators prefer organic
waste with a higher dry solids content, like bakery waste, potatoes, meat, and fish, instead of wetter products, like
fruit and vegetables, because they yield more biogas after digestion (Sullivan, 2012). However, these drier
products tend to be packaged and may arrive as feedstock with greater rates of plastic contamination.
Plastic contamination may also impede the production of methane through anaerobic digestion. An experimental
study found that production of methane from the anaerobic digestion of food waste was inhibited in the presence
of plastic materials, including polystyrene, polypropylene, and HDPE (Lim et al., 2018). Methane yields were
reduced up to 10 percent compared with food waste without plastic contamination and greater reductions were
seen when the surface area of the disposable plastic materials was higher (Lim et al., 2018). Under experimental
conditions, the authors hypothesized that the reduction could be due to the production of toxic plastic by-products
or due to reduced contact between microbes and the food waste (Lim et al., 2018). A study of anaerobic digestion
of plastic-contaminated sewage sludge yielded consistent results, with PVC able to decrease methane generation
during anaerobic digestion (Wei et al., 2019).
3.4. Removal of Plastic Contamination
Composting and anaerobic digestion facilities employ a
variety of techniques to remove plastic and other
physical contamination from food waste feedstock. The
techniques used to address physical contamination
vary among facilities as the quality of incoming
material, technical capabilities, and requirements for
finished products also differ among these facilities. The
methods and technologies are expensive and their
effectiveness at removing contamination vary widely
(State of Washington, 2017). Compost facility
operators surveyed in Washington reported that the
most difficult to remove physical contaminants are
glass, rigid plastics, small stickers, plastic film
(including produce and shopping bags), and plastic
garbage bags, and cited safety concerns, costs, and
technology limitations as the key challenges to
removing these contaminants (State of Washington,
2017).
The primary techniques for separating physical
contaminants from incoming food waste are manual
and mechanical removal. Facilities use differing
technologies to implement these techniques (U.S.
EPA, 2021b; State of Washington, 2017; Arsova,
2010). Some facilities employ removal techniques both
before (pre-) and after (post-) processing food waste
into compost or digestate (Aspray et al., 2019).
Plastic Contamination 10Manual Picking
Manual picking or pick lines are commonly used to remove plastic contamination at composting and anaerobic
digestion facilities prior to processing, and in some cases again post-processing, similar to manual sorting lines
used at materials recovery facilities that are part of recycling programs (Aspray et al., 2019). Typically, the
feedstock load is dumped on a large open space or along a moving conveyor system and workers manually
separate large, easily identifiable plastic items. Manual picking also affords for removal of other easily identifiable
non-plastic contaminants, such as wood, cans, and bottles (State of Washington, 2017).
While manual source separation of packaging is possible, it is difficult, labor-intensive work and may not
consistently provide feedstock quality acceptable to anaerobic digestion and composting facilities (Coker, 2019).
Beyond manual picking, facilities use a variety of mechanical removal processes, the most common of which
include screens, separators, and de-packagers (U.S. EPA, 2021b; State of Washington, 2017). The machines
used by compost and anaerobic digestion facilities to mechanically remove contaminants are generally not
specific to food waste and are also used in other MSW and materials recovery facilities. Mechanical removal
processes vary across facilities and different types of facilities accept different levels of contamination depending
on local regulations and individual facility specifications.
Screening Machines
Screening machines, including wind sifters 4, trommel screens 5, and star screens 6, are used to sort out the
contaminants through rotation and tumbling of the organic materials over screens. The size of the holes and their
ability to capture and remove different sizes of plastic fragments vary (Arsova, 2010). Pre-processing screens
have openings of four inches (100 mm) or more, whereas screens used for post-processing or final screening of
compost typically have openings one-quarter inch (6 mm) or three-eighths inch (9 mm) wide (Brinton et al., 2018;
State of Washington, 2017; BioCycle, 2005). However, screens are available with openings as small as one-
eighth inch (3 mm) (Ehm, 2011). Wind sifters are used as a post-processing approach to remove light fractions
(including plastics) from screened compost (Aspray et al., 2019).
Separators
Separators add either water or air to the organic waste and use buoyancy and shear force to separate both the
light floating materials and the heavy nonbiodegradable materials from the organic material (Arsova, 2010). After
pretreatment screening, some wet digestion systems send the waste slurry into hydropulpers in which natural
buoyancy and sedimentation help to separate the waste mixture into fractions. Plastics are separated into the light
fraction and are skimmed off the top. From there, the waste moves into the grit removal system in which small
pieces of heavy material, glass, and sand are removed (BTA International, 2020; Arsova, 2010). In addition to
mechanical removal technologies used during pretreatment, some composting facilities use vacuum systems for
the removal of plastic films from the final compost (Levis et al., 2010).
De-packagers
De-packagers mechanically separate packaging from recovered food waste and are primarily used during pre-
processing (Aspray et al., 2019). De-packagers use characteristics like color, weight, size, shape, density,
hardness, magnetism, electrical conductivity, and light refraction to “code” what the de-packaging system
passively or actively selects for in the mixed feedstock (Coker, 2019). According to the literature, de-packagers
can process about 8–12 tons of feedstock per hour, with some models capable of up to 150 tons/day (Goldstein,
2015; Gorrie, 2015). The most common separation actions employed by de-packagers are shearing, hammering,
horizontal or vertical pressure through a screen, or a combination of these (Coker, 2019; Gorrie, 2015). Many de-
________________
4
Wind sifters use air and suction to remove light materials from screen overflow, which is material that can be returned to compost or digestate as an ideal
structure material (Komptech Americas, 2021).
5 Trommel screens consist of a rotating cylindrical drum and are used for separating materials. When the material enters the drum screen, the material on the
screen surface will turn over and roll so that the qualified material will be discharged through the outlet at the bottom of the drum, and the unqualified material will
be discharged through the outlet at the end of drum (M&C, 2020).
6 Star screens include rotating rubber stars that allow fine material to fall through and larger material to be carried across the screen. The motion of the star screen
also helps break up material (Toto, 2003).
Plastic Contamination 11packager systems use a hopper and conveyor or auger to move the feedstock into a shredder or screw press
(Coker, 2019; Gorrie, 2015).
Different models handle plastics better than others that are more adept at handling corrugated cardboard, for
example. Lighter materials, like water bottles and fruit packaged in plastic, may float to the top in some models
and create a thick layer that does not get ripped open by the chopper at the bottom of the vault (Goldstein, 2015).
Styrofoam, or some plastics that become tangled in the auger and need to be cut out (Gorrie, 2015).
De-packagers have two required inputs: food waste and electricity. Certain models require water as well. De-
packagers are designed to process a heterogenous mix of packaged food waste including materials like plastic,
coated cardboard, and metal cans; however, case studies illustrate that the de-packagers work best with
consistent feedstocks. For example, an anaerobic digestion operator in Ontario that processes both industrial
packaged food waste and residential source-separated organics, found that residential food waste can be very
hard on the de-packaging equipment as it contains a variety of contaminants, and that the more predictable food
waste streams from industry are preferable (Gorrie, 2015).
De-packagers have two end products: the recovered organic material separated from its packaging and the
captured packaging itself. Different de-packagers can produce different outputs depending on what the final
processing will be: wet outputs for use as anaerobic digestion feedstock or dry outputs for composting feedstock.
Recovery and purity are the metrics used to evaluate how effective de-packaging machines are at mechanical
separation (Coker, 2019). Recovery is the percentage of food captured from the original packaged food waste
feedstock, and purity is the percentage of desired material (as opposed to contaminants) in the final food waste
output. While many vendors claim purity and recovery rates of over 99 percent, BioCycle states that food waste
de-packagers typically achieve a 90–97 percent purity and recovery rate, depending on how much food waste
sticks to the packaging after separation (Coker, 2019). However, no peer-reviewed research was found to confirm
these purity and recovery rates, and the contaminant detection methodologies were not provided.
Because de-packaging systems are large and expensive, they are best suited to operations that generate a large
amount of packaged food waste (anywhere from 5 to 20 tons per day) and that have sufficient space for the
system’s installation (Gorrie, 2015; Sullivan, 2012). Although cost information is not readily available for most de-
packaging systems, one operator reported spending more than $1 million on its de-packaging system (Gorrie,
2015). The high costs and space requirements of de-packagers may limit the number of commercial food waste
generators or others who purchase them.
Photo Credit: Thomas Darby, Water Pollution Control, Hermitage, PA
Plastic Contamination 12You can also read


