DEMOGRAPHICS & POLICY RESEARCH BRIEF - CHAPMAN UNIVERSITY
←
→
Page content transcription
If your browser does not render page correctly, please read the page content below
CENTER FOR
DEMOGRAPHICS & POLICY
RESEARCH BRIEF
C H A P M A N   U N I V E R S I T Y

        CENTER FOR
DEMOGRAPHICS & POLICY
RESEARCH BRIEF
C H A P M A N   U N I V E R S I T Y

        CENTER FOR
DEMOGRAPHICS & POLICY
RESEARCH BRIEF
C H A P M A N   U N I V E R S I T Y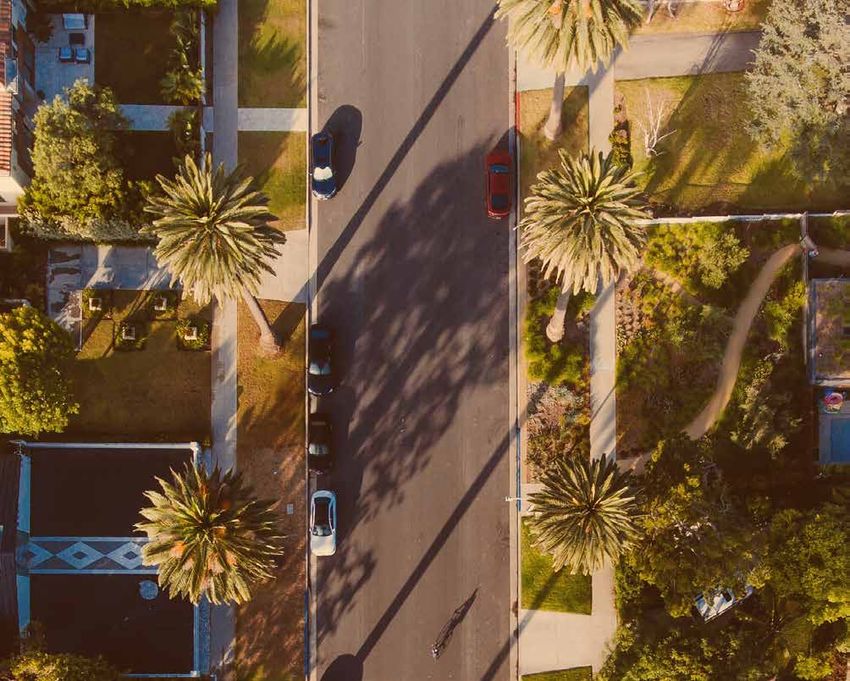
by

Joel Kotkin and Marshall Toplansky

               2018

                      CHAPMAN UNIVERSITY PRESS
CENTER FOR
              DEMOGRAPHICS & POLICY
              RESEARCH BRIEF
               C H A P M A N                      U N I V E R S I T Y

                                   CENTER FOR
              DEMOGRAPHICS & POLICY
              RESEARCH BRIEF
               C H A P M A N                      U N I V E R S I T Y
    “Demographics is destiny” has become somewhat an overused
     phrase, but that does not reduce the critical importance of
     population trends to virtually every aspect of economic, social
     and political life. Concern over demographic trends has been
     heightened in recent years by several international trends —
     notably rapid aging, reduced fertility, large scale migration
     across borders. On the national level, shifts in attitude, gener-
     ation and ethnicity have proven decisive in both the political
     realm and in the economic fortunes of regions and states.
    The Center focuses research and analysis of global, national
    and regional demographic trends and also looks into poli-
    cies that might produce favorable demographic results over
    time. In addition it involves Chapman students in demo-
    graphic research under the supervision of the Center’s senior
    staff. Students work with the Center’s director and engage in
    research that will serve them well as they look to develop their
    careers in business, the social sciences and the arts. They will
    also have access to our advisory board, which includes distin-
    guished Chapman faculty and major demographic scholars
    from across the country and the world.

2   CHAPMAN UNIVERSITY • CENTER FOR DEMOGRAPHICS AND POLICY
ADDITIONAL RESEARCH CENTERS:
The Earl Babbie Research Center is dedicated to empowering students and faculty to apply a
wide variety of qualitative and quantitative social research methods to conduct studies that address
critical social, behavioral, economic and environmental problems. The Center’s mission is to provide
research support and instruction to students, faculty and the broader community, and to produce
research that addresses global concerns including human rights, social justice, peaceful solutions
to social conflicts and environmental sustainability. The Babbie Center supports cutting edge
interdisciplinary research and encourages faculty student collaboration. For more information about
the Earl Babbie Research Center.

The Henley Social Science Research Lab supports undergraduate and faculty research
through a variety of programs. Research assistants staff the lab five days a week and can help
faculty with the collection and analysis of date. They are also available to support students
by providing tutoring in SPSS, GIS and quantitative methods for courses that include
this content. The lab also encourages and facilitates interdisciplinary research with the
creation of faculty work groups and serves as a resource for the community and can provide
consulting services. The Henley lab is pleased to provide consulting for local government and
community groups.

                                                        School of
                                                        Communication

                                                        School of
                                                        Communication

                                                        School of
                                                        Communication

                                                        School of
                                                        Communication

                                                                        CALIFORNIA FEUDALISM           3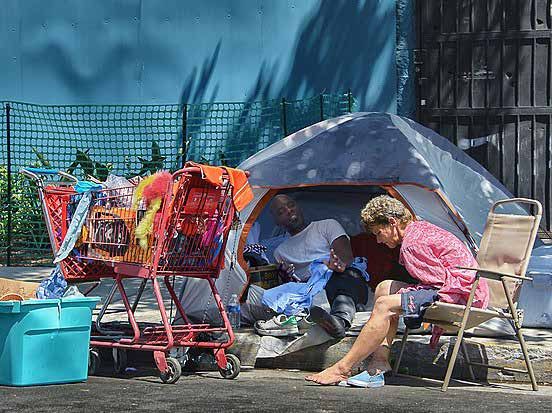
AUTHORS:
    Joel Kotkin (co-author) the RC Hobbs Presidential Fellow in urban futures at Chap-
    man University and director of the Chapman Center for Demographics and Policy
    and executive director of the Center for Opportunity Urbanism in Houston, Texas.
    He is author of eight books and co-editor of the recently released Infinite Suburbia.
    He also serves executive editor of the widely read website www.newgeography.com
    and a regular contributor to the Orange County Register, Forbes.com, Real Clear
    Politics, the Daily Beast and the City Journal.
    Marshall Toplansky is Clinical Assistant Professor of Management Science at Chap-
    man University’s Argyros School of Business and Economics, and Research Fellow
    at the university’s C. Larry Hoag Center for Real Estate. He is also Senior Advisor of
    The Cicero Group, based in Salt Lake City, Utah. A pioneer in the use of big data and
    sentiment analysis, Marshall is formerly Managing Director at KPMG, and co-found-
    er of the firm’s Lighthouse Center of Excellence for Data & Analytics.

    RESEARCH TEAM:
    Wendell Cox (demographic consultant) is a senior fellow at the Center for Opportu-
    nity Urbanism in Houston and the Frontier Centre for Public Policy in Canada. He
    was appointed to three terms on the Los Angeles County Transportation Commis-
    sion, served on the Amtrak Reform Council and served as a visiting professor at the
    Conservatoire National des Arts et Metiers, a Paris university.
    Ali Modarres (geographer) Ali Modarres is the Director of Urban Studies at Uni-
    versity of Washington Tacoma. He served as the editor of Cities: The International
    Journal of Urban Policy and Planning from 1999 to 2017. Dr. Modarres earned his
    Ph.D. in geography from the University of Arizona and holds master and bachelor
    degrees in landscape architecture from the same institution. He specializes in urban
    geography and his primary research and publication interests are the socio-spatial
    urban dynamics of American cities. He has published in the areas of social geog-
    raphy, transportation planning, immigration and public policy. Some of his recent
    publications appear in Current Opinions in Environmental Sustainability, Current
    Research on Cities, Transport Geography, and International Journal of Urban and
    Regional Research.
    Alicia Kurimska (lead researcher and copy editor) has worked both for the Center for
    Opportunity Urbanism and Chapman University's Center for Demographics and Pol-
    icy. She is also an editor for NewGeography.com, a website focusing on economics,
    demographics, and policy. She graduated from Chapman University with a degree
    in history.

4   CHAPMAN UNIVERSITY • CENTER FOR DEMOGRAPHICS AND POLICY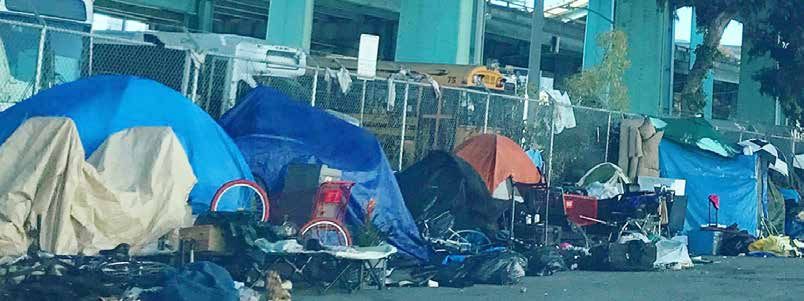
Zina Klapper (editor) is a writer/editor/journalist with many years of national credits. Most recently,
she edited and helped develop a signature 1,200-page volume of 52 essays for MITs Center for Advanced
Urbanism, scheduled for publication by Princeton Architectural Press in 2017. During the past decade, her
international media outreach and writing for the Levy Economics Institute of Bard College has included
numerous commentaries on major news outlets worldwide.
Alex Thomas is from San Jose, CA, and is currently a senior at Chapman University pursuing a B.A. in
Political Science. He has worked for the Metropolitan Policy Program at the Brookings Institution in Wash-
ington, D.C., and hopes to further his interest in public policy through continued study.
Matthew Heinrichs earned a Bachelor of Sciences degree in Psychology from Crean College of Health and
Behavioral Sciences at Chapman University in 2016. He is currently enrolled in Chapman's Master of Busi-
ness Administration program and will be graduating in the Spring of 2019.
Andre Cabrera earned his Bachelor of Sciences degree in Business Administration in June, 2018 from the
Argyros School of Business at Chapman University. Currently, he is a data scientist and analyst in the Me-
dia & Entertainment industry,
Charlie Stephens, social media coordinator, works with leaders to weave new identities and frameworks
that build strong brands and create thriving communities. He is currently a Senior Analyst at the brand
consulting firm, Innovation Protocol, where he has worked with companies such as PayPal, Korn Ferry,
Bureau Veritas, and the Diocese of Orange. Charlie has also performed research for MIT’s Future of Sub-
urbia and Chapman University’s Building Cities for People, and has co-authored articles for the Orange
County Register and The Daily Beast. Charlie holds a dual degree in Business Administration and Public
Relations/Advertising from Chapman University, and an MBA from Chapman’s Argyros School of
Business and Economics.
Wendell Cox is a senior fellow at the Center for Opportunity Urbanism in Houston and fellow at the Center
for Demographics and Policy at Chapman. He also serves on the Board of Advisors of the Center for Demo-
graphics and Policy at Chapman University and is principal of Demographia in St. Louis. He is co-author
of the Demographia International Housing Affordability Survey and author of Demographia World Urban
Areas. He was appointed to three terms on the Los Angeles County Transportation Commission and one
term on the Amtrak Reform Council.

                                                             CALIFORNIA FEUDALISM      5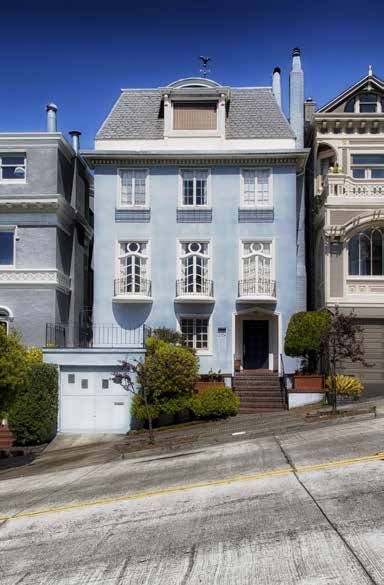
ACKNOWLEDGEMENTS
    This project was the result of a great group effort. We want to acknowledge the lead-
    ing role played by the leadership of Chapman University, notably President Daniele
    Struppa, the dean of Communications, Lisa Sparks, and the dean of the Argyros
    School of Business, Tom Turk. We also received support through the generous gift
    of Chapman Trustee and Orange business executive Roger Hobbs. We are grate-
    ful for the hard work put in by the Office of Research’s Tom Piechota and his team.
    Mogjan Sohrabian played critical roles throughout the project. And finally, we would
    like to thanks our designer extraordinaire, Eric Chimenti, whose creative genius
    shaped this document.
    This effort would never had been possible without the generosity of our donors. We
    are particularly grateful for the role played by the Orange County Water District,
    the Mesa Water District, the Orange County Credit Union, Walter Miers III, and
    Microsoft Corp.

6   CHAPMAN UNIVERSITY • CENTER FOR DEMOGRAPHICS AND POLICY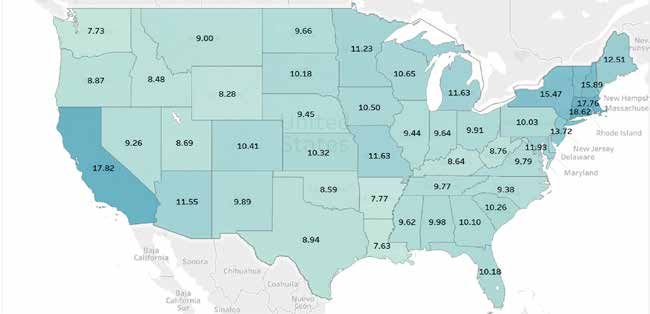
TABLE OF CONTENTS
Authors........................................................................................................................................ 4

I. The Middle-Class Squeeze............................................................................................ 9
       California's Recent Evolution........................................................................10

       The Geography of California's New Feudal Order.......................................... 11

       The Housing Crisis: key Driver of Future Feudalism............................................ 13

       Who Loses Out? Millenials......................................................................... 17

       The Minority Dilemma................................................................................ 18

       Migration Trends....................................................................................... 19

       Who Leaves?...........................................................................................20

       High-Tech Feudalism.................................................................................. 21

       Brave New Valley.....................................................................................23

       Slowing Feudalism's Bright Future..................................................................25

       Housing and Energy..................................................................................26

       Re-Imagining the Future of California.............................................................28

       Infrastructure and Education.........................................................................30

       The Political Challenge............................................................................... 31

II. How Middle-Class Californians Deal with The Financial Squeeze.......... 33
Footnotes and Sources............................................................................................................ 36

                                                                                                          CALIFORNIA FEUDALISM                      7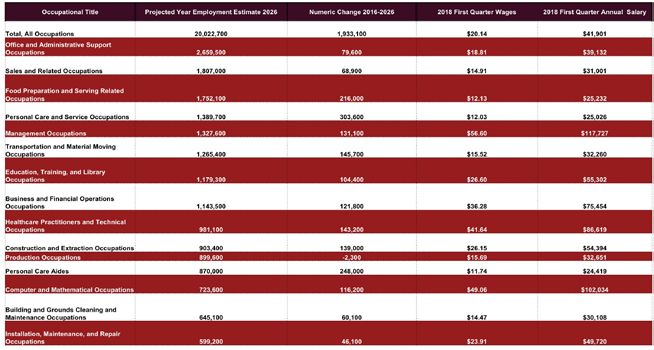
8 CHAPMAN UNIVERSITY • CENTER FOR DEMOGRAPHICS AND POLICY
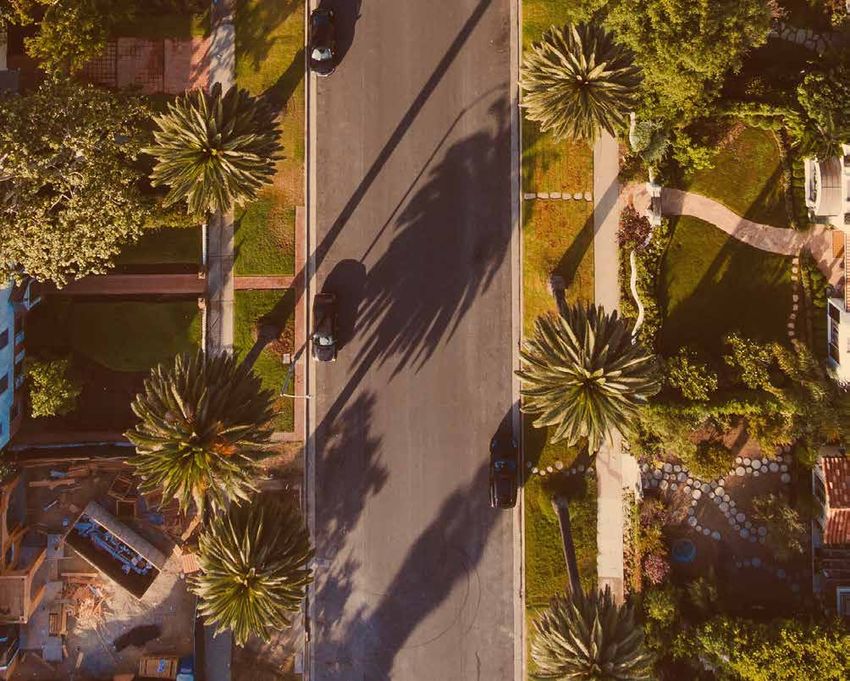
❰ San Francisco city street
THE GREAT MIDDLE- Something is clearly wrong with this
picture. Yet our state leaders, and too
CLASS SQUEEZE many of our business and civic leaders,
are convinced that California, far from
“From the Beginning, being something of a cautionary tale,
offers a great “role model” for the rest of
California promised much. the country.1 The state’s drift towards an
ever more unequal, feudalized society,
While yet barely a name on
characterized by concentrated property
the map, it entered American ownership, persistent poverty levels, and
demographic stagnation does not seem
awareness as a symbol of to concern our Sacramento leadership.
renewal. It was a final What needs to change? If we want to
frontier: of geography again be a place of opportunity for all,
we need to dial down California’s in-
and of expectation." creasingly expensive, messianic land use
and climate change policies, which have
— Kevin Starr, Americans and the dramatically increased housing and
California Dream: 1850-1915 (1973)."
energy costs, forcing individuals and
companies elsewhere. This will allow
EXECUTIVE SUMMARY us to develop more housing and midd
le-class jobs, especially in more afford-
California was built by people with able areas such as the Central Valley and
aspirations, many of them lacking the Inland Empire. A dramatic reform
cultural polish or elite educations, but of our education system, which under-
dedicated to hard work, innovation, serves our next generation, particularly
family and community. A large num- in poor and minority communities,
ber came from other countries or poor needs to be enacted. Other steps, like
backgrounds: sharecroppers from the investing in basic infrastructure—roads,
South, campesinos from Mexico, people dams, electric transmission—could
fleeing communism and poverty in Asia, boost the flagging blue collar economy
escapees from Hitler’s Europe or Okies of the state.
and others fleeing the dust bowl.
This proud legacy is threatened. Cali- “California has now taken on an
fornia has now taken on an increasingly
feudal cast, with a small but growing increasingly feudal cast, with a
group of the ultra-rich, a diminishing small but growing group of the
middle class, and a large, rising seg-
ment of the population that is in or ultra-rich, a diminishing middle
near poverty. Indeed, amidst some of
the greatest accumulations of wealth
class, and a large, rising segment
in history, California has emerged as a of the population that is in or
leader in poverty, particularly among
its minority and immigrant populations
near poverty"
and throughout its interior.
CALIFORNIA FEUDALISM 9California’s Recent Evolution these tech firms—Apple, Netflix, Face-
book, Google—along with Microsoft
California’s economic diversity, which
and Amazon, have achieved a combined
spans agriculture, home-building, aero-
net worth equal to one-quarter of the
space, entertainment and tech, has long
NASDAQ and equal to the GDP of
provided enormous opportunities for a
France. The S&P 500, the broad index of
broad range of residents. Even as recent-
stocks, has a total market capitalization
ly as the 1996-2006 period, California
of approximately $24.2 trillion slightly
job creation was well-distributed in
more than the GDP of the country. They
terms of regions, job types and incomes.
represent 15% of the entire S&P 500
The recovery after the great recession,
companies’ market capitalization.3
which hit California more profoundly
than it did the rest of the country, This has been a heady period for the Bay
Area, with San Jose and San Francisco
(Figure 1) The Bay Area became California’s engine of employment growth from 2007- boasting the first and third highest
17, growing at twice the state’s average. In the decade prior to that, which included the average per capita income in the coun-
“Dot Com/Tech Wreck”, It grew at one-fifth the level of the rest of the state try.4 Between 2007 and 2016, according
to an analysis of Bureau of Labor Statis-
tics data, the Bay Area created 200,000
jobs that paid better than $70,000 annu-
ally. Yet during that same period, high
wage jobs dropped in Southern Califor-
nia and statewide; simply put, the Bay
Area replaced the high wage jobs lost
in the recession while the rest of the
state did not⁵ (Figure 2).
Part of the problem has been big losses
in blue collar jobs, critical to the state’s
working class. California lost 423,700
manufacturing jobs between 1991 and
2016. Such jobs pay significantly better
than the retail and service industry jobs
that have characterized the post-
Sources: Compiled from U.S. Bureau of Labor Statistics, Current Employment Statistics, recession growth. 6 Minimum or near
1997-2017, Total Nonform Employment, Annual Averages (Not Seasonally Adjusted),
extracted from https://www.bls.gov/data/, accessed March 2018. The BLS CES minimum wage jobs in 2015-6 account-
aggregates data for the Bay Area in three regions, San Francisco Redwood City-South ed for almost two thirds of the state’s
San Francisco, San Jose-Sunnyvale-Santa Clara, and Oakland-Hayward-Berkeley
new job growth, notes the state’s Busi-
created a far more narrow, weak, and ness Roundtable.7 These problems have
geographically constrained economy2 arisen in “boom times,” so we should be
(Figure 1). particularly concerned about what will
Today California’s economy is dom- happen if, as appears likely, the econ-
inated by a handful of Bay Area tech omy slows. 8 By late 2017 California’s
firms that have expanded at one of GDP growth rate, once well above the
the most dynamic paces in economic national average, was beginning to fall
history. Most of these companies are in below it.9 Growth in high wage sectors
a relatively constrained geography along like professional and business services
the San Francisco Peninsula. Together, is now slower in Silicon Valley and San
10 CHAPMAN UNIVERSITY • CENTER FOR DEMOGRAPHICS AND POLICYFrancisco than in boomtowns such as (Figure 3) 4 of 10 Lowest Income MSAs in the US Located in California Interior
Nashville, Dallas-Fort Worth, Austin,
Orlando, San Antonio, Salt Lake City,
and Charlotte (Figure 3). Most Califor-
nia metros, including Los Angeles, fell
in the bottom half of the rankings.10
The Geography of California’s
New Feudal Order
California over the past decade has
created great, perhaps even unprec-
edented wealth, but it has done so in
a way that has offered few benefits to
the middle and working classes. Under
Governor Jerry Brown’s father, the late
Governor Edmund G. Brown, California
emerged as a simultaneously capitalist
and admirably social democratic soci-
ety. Brown’s biographer, Ethan Rarick,
described his leadership as having made
the twentieth century into “The Califor-
nia Century,” with our state providing
“the template of American life.” There
was an ‘American Dream’ across the
nation, he noted, but here we had the
‘California Dream.’11 Sources:Pew Social Trends,
Map created with diymaps.net
Today’s state agenda is turning the
dream into something of a nightmare.
California now suffers one of the highest
(Figure 4) Prior to July 2017, California’s GDP Generally Faster Than The Nation. That Gap Has Closed,
and Now Has a Slower Growth Rate than the Country
Sources: Bureau of Economic Analysis, U.S. Department of Commerce, updated July 24, 2018
CALIFORNIA FEUDALISM 11(Figure 6) GINI by State (2016) and Change in GINI 2006–2016 (darkness of bars) of the state. The Inland Empire—with
a population of four million, nearly as
many people as metropolitan Boston—
suffers among the highest poverty rates
of any of the nation’s 25 largest metro-
politan areas.17 Among 229 metropoli-
tan areas, notes a Pew study, three of
the ten metropolitan areas with the
lowest incomes in California’s interior—
Sources: U.S. Census Bureau, American Community Survey Table 19803 for 2016 and Fresno, Merced, Visalia-Porterville and
2006 (1-year estimates), https://factfinder.census.gov, accessed July 2018
El Centro. Pew also found that three
GINI rates —the ratio between the of the ten metropolitan areas with the
wealthiest and the poorest—among the highest proportion of low-income adults
states, and the inequality is growing were also in the California’s interior18
faster than in almost any state outside (Figure 2).
the Northeast, according to liberal econ-
The contrasts between the state’s regions
omist James Galbraith.12 America may
are breathtaking. Eight of the 21 US
be among the least egalitarian nations
counties with the largest number of
in the world, but California is becoming
households with incomes over $200,000
markedly more so now (Figure 4, 8). Its
are in California.19 Yet, California is also
level of inequality is higher than that
home to a remarkable 77 of the coun-
of Mexico, and closer to that of Central
try’s 297 most “economically challenged”
American banana republics like Guate-
cities, according to a scoring of poverty
mala and Honduras than it is to devel-
and employment data by the National
oped states like Canada and Norway. 13
Resource Network.20 Los Angeles, by far
The state’s interior, as well as its far flung the state’s largest metropolitan area, has
exurban and rural areas, have been the among the highest poverty rates of
especially vulnerable. Inland Empire major US metros.21
economist John Husing suggests that
Poverty and the lack of opportunity
the state’s green policies have placed
are greatest in California’s interior, but
it “at war” with home building, energy,
the problem is also substantial within
agriculture and manufacturing.14 This is
affluent coastal counties. In the last
particularly important in regions where
decade, according to the Brookings In-
many residents lack a college education.
stitution, among the nation’s large cities
Educational achievement scoring by
inequality grew most rapidly in San
Wallet Hub shows that five inland areas,
Francisco; Sacramento ranked fourth.22
plus agriculturally oriented Salinas,
According to a recent study by the
rank among the 13 lowest out of 150
California Budget Center, San Francisco
Los Angeles metro areas in the country.15 Unlike
❰
ranks first in California for economic
the far better-educated Bay Area, these
inequality; average income of the top
regions have not built up jobs, infor-
1% of households in the city averages
mation or business services that could
$3.6 million, 44 times the average in-
replace the lost blue-collar positions.16
come of the bottom 99%, which stands
The shift in the economy has created a at $81,094.23
vast swath of poverty across portions
The most fundamental threat to the
12 CHAPMAN UNIVERSITY • CENTER FOR DEMOGRAPHICS AND POLICY(Figure 2) Change in Employment By Wage Level, By California Region,
and U.S, 2007 –2016
Sources: Bureau of Labor Statistics, Census, full years 2007 and 2016. Low wage defined as under $30,000
in 2007 Mid wage defined as $30,000-69,999 in 2007. High Wage as $70,000 and above for all geographic
areas in 2007.
middle class in California is the state’s children lives in deep poverty, states
extremely high cost of living, which has a recent report by the Public Policy
largely been caused by unprecedented Institute of California and the Stanford
house price increases relative to house- Center on Poverty and Inequality. This
hold incomes. More than 80% of the number has risen since the Recession,
higher cost of living in California is the despite the boom. The report noted that
result of higher housing costs.24 45.8% of California’s children lived in or
California, adjusted for costs, has the near poverty.31
overall highest poverty rate in the
country, according to the US Census
The Housing Crisis:
Bureau 25 (Figure 6). A recent United Way Key Driver of Future Feudalism
study showed that close to one in three of At its essence, feudalism was about hier-
the state’s families are barely able to pay archy, and the domination of land own-
their bills.26 Fully one in three welfare ership by a relative few. In the era that
recipients in the nation live in California, preceded feudalism, a strong, land-own-
which is home to barely 12% of the ing middle class played a critical role in,
country’s population.27 for example, the Greek democracy and
Even more tragic has been an explosion the Roman Republic. Later, from seven-
in homelessness, a problem which has teenth century Holland to US post-war
declined in much of the rest of the coun- (Figure 2) Change in Employment By Wage Level, By California Region,
try.28 Los Angeles County has roughly and U.S, 2007 –2016
50,000 homeless people, up 23% since
last year and 75% since 2000. San Fran-
cisco streets have become unhealthy,
due to the presence of syringes, garbage
and feces.29
Today, eight million Californians live
in poverty, including two million chil-
dren.30 Roughly one in five California
Sources: Bureau of Labor Statistics, Census, full years 2007 and 2016. Low wage
defined as under $30,000 in 2007 Mid wage defined as $30,000-69,999 in 2007.
High Wage as $70,000 and above for all geographic areas in 2007.
CALIFORNIA FEUDALISM 13(Figure 8) California & the United States Compared Middle-Aged Income Housing Affordablity: 1970–2017
Sources: Census Bureau, Harvard University and Demographia
urban core favored by California’s poli-
One indication: the home used cies.34 With the constraint on new sub-
urban housing tracts, California prices
by the middle-class Brady have skyrocketed by an inflation-adjust-
Bunch was recently sold for ed 210%, three times the post-1969 na-
tional average. One indication: the home
just under two million. used by the middle-class Brady Bunch
was recently sold for just under two
suburbia, dispersed ownership of land million.35 High housing costs plus rising
was a critical component of dispersed taxes have eroded the financial position
wealth and power and the strengthening of California’s middle-class residents far
of the middle orders. Property remains more than it has hurt their counterparts
key to financial security: Homes today in other states (Figure 8A).
account for roughly two thirds of the
wealth of middle-income Americans32 This trend likely will continue if the
(Figure 8). state keeps opposing new suburban
development.36 Meanwhile, the reg-
Before 1970, California home prices ulatory structure is worsening. Local
(adjusted for incomes) were at about governments have imposed regulato-
the national average; houses in Califor- ry fees that typically add upwards of
nia were barely 10% more costly than $50,000 to the cost of building a new
nationally.33 But the state has imposed home, two and half times the national
increasingly draconian curbs on hous- average. New state demands for “zero
ing growth, particularly in the subur- emissions” homes promise to boost this
ban fringes. In the major metropolitan by an additional $25,000. These kinds of
areas since 2010, 40% of the population policies have tended to raise prices both
growth has been in the outer suburbs elsewhere in the US and abroad.37 The
and exurbs, and less than 10% in the raw cost of meeting California’s green
14 CHAPMAN UNIVERSITY • CENTER FOR DEMOGRAPHICS AND POLICY(Figure 8A)Share of Higher Cost of Living by Factor Los Angles, San Francisco, San Diego, & San Jose.
Sources: Estimated from Dept. of Commerce Data
requirements adds an estimated $150,000 California home ownership from a
per unit and enmeshes construction proj- middle-class staple into a luxury item
ects in years of red tape before approval.38 reserved for the affluent. The income
Nationally homebuilders suggest precon- needed to purchase the median priced
struction costs in California adds up to house in the state has soared. According
42.6 percent of costs compared by 32 % to the National Association of Realtors,
nationally.39 it takes an income of $318,000 to qualify
Perhaps the most pernicious result of for the median priced house in San Jose,
these policies has been to constrain $242,000 in San Francisco, and $146,000
housing production for the single-fam- in the San Diego metropolitan areas. In
ily homes preferred by most families. Orange County, it takes $126,000; it is
Although much wealth has been created
(Figure 9) Residential Building Permits: 2011–2017
and the population has continued to
California Major MAS's in Context
grow, albeit slowly, housing construc-
tion has lagged. California built about
90,000 fewer houses annually from 1980
to 2010 than was necessary to ade-
quately provide for population growth,
according to the Legislative Analyst.40
This is a problem that seems unlikely to
be solved quickly. California’s rate of
issuing building permits for both single
and multi-family housing remains well
below the national average, particularly
compared to prime competitor states,
such as Texas (Figure 9).41
The unintended result has been to turn Sources: Derived from Census Bureau data (Texas A&M Real Estate Center)
CALIFORNIA FEUDALISM 15(Figure 10) Home Ownership Rates Com-
pared California Coastal, Florida, & Texas
Major MSA's
Sources: Derived from American Community
Survey 2016
(Figure 10A) Most Severely Unaffordable
Housing: 2016 10 Most Populous States
Sources: Derived from ACS 2016
(Figure 11) Home Ownership Trend: Age
25-34: 2000–2016:California's
Major Metropolitian Areas
Sources: Derived from Census Bureau data
16 CHAPMAN UNIVERSITY • CENTER FOR DEMOGRAPHICS AND POLICY$160,000 in Los Angeles County. These millennials generally shell out more for
figures are from double to five times the rent or a down payment. According to
national average 42, 43 (Figure 10). Zillow, for workers between the ages of
Perhaps even worse, the biggest differ- 22 and 34 rent costs claim upwards of
ential between California’s prices and 45% of income in Los Angeles and San
national averages occurs at the low end, Francisco, compared to closer to 30% of
which is where people traditionally enter income in Dallas-Fort Worth or Hous-
the market. Not surprisingly, California ton (Figure 12). In Los Angeles and the
now has among the overall lowest home- Bay Area, a monthly mortgage takes, on
ownership rates of any state (Figure average, close to 40% of income, com-
10A). Out of the 75 largest metropolitan pared to 15% nationally. 47
areas, San Jose has the lowest homeown- More and more, the key lies in winning
ership rate in the country, Fresno is 73rd, the birth sweepstakes through inheri-
Los Angeles 72nd, San Diego 71st and San tance. As prices have risen, more buyers
Francisco 66th. Housing policy is quietly have become dependent on money from
reducing the growth of the state’s mid- parents and relatives; roughly one in
dle class by essentially removing many three new loans in California depend
from even the remote possibility of on resources from family, up from one
buying a house. 44 in four just in 2011. In Los Angeles and
Orange Counties, close to 40% of loans Homeless Woman
❰
Who Loses Out? Millennials are based on family money, up from
in San Fransisco
The housing crisis has been felt most by 25% in 2011. Nationally the rate is 26% 48
those who will shape our future, mi- (Figure 12).
norities and millennials. Californians
who are between 25 and 34 years old
suffer the third lowest homeownership
rate (25.3%) in the country, one-third
below the national average, ahead
only of New York and Hawaii. 45 In San (Figure 12) More Than 35% Of Home Mortgages Require Family Assistance for Down
Payments in California, Double the U.S. Rate
Francisco, Los Angeles and San Diego,
according to Census Bureau data, the
25-34 home ownership rates range from
19.6% to 22.6%, approximately 40%
below the national average (Figure 11).
Since 2010 these areas have experienced
far more rapid declines in millennial
homeownership than the national
average and many key competitive
metropolitan areas.
The problem for millennials lies pri-
marily in a toxic combination of high
costs and relatively low salaries. Califor-
nia millennials on average earn about
the same as their counterparts in less
expensive states such as Texas, Minne-
Sources: County-level data via HUD: current through May 2018 https://www.scpr.org/
sota and Washington.46 But California news/2018/07/31/85109/where-do-people-get-money-to-buy-california-homes/
CALIFORNIA FEUDALISM 17The Minority Dilemma Although they make up only 39% of the
state’s population, Latino men, women
Some see proudly multicultural Califor-
and children constitute almost 53% of
nia, where Hispanics and African Amer-
California’s poor.52
icans constitute 45% of the total popula-
tion, as the model for future diversity and For California’s historically disadvan-
inclusiveness. Yet, despite California’s taged minorities, property ownership is
wealth and promise, it has begun a very becoming more difficult. Although some
real retreat from the middle-class growth kids from wealthy families—primarily
that helped to make it a promised land white non-Hispanics or Asians—can
for so many minorities. Almost one third purchase houses with parental help,
of the state’s Hispanics and one fifth of many Latinos and blacks lack those
African-Americans, notes the United resources and are increasingly priced
Way, hang on the edge of poverty (Figure out of the market53 (Figure 15). Califor-
13). Based on cost-of-living estimation nia’s white Non-Hispanic homeowner-
tools from the Census Bureau, 28% of ship rate remains above 62 percent, but
African-Americans in the state live in just 42% of all Latino households, and
poverty, compared with 22% nationally.49 only 33% of all black households own
their own homes.54
Hispanics, the state’s largest ethnic
group, are projected to comprise close to High rents and housing prices have
a majority of the population by 2050.50 forced many minorities to live in de-
Fully one-third of Latinos live in poverty, plorable conditions. One in four An-
compared with 21% that do so outside of gelinos, according to a recent UCLA
the state. Over two-thirds of non-citizen study, spends half their income on
Latinos, the group most loudly defended rent, the highest of any major metro.55
by the state’s progressive leadership, live The California rate of overcrowding is
at or below the poverty line51 (Figure 14). roughly twice the national average.56 Los
(Figure 13) Poverty rates in California are higher than in the US as a whole, across all ethnic groups
Sources: CPS Table Center, https://www.census.gov/cps/data/cpstablecreator.html for official and NAS-
based estimal, Consumer Expenditure Survey (CE)-based threshold and NAS income less medical out of
pocket expenditure (see https://www.census. gov/cps/data/povthresholds.html) and geographic price
difference adjustment.
18 CHAPMAN UNIVERSITY • CENTER FOR DEMOGRAPHICS AND POLICYAngeles County, where the population is Migration Trends
nearly 60% Latino or African-American,
Recent migration patterns reflect this
suffers the highest level of households
growing squeeze on California middle
with “severe overcrowding” (at least 1.5
and working-class families. Net out-
persons per room) of any major metro-
migration, after declining during the
politan area. California’s overcrowding
early years of the recession, has more
rate is the nation’s second-worst.57
than tripled since 2014 (Figure 16). Even
worse, according to a recent UC Berke-
ley study over a quarter of Californians
are considering a move, half of them out
of the state, with the strongest proclivity
found among people under 50.58
(Figure 14) Home Ownership: California &
US 2016: Total & 4 Largest Ethnicities
Sources: Derived from Census Bureau data
(Figure 15) Highest Severe Overcrowding
Rates States & DC: 2016
Sources: Derived from ACS 2016
CALIFORNIA FEUDALISM 19(Figure 16) Net Domestic Migration: 2010-2017 Annual: California This is occurring as California’s popu-
lation growth, once among the nation’s
highest, fell short of expectations and
below the national average last year 59
(Figure 17). As recently s a decade ago,
the California Department of Finance
(DOF) was projecting a population
of nearly 60 million by 2050. Slowing
growth led DOF to reduce the 2050
projection by nearly 10 million based on
the 2010 Census count. 60
Who Leaves?
Of course, population growth itself
Sources: Derived from Census Bureau
does not guarantee prosperity, but there
are some disturbing trends. The state’s
(Figure 17) Declining Population Prospects California Population and Official Projections boosters and the administration itself
like to talk as if California is simply
giving itself an enema to expel its waste,
while making itself an irresistible bea-
con to the best and brightest. 61
The reality, however, is more compli-
cated. An analysis of IRS data from
2015–16, the latest available, shows that
while 56% of those who left the state had
incomes under $50,000 annually, 44%
were at levels above that. Roughly one
in four had an income of over $100,000.
This wealthiest segment left the state at
Sources: Derived from California Department of Finance and Census data almost the same rate as those with in
the lower income strata in recent years
the out-migration of middle and even
(Figure 18) Net Domestic Migration by Income Cakifornia: 2013/14 to 2015/16 wealthy people has grown dramatically62
(Figure 18).
Perhaps even more troubling has been
the age of those leaving. Rather than
largely a migration of people headed
towards retirement, the strongest
out-migration has been concentrated
among people in and around child-
bearing years, most notably the 35 to
44-year-old cohort (Figure 19). Again,
this trend has become more pronounced
in the most recent figures.
The loss of young families is reflected
Sources: Derived from IRS data
in a decline in perhaps the greatest
20 CHAPMAN UNIVERSITY • CENTER FOR DEMOGRAPHICS AND POLICYindicator of societal vitality: family (Figure 19) Net Domestic Migration by Age California: 2013/14 to 2015/16
formation and children. After years of
above average rises in its number of
children, California now suffers its low-
est crude birth rate since 1907. Los An-
geles and San Francisco ranked among
the bottom 10 in birthrates among the
53 major metropolitan areas in 2015 64
High-tech Feudalism
In a way not seen since the land consol-
idation of the Middle Ages when lords
established military control, or perhaps
since the early days of the industrial
revolution, the shift to a digital economy Sources: Derived from IRS data
has created an enormous accumulation
of wealth. 65 Technology has been a ma- The late futurist Alvin Toffler optimis-
jor force in California for decades, but tically saw these tech firms critical to
the current surge, and its extraordinary creating “the dawn of a new civilization,”
concentration, is unprecedented. In the with vast opportunities for societal
five years from 2013 to June 2018, five and human growth. 68 Instead, the tech
technology companies grew in value economy seems to be creating greater
by $2.7 trillion, the fastest increase in inequality, including in its Bay Area
growth over a five-year period in Amer- base. We may instead be heading grad-
ican financial history (Figure 20). The ually towards what the Japanese futurist
value of these five stocks is the equiv- Taiichi Sakaiya described as “a high-
alent of almost 20% of the value of US tech middle age,” where only a wealthy
GDP. In the history of the S&P 500, the few control the commanding heights of
top five companies have never been in the economy and political life. 69
the same industry. According to stock
market analyst Michael Batnick, in past
eras, even though we may have seen "The clustering of so many top firms in
similar or higher percentages of con- Silicon Valley-San Francisco Bay Area has
centration among the top five, they have
been from diversified industries. 66 generated an extraordinary, and
The clustering of so many top firms in youthful, coterie of the ultra-rich."
Silicon Valley-San Francisco Bay Area
has generated an extraordinary, and This is a sad and dramatic change. As
youthful, coterie of the ultra-rich. Some recently as the 1980s, note researchers
70% of the 56 billionaires under 40 Manuel Pastor and Chris Brenner, the
live in California, with 12 in Francisco San Jose area boasted one of the coun-
alone. As the tech firms exploit their try’s most egalitarian economies. Jobs
quasi-monopolies and enjoy exceedingly in manufacturing, assembly, transporta-
high profits, costs are unlikely to make tion and customer support helped mid-
them go elsewhere. 67 dle, and even working-class families to
achieve “the California dream.” The ‘80s,
CALIFORNIA FEUDALISM 21(Figure 20) Top 5 Tech Companies Grew Market Value By $2.7 Trillion in The Last 5 Years . . .
The Largest and Fastest Increase In History
Sources: Source: NASDAQ Stock market data, Yahoo Finance
(Figure 21) Middle-Class Households in Silicon Valley Are Being Replaced With Low- and Upper-Income Household Share of All couty Households,
by Income Segment, 1989 to 2014
Source: Budget center analysis of US Census Bureau data
22 CHAPMAN UNIVERSITY • CENTER FOR DEMOGRAPHICS AND POLICYthey said, were “good times for growth planning agency projects that barely
and equity in Silicon Valley.”70 one in five future jobs will be middle in-
The shift of employment from industrial come; the rest will be at the lower end.78
to software industries has meant fewer At the same time, housing prices are so
opportunities for assemblers and other high that even many Google and Apple
blue-collar workers. Over the past cen- engineers are unable to afford a house
tury, Silicon Valley has greatly expand- in the area. Recruiting new workers has
ed in information jobs, but it has lost become increasingly difficult.79 In a 2014
over 160,000 manufacturing positions.71 survey of more than 200 business exec-
The new software companies simply utives conducted by the Silicon Valley
need fewer workers per dollar than Leadership Group, 72% of them cited
traditional tech firms do; their revenues “housing costs for employees” as the
per employee are two to three times most important challenge facing Silicon
those of, for example, Intel.72 They also Valley businesses. 80
often employ non-citizens on temporary
visas, who now constitute upwards of 40
Brave New Valley?
percent of their workforce.73 The society that Silicon Valley epitomiz-
es seems increasingly like that in Aldous
“Ultimately,” note Pastor and Bren-
Huxley’s Brave New World. Those at the
ner, “what has emerged is a region that
top, the Alphas, live in comfort. Fami-
our key informants almost universally
lies have been abolished except on res-
described as fragmented and divided,
ervations for misfits, and people widely
with the high-tech community largely
enjoy a remarkable access to pleasurable
isolated from the broader region and
pharmaceuticals and unconstrained,
particularly those parts of the region
commitment-fee sex in the city.
that are less fortunate”74 (Figure 21).
The valley may be minting money Huxley’s future eerily resembles the one
for some tech workers, but, as a Joint favored by the oligarchs. As author Greg
Venture Silicon Valley report showed, Ferenstein notes, they house their work-
incomes have declined for the largely ers in a largely childless college campus
working class Latino and African
(Figure 22) In The Bay Area, Top 1% Earn Between 31 and 47 Times More Than The
American population.75 Bottom 99%. In 1989, It Was Between 11 and 17 Times
Urban website CityLab has described
the Bay Area as “a region of segregated
innovation,” where the rich wax, the
middle class wanes, and the poor live
in increasingly unshakable poverty.76
Some 76,000 millionaires and billion-
aires call Santa Clara and San Mateo
counties home. At the other end are
the thousands of people who struggle
to feed their families and pay their bills
each month. Nearly 30% of Silicon
Valley’s residents rely on public or
private assistance77 (Figure 22).
Sources: Keystone Research Center analysis of Franchise Tax Board, Intrnal Revenue
Under current circumstances, we can Service, Thomas Piketty and Emmanuel Saez (2003), US Bureau of Economic Analysis,
and US Cenusus Bureau data
expect more of the same. The regional
CALIFORNIA FEUDALISM 23Homelessness in Los Angeles
❰
similated by the Borg. You get cool new
powers. But having been assimilated, if
your implants were ever removed, you’d
certainly die. That basically captures our
relationship to Google. 84
Not surprisingly, the oligarchs have lit-
tle trouble with this kind of relationship.
Rather than expect their workers or
consumers to grow and achieve greater
independence, notably by owning hous-
es and starting companies, they reject
the idea of dispersing wealth. Gregory
Ferenstein, who interviewed 147 digital
company founders, says most believe
that “An increasingly greater share of
economic wealth will be generated by a
smaller slice of very talented or original
people. Everyone else will increasingly
subsist on some combination of part-
environment, and they will pay women time entrepreneurial ’gig work’ and
workers to freeze their eggs. They are government aid.”85 Such part-time work
serviced by low-wage workers—the Del- has been growing rapidly, accounting
tas, Gammas and Epsilons of Huxley’s for roughly 20 percent of the workforce
world—largely imported from the subur- in the US and Europe and is expected to
ban fringes; in the Bay Area, the largest grow substantially, notes McKinsey. 86
rise in poverty tends to be in exurbs or To keep the hoi polloi in line, numer-
suburbs, far from the best job oppor- ous oligarchs—Mark Zuckerberg, eBay
tunities.81 In some ways, this also has a founder Pierre Omidyar, Elon Musk
historic aspect, recalling the cities of New and founder of seed funding firm Y
Spain where, in late feudal fashion, the Combinator Sam Altman— have em-
upper class clustered in the desirable city braced ideas that mirror policies in
area serviced by native Mexicans forced early industrial Britain that offered a
to live on the periphery.82 ‘proletarian alms bag’ to keep the masses
This increasingly class-bound society is from starvation and off the street. These
not ideal for the very kind of ambitious ideas include, of course, not stripping
upstart who has played such a glorious their own wealth, but having taxpayers
role in the valley’s history. As tech has provide guaranteed wages, health care,
become one of the most concentrated free college and housing subsidies. This
industries, many startups are formed in also has the virtue of helping them
large part to be acquired. The historic expand the use of ‘gig workers,’ who do
startup culture, suggests The Economist, not receive benefits from their employers.
is being strangled by oligarchic domina- Low-paying and inconsistent gig econo-
tion. 83 Notes one online publisher about my jobs are one of the prime reasones for
his firm’s relationship with Google. rising poverty in the Bay Area. 87
If you’re a Star Trek fan, you’ll under- For the next generation, such handouts,
stand the analogy. It’s a bit like being as- including housing subsidies, promise a
24 CHAPMAN UNIVERSITY • CENTER FOR DEMOGRAPHICS AND POLICYfuture not of owned houses, but of rented country. For better or worse, the nation’s
apartments. The oligarchs have tried to progressive intelligentsia sees in our
push legislation that would allow devel- current politics the future of the coun-
opers to build such structures even when try. As Peter Leyden and Ruy Teixeira
they are opposed by neighborhoods and recently suggested, our state is in the
violate established zoning.88 Unable to vanguard of every positive trend, from
grow into property-owning adults, these racial diversity and environmentalism
workers will subsist as rental serfs.89 to policing gender roles. “California,”
they wrote recently in Medium, “is the
"Low-paying and inconsistent future of American politics.”93
gig economy jobs are one of the If this is so, feudalism will have a bright
future, not only here but across the coun-
prime reasons for rising poverty try. The state has upped its greenhouse
in the Bay Area." gas goals to well above those of the Paris
accords, a seemingly impractical level.
Wired magazine’s Antonio Garcia Mar- It has even committed to removing all
tinez has labeled this, ‘feudalism with fossil fuels from its electricity grid, a
better marketing.” In Martinez’s view, policy that seems almost certain to boost
above all is the new aristocratic class, energy prices even higher.94 The new
“…an inner party” of venture capitalists mandate for solar on new houses, for
and company founders.90 Well below example, could increase house prices,
them is an “outer party” of skilled profes- already at absurd heights, by another
sionals, well paid, but given high prices $20,000 without doing much to reduce
and taxes, living ordinary middle-class greenhouse gas (GHG) emissions, notes
lives. Below them lies the vast population Mike Shellenberger.95
of gig workers, whom Martinez com-
pares with sharecroppers in the south,
“…with the serfs responding to a smart
phone prompt rather than an overseer’s Venture
command.” Further below still lie those Capitalists
who constitute, in Martinez’s phrase, & Company
“the Untouchable class of the homeless, Founders
drug addicted, and/or criminal.”
He describes a society that, as in the
Skilled Professionals
Middle Ages, is, “…highly stratified,
with little social mobility.”91 High prices
make it all but impossible for those
who are not highly affluent to own their
homes. Workers in the gig economy,
Gig Workers
much less the “untouchables,” have little
chance to improve their lot.92
Slowing Feudalism’s
Bright Future
“Untouchables”
California’s policy choices are import-
ant, not just for us but for the whole
CALIFORNIA FEUDALISM 25Overall, California’s green regulators time the state has ranked a mediocre 35th
predict that the implementation of nation-wide in GHG reductions.
ever-stricter climate rules will have a And given that in 2010 the state
“small” impact on the economy, pointing accounted for less than 1% percent of
to strong aggregate economic and job global GHG emissions, the dispropor-
growth in recent years.96 tionately large reductions sought by state
Yet this view has been utterly devastated activists and bureaucrats would have no
by a new study from Chapman Universi- discernible effect on global emissions un-
ty, in which coauthors David Friedman der the Paris Agreement. “If California
and Jennifer Hernandez demonstrate ceased to exist in 2030,” Friedman and
that California’s draconian anti-cli- Hernandez note, “global GHG emissions
mate-change regime has exacerbated would be still be 99.54% of the Paris
economic, geographic, and racial in- Agreement total.”
equality.97 The primary impact of climate
regulations, as laid out by Friedman Housing and Energy
and Hernandez, has been to chase away Rather than preen about their policies,
historically well-paying jobs in manu- California policymakers should be able
facturing, energy and home building, all meet the strong goals of the Obama
key fields for working- and middle-class Administration, but not in ways that
Californians. damage the states already beleaguered
And to make things worse, California’s middle and working classes. Instead of
efforts to save the planet have done little imposing policies that are marginally
more than divert GHG emissions to helpful or even harmful, California
other states and countries.98 Since 2007, could encourage biomass use, and clean
when the Golden State’s landmark glob- up the state’s vast forested areas—some
al-warming legislation was passed, note 33 million acres—which could provide
Hernandez and Friedman, California has renewable energy and reduce the exces-
accounted for barely 5% of the nation’s sive emissions from wildfires caused by
GHG reductions (Figure 23). Over that years of forest mismanagement.99
(Figure 23) In The Bay Area, Top 1% Earn Between 31 and 47 Times More Than The Bottom 99%. In 1989, It Was Between 11 and 17 Times
Sources: CALIFORNIA, GREENHOUSE GAS REGULATION, AND CLIMATE CHANGE, David Friedman and Jennifer Hernandez, U.S. Energy
Information Agency, State Carbon Dioxide Emissions Data, October 2017, https://www.eia.gov/environment/emissions/state/, accessed February
2018. Population data from U.S. Census Bureau
26 CHAPMAN UNIVERSITY • CENTER FOR DEMOGRAPHICS AND POLICY(Figure 24) California Has The Second Highest Electricity Rates In The Continental U.S.
Sources: Table 5.6.A. Average Price of Electricity to Ultimate Customers by End-Use Sector, U.S. Energy Information Administration
Overall, California needs to reappraise hurt by high energy prices—have long
its energy agenda. Going 100% re- been key to upward mobility for non-col-
newable by 2045, as the state recently lege-educated Californians.102 Such costs
mandated, is likely to boost energy costs also put stress on many poorer house-
even higher, and put more strains on holds, particularly in the interior, where
middle and working class households.100 roughly 15% percent of residents live
The state’s aggressively green policies, under conditions of “energy poverty.”103
including a shift from nuclear and natu- Similarly, policy-makers should work to
ral gas to renewable energy, have pushed increase housing supply on the periph-
California industrial electricity rates ery, as was common until the early
to a level that is twice as high as those 1970s. State officials insist, for example,
in such competitor states as Nevada, that density will reduce carbon emis-
Arizona and Texas. In early 2018, state sions while improving affordability and
electricity prices were 58% higher, and boosting transit use. Yet, as Los Angeles
gasoline over 90 cents per gallon higher, has pursued densification under state
than the national average101 (Figure 24). and regional policies, housing prices and
These high prices have been particularly rents have soared, but transit ridership
devastating to traditional blue-collar has continued to drop.104 A UCLA report
industries. Manufacturing employ- explains one factor has been the incen-
ment, highly sensitive to energy-related tives for real-estate speculation that have
and other regulations, has declined by
160,000 jobs since 2007. California has "Overall, California needs to
benefited far less from the national in-
dustrial resurgence, particularly this past
reappraise its energy agenda."
year. Manufacturing jobs—along with
those in construction and logistics, also driven the area’s predominantly poor
CALIFORNIA FEUDALISM 27(Figure 25) Transit Boardings: FY 2014-2018 Largest California Urban Areas & National animal populations that cannot survive
in denser areas. Alan M. Berger, co-di-
rector of the MIT Norman B. Leventhal
Center for Advanced Urbanism, has not-
ed that the suburbs millennials will like-
ly inhabit will be different than those of
today: more walkable, environmentally
sustainable, and eventually connected
by autonomous technologies.108
Re-Imagining the
Future of California
Californians have many reasons to seek
Sources: Derived from ACS 2016
change, if not for themselves, for the
transit riders further from trains and next generation. A recent Dornsife/
buses, forcing many to purchase cars 105 Los Angeles Times poll found that only
(Figure 25). 17% of Californians believe the state’s
current generation is doing better than
To allay concerns about housing afford- previous ones. More than 50% thought
ability, the state has allocated about 18-30-year-old Californians were do-
$300 million from its cap-and-trade ing worse.109 Most Californians, both
funds for housing, a meager amount liberal and conservative, have expressed
given that the cost of building afford- concern about the state’s inequality, and
able housing in urban areas can exceed a majority, despite the ‘boom,’ expressed
$700,000 per unit. dissatisfaction with the economy.110
More efficient ways to improve housing One critical priority is to consider poli-
options clearly lie in the marketplace: In cies that allow interior counties with very
suburban development, and in rede- different populations and economic chal-
velopment of retail vacancies and large lenges to employ more growth-friendly
areas of undeveloped or underdeveloped policies. However impressive the wealth
urban lands. Despite the rhetoric from creation in Silicon Valley, the state can-
some urban containment advocates, not thrive with its aristocracy living
California has lots of open land. Barely in coastal splendor while as much as
5% of the state is developed, including all one-third of the population lives amidst
the suburbs and exurbs, and California long-term, persistent poverty (Figure 27).
has the highest urban densities in the Organized labor, at least on the pri-
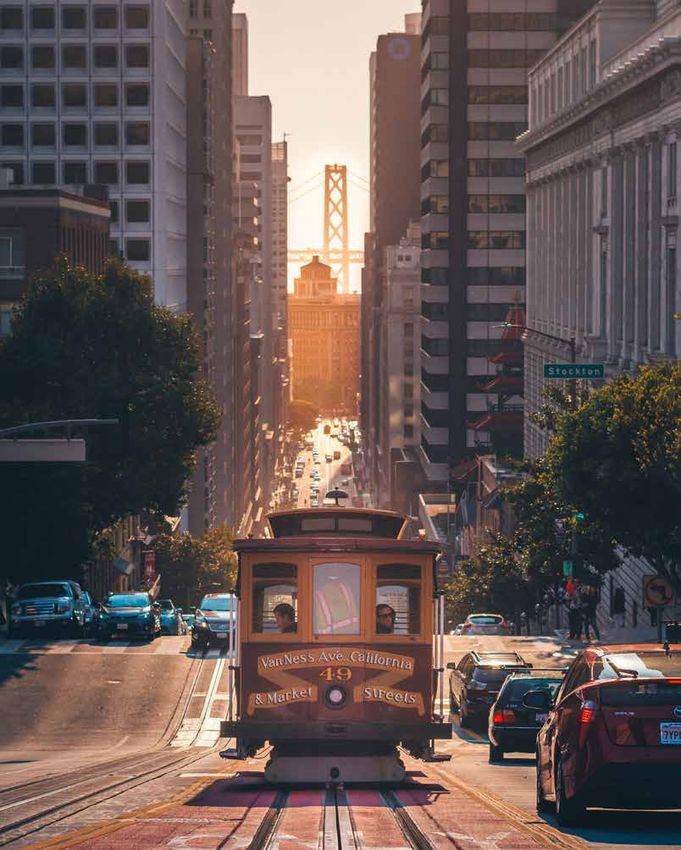
Homes in nation, even higher than New York. 106 vate side, seems to have seen this issue;
❰
San Fransisco There is no inherent contradiction California cannot succeed based only
between suburban development and on high-wage tech jobs and low-wage ser-
sustainability. To implement solar vice ones Yet today the state projects that
power, for example, British economist only two of the fifteen fields expected to
Hugh Byrd notes that spread-out sub- grow by 2026 would be high-wage, and
urbs and their rooftops are far better the average pay will be $41,000, barely a
suited than denser forms.107 Suburban living wage in a high cost state.111
growth could also prove to be a bet- Sadly, the state is driving regions to
ter environment for maintaining wild adopt policies that could exacerbate
28 CHAPMAN UNIVERSITY • CENTER FOR DEMOGRAPHICS AND POLICYYou can also read


