CITY OF RATON Economic Development Strategic Plan - February 2021 - Raton, NM
←
→
Page content transcription
If your browser does not render page correctly, please read the page content below
CITY OF RATON
Economic Development Strategic Plan

 February 2021
CONTENTS
City of Raton ............................................................................................................................................................................................................................................................... i
Figures, Tables, and Maps .................................................................................................................................................................................................................................. vi
Executive Summary ............................................................................................................................................................................................................................................... 1
Interviews and Meetings Summary ................................................................................................................................................................................................................ 3
Demographics .......................................................................................................................................................................................................................................................... 4
 County Population Breakdown .................................................................................................................................................................................................................... 4
 Population Growth ............................................................................................................................................................................................................................................ 5
 Raton .................................................................................................................................................................................................................................................................. 5
 Colfax County .................................................................................................................................................................................................................................................. 5
 Regional Comparison .................................................................................................................................................................................................................................. 6
 Race Profile .......................................................................................................................................................................................................................................................... 7
 Ethnic Profile .................................................................................................................................................................................................................................................. 7
 Language ............................................................................................................................................................................................................................................................... 8
 Age Comparison ................................................................................................................................................................................................................................................. 8
 Raton .................................................................................................................................................................................................................................................................. 9
Downtown Assessment ...................................................................................................................................................................................................................................... 10
 Downtown Designations............................................................................................................................................................................................................................... 10
 Arts and Cultural District ......................................................................................................................................................................................................................... 10
 Metropolitan Redevelopment Area ..................................................................................................................................................................................................... 10
 Economic Offerings ......................................................................................................................................................................................................................................... 11
 Market Demand, Supply, & Leakage.................................................................................................................................................................................................... 11
 Business Landscape ................................................................................................................................................................................................................................... 11
 Workforce Skills .......................................................................................................................................................................................................................................... 11

 ii
Amenities & Events .................................................................................................................................................................................................................................... 12
 Historic Buildings ....................................................................................................................................................................................................................................... 13
 Previous Recommendations ....................................................................................................................................................................................................................... 13
 Historic Preservation ................................................................................................................................................................................................................................ 13
 Small Scale Projects ................................................................................................................................................................................................................................... 13
 Signage ............................................................................................................................................................................................................................................................ 13
Workforce ................................................................................................................................................................................................................................................................ 14
 Age-Dependency Ratio .................................................................................................................................................................................................................................. 14
 Employment Status ......................................................................................................................................................................................................................................... 15
 Unemployment Rate ....................................................................................................................................................................................................................................... 15
 Largest Employers .......................................................................................................................................................................................................................................... 16
 Type of Worker ................................................................................................................................................................................................................................................. 16
Industry Analysis .................................................................................................................................................................................................................................................. 17
 Industry Clusters by Jobs.............................................................................................................................................................................................................................. 17
 Industry Cluster Analysis ............................................................................................................................................................................................................................. 19
 Overview......................................................................................................................................................................................................................................................... 19
 Shift Share Analysis.................................................................................................................................................................................................................................... 20
 Regional Analysis ........................................................................................................................................................................................................................................ 20
 Employment Location Quotient................................................................................................................................................................................................................. 21
 Colfax Location Quotient Analysis ....................................................................................................................................................................................................... 22
 Industry Cluster Matrix ................................................................................................................................................................................................................................. 22
Income and Compensation ............................................................................................................................................................................................................................... 25
 Income and Benefits ....................................................................................................................................................................................................................................... 25
 Poverty ................................................................................................................................................................................................................................................................. 26
Implementation Approach (Mid-2019)....................................................................................................................................................................................................... 28

 iii
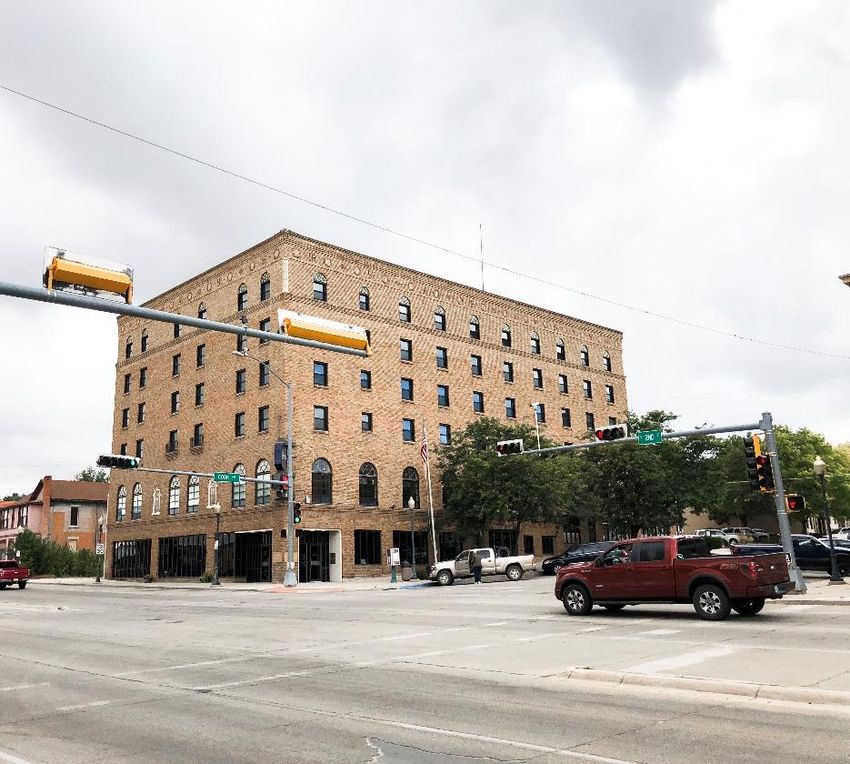
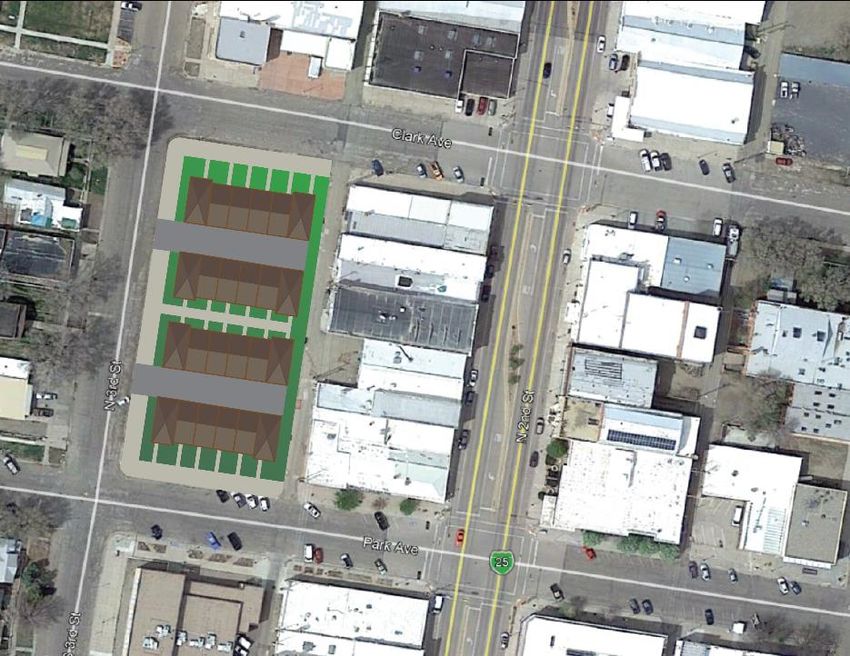
Workforce Development .............................................................................................................................................................................................................................. 28
 Entrepreneurial Infrastructure.................................................................................................................................................................................................................. 28
 Outdoor Recreation ........................................................................................................................................................................................................................................ 28
 Sustainable Economic Development ....................................................................................................................................................................................................... 28
 Downtown Revitalization............................................................................................................................................................................................................................. 29
 Business Retention and Expansion .......................................................................................................................................................................................................... 29
Structured Network............................................................................................................................................................................................................................................. 29
Business Retention and Expansion ............................................................................................................................................................................................................... 31
 Step 1—Get Organized .................................................................................................................................................................................................................................. 32
 Step 2—Analyze Existing Business Retention & Expansion Needs ............................................................................................................................................ 34
 Step 3—Compile an Inventory of Existing Business Development Programs ....................................................................................................................... 35
 Step 4—Develop Programs (as needed) to Assist & Retain Existing Businesses ................................................................................................................. 36
 Role of the Economic Development Team ........................................................................................................................................................................................ 36
Entrepreneurship ................................................................................................................................................................................................................................................. 37
 Analysis and Existing Efforts ...................................................................................................................................................................................................................... 37
 Past Efforts ......................................................................................................................................................................................................................................................... 37
 Current & Future Efforts............................................................................................................................................................................................................................... 38
Downtown Revitalization.................................................................................................................................................................................................................................. 39
 Downtown Revitalization Best Practices .......................................................................................................................................................................................... 40
 Analysis and Existing Efforts ...................................................................................................................................................................................................................... 43
 Yucca Hotel .................................................................................................................................................................................................................................................... 43
 Depot Station ................................................................................................................................................................................................................................................ 44
 Townhome Block Project......................................................................................................................................................................................................................... 45
 Short-Term Goals ............................................................................................................................................................................................................................................. 45
 Medium-Term Goals ....................................................................................................................................................................................................................................... 45

 iv
Long-Term Goals .............................................................................................................................................................................................................................................. 46
Outdoor Recreation ............................................................................................................................................................................................................................................. 47
 Sustainable Economic Development ....................................................................................................................................................................................................... 47
 Conservation and Access .............................................................................................................................................................................................................................. 47
 Equity.................................................................................................................................................................................................................................................................... 48
 Education ............................................................................................................................................................................................................................................................ 49
 Health & Wellness ........................................................................................................................................................................................................................................... 49
 Analysis ................................................................................................................................................................................................................................................................ 50
 National Trends ........................................................................................................................................................................................................................................... 50
 State Trends .................................................................................................................................................................................................................................................. 50
 Local Priorities and the Outdoor Recreation Task Force ........................................................................................................................................................... 51
 looking Forward ............................................................................................................................................................................................................................................... 51
 Infrastructure Possibilities .......................................................................................................................................................................................................................... 51
 Key Relationships ............................................................................................................................................................................................................................................ 52
 Other Possibilities and Suggestions ......................................................................................................................................................................................................... 52
Workforce Development ................................................................................................................................................................................................................................... 54
 Step 1—Organize and Align Resources .................................................................................................................................................................................................. 54
 Step 2—Collect and Analyze Data............................................................................................................................................................................................................. 55
 Step 3—Develop Workforce Career Pathways.................................................................................................................................................................................... 55
 Step 4—The workforce of the Future ..................................................................................................................................................................................................... 55
 Remote and Freelance Work .................................................................................................................................................................................................................. 56
 Step 5—Leverage the Workforce Development Plan ....................................................................................................................................................................... 56
 Step 6—Iterate and Amend the Plan Regularly .................................................................................................................................................................................. 57
 Conclusion .......................................................................................................................................................................................................................................................... 57
Conclusion ............................................................................................................................................................................................................................................................... 58

 v
Next Steps ........................................................................................................................................................................................................................................................... 58
Appendix I—Economic Recovery and Resilience ................................................................................................................................................................................... 59
 Urgent Needs (April 2020) .......................................................................................................................................................................................................................... 60
 Economic Recovery Fund ........................................................................................................................................................................................................................ 60
 Cash Grants .................................................................................................................................................................................................................................................... 60
Appendix II—Goals Diagram ........................................................................................................................................................................................................................... 62
Appendix III—Ogden Community Foundation Case Study ................................................................................................................................................................. 63
 History and Funding ....................................................................................................................................................................................................................................... 63
 The AmeriCan Building ................................................................................................................................................................................................................................. 63
 What is a Community Foundation? .......................................................................................................................................................................................................... 66
 Steps to Success ................................................................................................................................................................................................................................................ 67
 Conclusion .......................................................................................................................................................................................................................................................... 67

FIGURES, TABLES, AND MAPS
Figure 1—Interviews and Meetings Word Cloud...................................................................................................................................................................................... 3
Figure 2—Colfax, Raton Decennial Population Trends .......................................................................................................................................................................... 5
Figure 3—Raton Population Trends............................................................................................................................................................................................................... 5
Figure 4—Colfax County Population Trends .............................................................................................................................................................................................. 6
Figure 5—Population Growth County Comparison ................................................................................................................................................................................. 6
Figure 6—Percent County Population Growth .......................................................................................................................................................................................... 7
Figure 7—Race Profile Comparison (2016) ................................................................................................................................................................................................ 7
Figure 8—Hispanic/Latino Profile Comparison........................................................................................................................................................................................ 8
Figure 9—Language Spoken at Home............................................................................................................................................................................................................ 8
Figure 10—City, County, State Median Ages over Time ......................................................................................................................................................................... 9
Figure 11—Raton Age Demographics (2017) ............................................................................................................................................................................................ 9
Figure 12—Raton Demographic Changes (2010 to 2017).................................................................................................................................................................. 10
Figure 13—Raton Business Mix ..................................................................................................................................................................................................................... 11

 vi
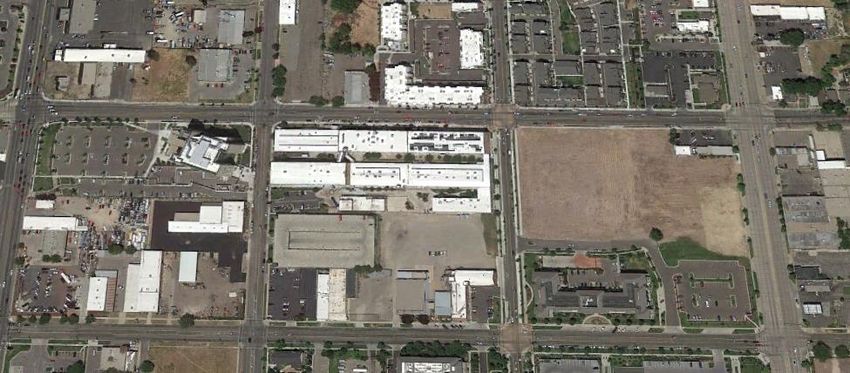
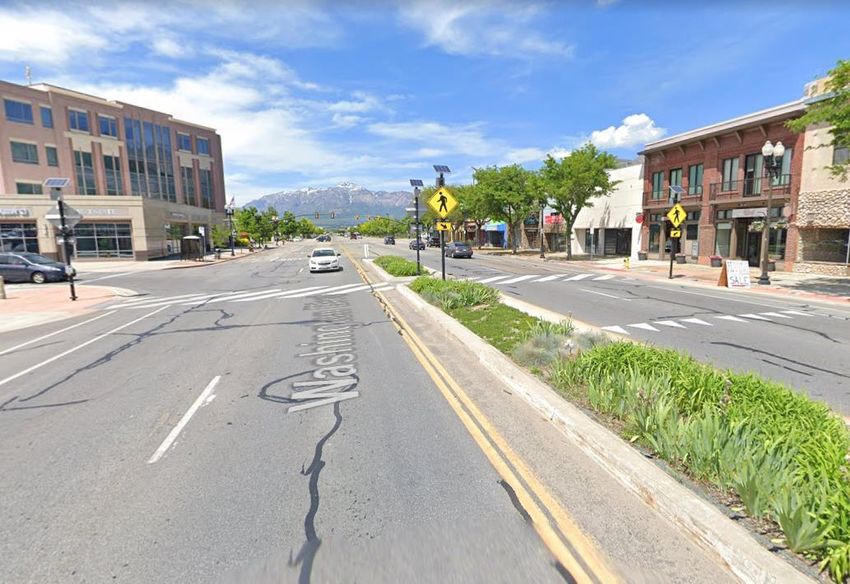
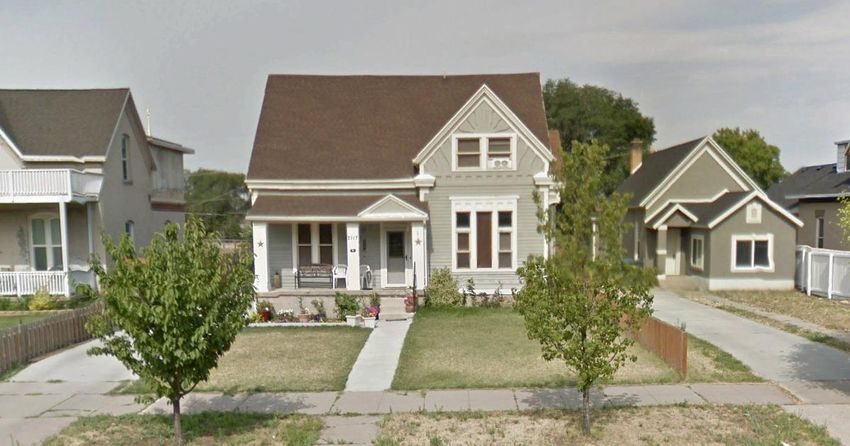
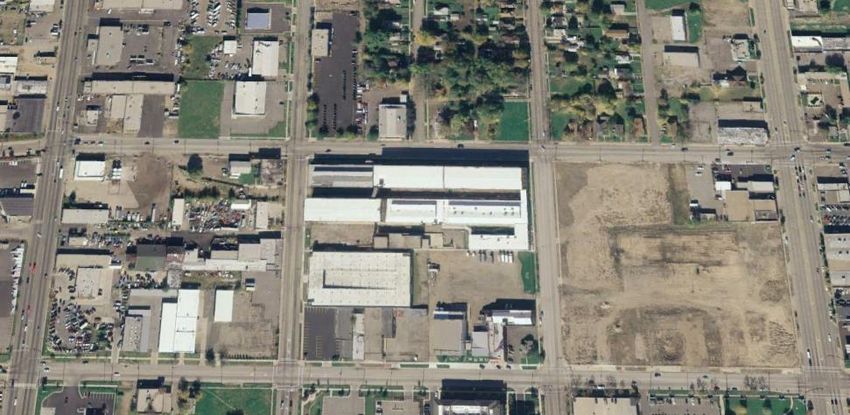
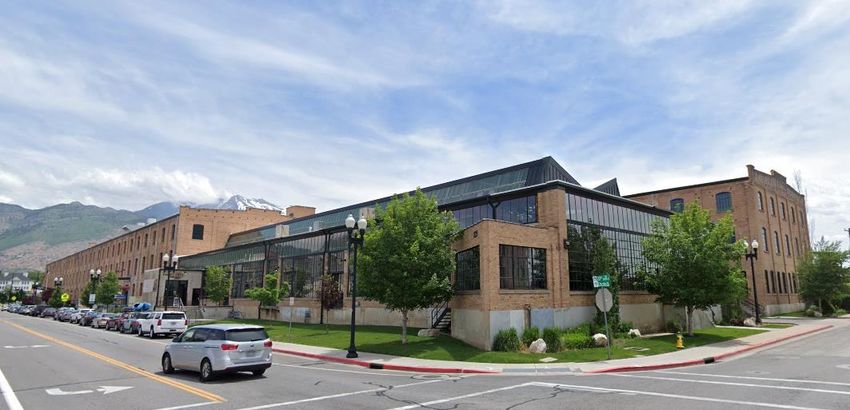
Figure 14—Dependency Ratio Comparison .............................................................................................................................................................................................. 14
Figure 15—Employment Status Comparison ........................................................................................................................................................................................... 15
Figure 16—City Employment and Unemployment Rate...................................................................................................................................................................... 16
Figure 17—Class of Worker Comparison ................................................................................................................................................................................................... 17
Figure 18—Number of Jobs by Industry Type, 2017 ............................................................................................................................................................................ 18
Figure 19—Total Payroll by Industry, 2017 ............................................................................................................................................................................................. 18
Figure 20—Colfax County Shift Share Analysis (2012-2016) ........................................................................................................................................................... 20
Figure 21—Regional share in Job Growth (2016-2017) ...................................................................................................................................................................... 21
Figure 22—Colfax Location Quotient Vs. New Mexico, 2017 ............................................................................................................................................................. 22
Figure 23—Industry Cluster Analysis, 2013-2017 ................................................................................................................................................................................ 24
Figure 24—Income Statistics Comparison ................................................................................................................................................................................................ 26
Figure 25—Income and Benefits Comparison ......................................................................................................................................................................................... 26
Figure 26—Poverty Rate by Family Type Comparison ........................................................................................................................................................................ 27
Figure 27—Poverty Rate by Age Comparison .......................................................................................................................................................................................... 27
Figure 28—Structured Network Map .......................................................................................................................................................................................................... 30
Figure 29—Downtown Park City, Utah ....................................................................................................................................................................................................... 40
Figure 30—Downtown Ogden, Utah ............................................................................................................................................................................................................ 42
Figure 31—Yucca Hotel ..................................................................................................................................................................................................................................... 44
Figure 32—Raton Depot Station .................................................................................................................................................................................................................... 44
Figure 33—Multiple Use Considerations ................................................................................................................................................................................................... 48
Figure 34—Gartner Hype Cycle for Emerging Technologies ............................................................................................................................................................. 56
Figure 35—Building Before Renovations................................................................................................................................................................................................... 63
Figure 36—Building During Renovations .................................................................................................................................................................................................. 64
Figure 37—Building After Renovations ...................................................................................................................................................................................................... 64
Figure 38—Built Environment, 2007 & 2019 .......................................................................................................................................................................................... 65
Figure 39—Fourplex in downtown Ogden, renovated as a single-family home. Click this link for news coverage of the property ................... 66

Table 1—County Population Breakdown..................................................................................................................................................................................................... 4
Table 2—Colfax County Largest Employers .............................................................................................................................................................................................. 16
Table 3—BR&E Roles ......................................................................................................................................................................................................................................... 33

Map 1—Colfax County .......................................................................................................................................................................................................................................... 4

 vii
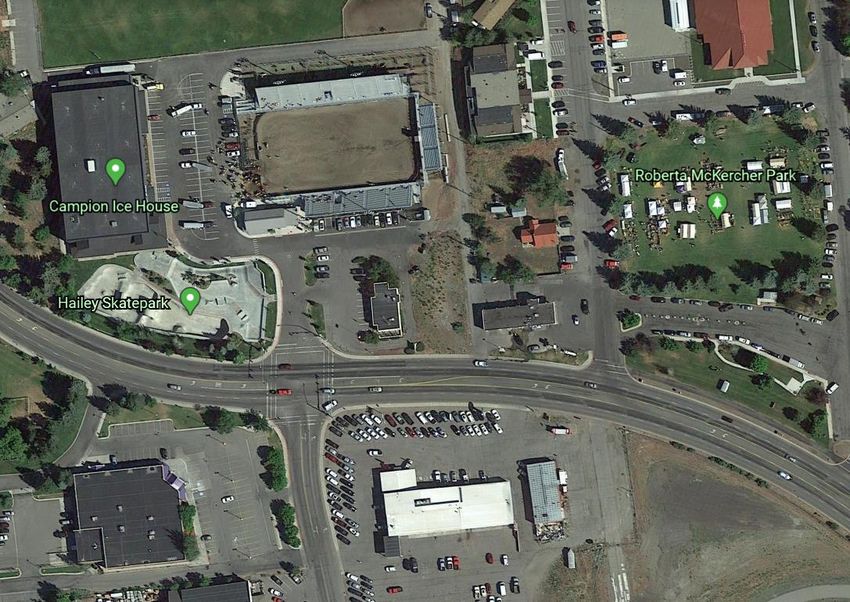
Map 2—Hailey, ID................................................................................................................................................................................................................................................. 42
Map 3—Townhome Project Concept Map ................................................................................................................................................................................................. 45
Map 4— Outdoor Recreation Value Added (Percent of State GDP) ................................................................................................................................................ 50

 viii
which Better City presented its scope of work and key trends
EXECUTIVE SUMMARY highlighted during the first visit.
Better City was hired by the City of Raton (the “City”) in January Key findings and recommendations from the initial assessment
2019 to assist in conducting economic development initiatives, and community visit were delivered to the City in March 2019 in
including reviewing past project recommendations, conducting a report titled “Market Conditions & Demographic Trends
an economic assessment of the City, and providing strategic Assessment” (the “Assessment”). The assessment has been added
project recommendations for further development. Better City’s to this report and can be found beginning on page three. Included
efforts were specifically targeted toward strategy defined through in that report are strategic recommendations outlining Focus
implementation and was later adjusted to include the creation of Areas which the City should adopt as economic development
this economic development strategic plan. priorities. These included workforce development,
Raton has several economic development partner organizations, entrepreneurial infrastructure, outdoor recreation, downtown
including MainStreet, GrowRaton!, and the Center for Community revitalization, business retention and expansion, and sustainable
Innovation. Each of these non-profits has provided significant economic development. This Assessment has been incorporated
value to the Community, such as roundtable discussions, into the strategic plan and comprises pages 8 through 34 of this
beautification and redevelopment efforts, business recruitment, document.
and workforce development and skills training. However, each of Better City returned to the community in May 2019 to meet with
these organizations is staffed by volunteers and/or underpaid the City Commission to lead training sessions on each Focus Area,
staff who are supported by grants or through small service empowering the commission to better understand basic economic
contracts with the City. Due to the number of organizations and development principles for each area and to provide them with a
priorities, economic development efforts lack focus and dedicated decision-making framework. Within the context of the sustainable
resources. Through its engagement, Better City recognized that economic development Focus Area, dedicated funding was
these organizations needed to be strengthened and that a identified as a needed step to create local capacity for
different approach was needed to drive better results. implementation. Fortuitously, a State law was passed in early
Better City began its engagement with a visit to the community 20191 which allowed the City to dedicate 0.2375 percent of Gross
between March 4 and March 8, 2019. During this visit, Better City Receipts Tax (GRT) to be used for economic development. The
conducted interviews with key stakeholders and toured the GRT could be enacted through the adoption of an ordinance.
community with the City Manager and Mayor. In total, more than A public meeting was held in June to involve the public in these
38 one-on-one interviews were conducted, along with several Areas of Focus and to allow the Commission to have a dialogue
roundtable discussions and participation in a meeting of the local with Community members and stakeholders about the desired
chapter of the Rotary Club, along with a public open house in approach and strategy. In addition to the Areas of Focus, the

1 New Mexico House Bill 479

 1
commission also introduced the GRT option and how additional • Historic downtown buildings are simultaneously an asset
funds for economic development would be used to fund activities and a liability for the community (Downtown Assessment)
in the areas of focus and to hire an economic development • The City and County have high rates of people who are not
director. The ordinance for the GRT option was passed by the City in the labor force, leading to low employment levels
Commission in August 2019 and went into effect in January 2020. (Workforce)
In late 2019, the City hired an economic development director, • Government and government enterprises make up the
thereby creating the local capacity for implementation. most significant share of the County’s economy (Industry
 Analysis)
This document expands on the recommendations provided in the
 • While Arts, Entertainment, and Recreation provides the
Assessment, reflects implementation activities accomplished by
the City, and incorporates guidance from the Commission and second-highest number of jobs in the County, it is also the
responses from the public meeting and subsequent visits and lowest ranking reported industry in total payroll
discussions with City leadership. This document organizes and (Industry Analysis)
details all the activities mentioned above, providing background • The industries which have experienced the largest
findings and economic data, strategies for development, and amount of growth between 2013 and 2017 were
short-, medium-, and long-term goals for each Focus Area. A “Government and Government Enterprises” and
summary of the short-, medium-, and long-term goals can be “Accommodation and Food Services” (Industry Analysis)
found in the goal matrix in Appendix I. • The industries which saw the most significant job losses
 over the period were “Other Services (Except
The key findings of the Assessment section (pages 8 through 34 Government)” and “Transportation and Warehousing”
below) are presented briefly in the list below. Each item is (Industry Analysis)
discussed more in-depth in the respective section of the report, as • Regional, not local, factors are helping job growth in most
shown in parenthesis after each item: industry categories (Industry Analysis)
 • The industries with the greatest concentration are
 • Colfax County has experienced a significant population
 “Forestry, Fishing, and Related Activities,”
 decline in the past century, with marginal upticks in
 “Accommodation and Food Services,” and “Other Services
 population growth between 1970 and 2000 (Population
 (Except Government)” (Industry Analysis)
 growth).
 • There is growth in the retired-age population of the
 community, especially from in-migration from other areas
 (Population growth).
 • Resident spending is not enough to support a wide
 expansion of downtown businesses given current incomes
 and population (Downtown Assessment)

 2
INTERVIEWS AND MEETINGS SUMMARY
During the week of March 3rd, 2019, Better City conducted more
than 38 one-on-one interviews, several roundtable discussions,
and a meeting with the local chapter of the Rotary Club, all of
which culminated in a two-hour community meeting. The purpose
of this process is to 1) interface directly and build relationships
with community leaders and members from a wide range of
experiences and backgrounds, 2) hear individual and well as
group-based perspectives of community issues and goals, and 3)
to find and understand the community’s local strategic assets.
Major themes that were brought up during this week are shown
in Figure 1. Such common themes include the availability and
diversity of human capital, a sense of community and opportunity,
and the availability of natural resources.
However, some common issues were also brought up, such as the SOURCE: Wordclouds.com, Better City
lack of workforce skills, school district performance, and a general
 Figure 1—Interviews and Meetings Word Cloud
lack of clarity regarding services and programs being offered by
the City’s disparate foundations, nonprofits, religious
organizations, and other groups.
Many of the concerns brought up by the community will be
addressed in the following sections of this report. Themes brought
out in the interviews and meetings will also guide the economic
development strategy described in the recommendations section
of the report.

 3
DEMOGRAPHICS
Demographic trends are important for understanding the makeup
and movement of the residents of the City of Raton (the “City”). An
analysis was conducted to examine the City and Colfax County
(the “County”) demographic trends with an eye to how they relate
to economic development.

COUNTY POPULATION BREAKDOWN
The population of the County is concentrated in and around the
City, with 59 percent of the population in the City and the
remaining Raton Census County Division (CCD) area. Raton is the
only incorporated city in the County and serves as the county seat.

 2017 Pop. % of
Community Designation (Est.) Total
 SOURCE: Google Maps
Angel Fire Village 1,216 9%
Cimarron Village 1,021 7% Map 1—Colfax County
 Remainder Cimarron CCD 877 6% Just over a third of the County’s population resides in and around
Eagle Nest Village 290 2% towns along U.S. Route 64. These are Springer and its remaining
Maxwell Village 254 2% CCD area (15 percent), Cimarron and its remaining CCD area (13
Raton City 6,885 50% percent), and Angel Fire (9 percent).
 Remainder Raton CCD 1,177 9%
 The remaining population lives in smaller communities located in
Springer Town 1,047 8%
 the central and western parts of the County, such as Eagle Nest (2
 Remainder Springer CCD 912 7%
 percent), Maxwell (2 percent), and Ute Park (1 percent).
Ute Park CDP 71 1%
Colfax County 13,750 100% Map 1 shows the size and shape of the County, with Raton situated
SOURCE: ACS 2010 Census Summary Profile near the northern border. The three main thoroughfares in the
CCD = Census County Division; CDP = Census Designated Place County are Interstate 25, U.S. Route 64, U.S. Route 87, and U.S.
 Table 1—County Population Breakdown Route 412.

 4
POPULATION GROWTH Raton

Colfax County has experienced a significant population decline in Since 1980, the City has experienced an average of 0.36 percent
the past century, with marginal upticks in population growth decline per year.
between 1970 and 2000. After 2000, the population began to
decline again, but at a relatively slower pace (0.18 percent per
year). This decline is likely attributable to a larger national
demographic trend, wherein people are leaving rural areas for
urban locations.
Population change has been relatively stable within City limits,
with a population increase of 13 percent from 1920 to 2017. The
current City population is on the decline, however, with a
decrease of 24 percent from 1980 to 2017.

 SOURCE: City and Town Intercensal Datasets, 2000-2010, 2010-2017

 Figure 3—Raton Population Trends

 Colfax County
 The County’s population has experienced a consistent decline in
 the past decade, with an average decrease of 1.29 percent per year
 between 2011 and 2017. A more specific analysis of the
 demographic changes shows that, while the County has
 experienced more deaths than births (a negative natural
 increase), the loss of population is largely attributable to negative
SOURCE: City and Town Intercensal Datasets net migration.
 Figure 2—Colfax, Raton Decennial Population Trends

 5
City-level data show that the loss of individuals mostly comes
from the 25 to 54 age groups (except for a slight uptick in the 30
to 34 age cohort). These percentage change estimates are
analyzed in the age comparison section (see figure11).

 SOURCE: US Decennial Census Datasets

 Figure 5—Population Growth County Comparison

 When looking at percent-growth per decade, similarities in
SOURCE: US Census Annual Population Estimates 2010-2017 fluctuations are apparent for the overall region. Each county
 experienced periods of growth in the 1960s and 1970s. Each of
 Figure 4—Colfax County Population Trends the counties, even Taos, have had a decrease in their population
 between 2010 and 2017.
Regional Comparison
Most of the Counties surrounding Colfax County have also
experienced population decline in the last century, although the
fluctuation for Union, Mora, and Las Animas has been minimal
since 2000. Taos County alone has experienced significant
population growth, mostly between 1970 and 2010 (see Figure 5).

 6
SOURCE: US Decennial Census Datasets SOURCE: ACS 2017 5-year Estimates

 Figure 6—Percent County Population Growth Figure 7—Race Profile Comparison (2016)

RACE PROFILE Ethnic Profile

According to the 2017 Census estimates, Raton is racially Of respondents in Raton, approximately 25 percent identified as
homogenous, with almost 90 percent of the respondents Mexican, and 33 percent identified as other Hispanic/Latino. The
identifying as White. The remaining respondents identify as remaining 42 percent of respondents did not identify as
Black/African American (0.4 percent), American Indian (2.9 Hispanic/Latino.
percent), and other (6.9 percent). In Colfax County, approximately 18 percent identified as Mexican,
The County has a similar racial breakdown, with 88.1 percent 31 percent as Other Hispanic/Latino, and 51 percent identified as
identifying as white, 0.7 percent identifying as Black/African not Hispanic/Latino (see Figure 8).
American, 2 percent identifying as American Indian, and 8.8
percent as other.

 7
SOURCE: ACS 2017 5-year Estimates SOURCE: ACS 2017 5-year Estimates

 Figure 8—Hispanic/Latino Profile Comparison Figure 9—Language Spoken at Home

LANGUAGE AGE COMPARISON
A large share of the population in Raton (approximately 80 Raton’s median age has increased over time, from 39.7 in 2000 to
percent) speak only English at home, and the remaining speak an estimated 46.6 in 2017. Colfax County similarly saw an
Spanish (19 percent) or another language (1 percent). Colfax increase in median age between 2000 and 2017, from 40.8 to 48.8
County has similar language diversity (78 percent speak English, years. The State has grown older over the same period, although
21 percent speak Spanish, and 1 percent speak another language with a less extreme change, from 34.65 in 2000 to 37.3 in 2017
at home). (see Figure 10).

 8
You can also read