City of San Antonio Electric Vehicle Fleet Conversion and City-Wide Electric Vehicle Infrastructure Study - Electric Vehicle Fleet Conversion and ...
←
→
Page content transcription
If your browser does not render page correctly, please read the page content below

City of San Antonio Electric Vehicle Fleet Conversion and City-Wide Electric Vehicle Infrastructure Study
Agency Project Leads

Project Team

         Angel Gonzalez                   Geoff Morrison, PhD           Miyoung Squire
          Brian Fariello                      Kelly Blynn
                                               Elise Emil
                                               Cian Fields
                                           Damon Fordham
                                              Toral Patel
                                            Carson Peacock
                                             Philip Quebe
                                             James Schroll

Special Thanks
Douglas Melnick, City of San Antonio Chief Sustainability Officer
Julia Murphy, City of San Antonio Deputy Chief Sustainability Officer
Ruben Flores, City of San Antonio Fleet Services Administrator
John Bailey, Natural Resources Defense Council
City of San Antonio Accessibility Office
City of San Antonio Development Services Department
City of San Antonio Government & Public Affairs Office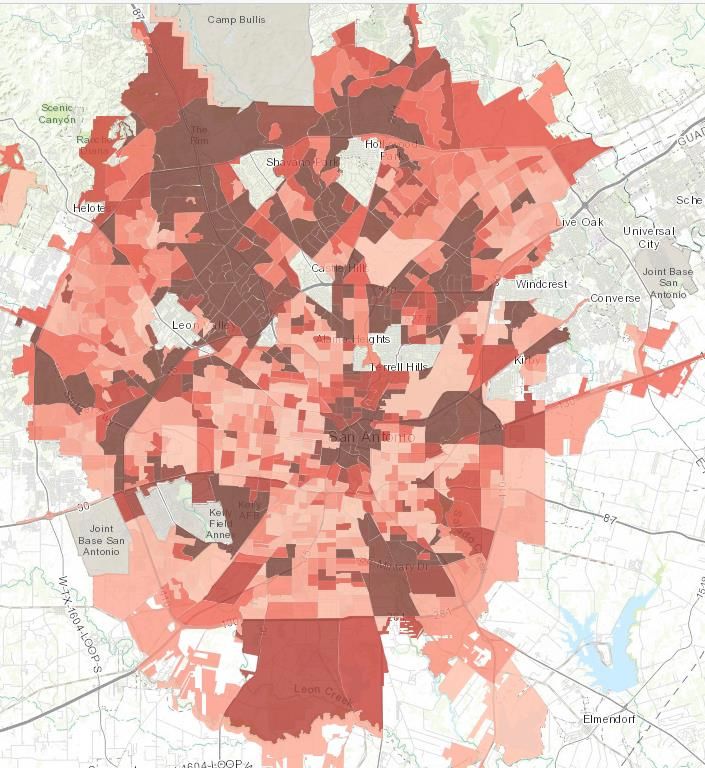
TABLE OF CONTENTS
TABLE OF CONTENTS..................................................................................................................................... ii
MESSAGE FROM THE MAYOR ...................................................................................................................... iv
GLOSSARY..................................................................................................................................................... vi
EXECUTIVE SUMMARY .................................................................................................................................. 1
1.     INTRODUCTION ..................................................................................................................................... 5
     1.1.      Context within San Antonio .......................................................................................................... 5
     1.2.      Municipal Actions.......................................................................................................................... 6
     1.3.      Utility Actions (CPS Energy) .......................................................................................................... 6
     1.4.      State Actions ................................................................................................................................. 7
2.     COMMUNITY EV STRATEGIES ............................................................................................................... 9
     2.1.      Barriers to Electric Vehicle Ownership ......................................................................................... 9
     2.2.      EV Charging Needs Assessment .................................................................................................. 12
     2.3.      Permitting, Codes, Parking Requirements, and Signage ............................................................. 16
     2.4.      Strategies to Increase EV Adoption ............................................................................................ 19
     2.5.      Resiliency and Electric Vehicles .................................................................................................. 23
3.     EVs AND EMERGING MOBILITY ........................................................................................................... 25
     3.1.      Park and Rides and Transit Centers ............................................................................................ 25
     3.2.      Airports ....................................................................................................................................... 25
     3.3.      Transportation Network Companies .......................................................................................... 25
     3.4.      Emerging Mobility Options ......................................................................................................... 26
4.     MUNICIPAL FLEET ELECTRIFICATION .................................................................................................. 27
     4.1.      Current Municipal Fleet Composition in San Antonio ................................................................ 27
     4.2.      Methodology of Fleet Electrification Analysis ............................................................................ 28
     4.3.      Results and Recommendations................................................................................................... 29
5.     COMMUNICATIONS AND STAKEHOLDER ENGAGEMENT PLAN .......................................................... 33
     5.1.      Levels of Engagement ................................................................................................................. 33
     5.2.      Stakeholder Concerns and Resources ......................................................................................... 34
     5.3.      Communication and Engagement Strategies.............................................................................. 35
6.     INCREASING EV ADOPTION IN UNDERSERVED COMMUNITIES .......................................................... 41
     6.1.      Socioeconomic Challenges Impeding EV Adoption..................................................................... 41
     6.2.      Example Municipal EV Programs for Underserved Communities .............................................. 42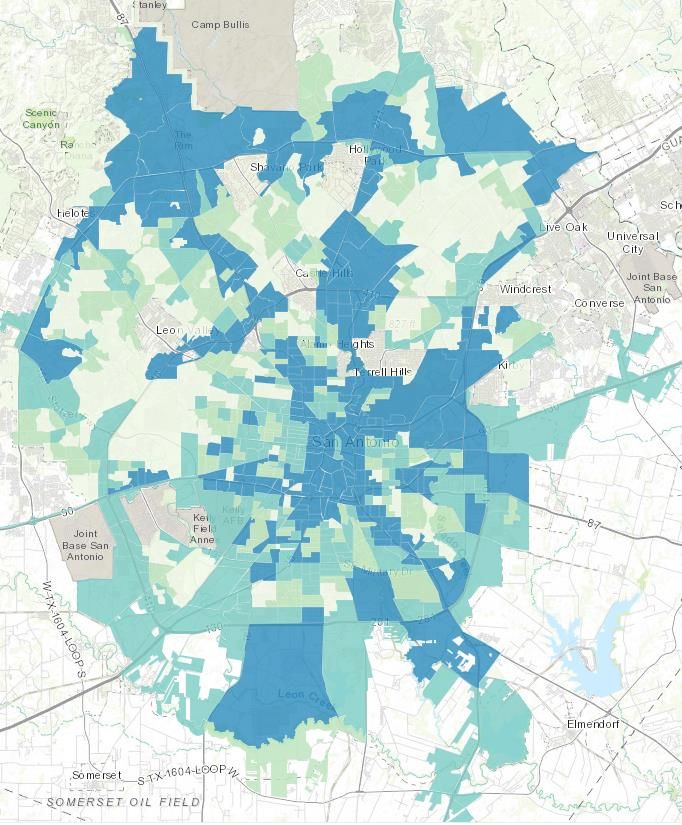
6.3.       Example Utility EV Programs for Underserved Communities ..................................................... 42
   6.4.       Strategy Options for Addressing Equity in CoSA’s EV Program .................................................. 43
APPENDIX A. LIGHT-DUTY ELECTRIC VEHICLES ........................................................................................... 45
APPENDIX B. MEDIUM- AND HEAVY-DUTY ELECTRIC VEHICLES ................................................................. 47
APPENDIX C. EV CHARGING - BLOCKGROUP RANKINGS AND CORRESPONDING ZIP CODES ..................... 49
APPENDIX D. GIS MAPS ............................................................................................................................... 51
   Public Workplace Index........................................................................................................................... 51
   DC Fast Charging Index ........................................................................................................................... 52
   Residential Index ..................................................................................................................................... 53
   San Antonio Zip Codes ............................................................................................................................ 54
   Top Zip Codes in San Antonio for Charging Stations .............................................................................. 55
   Notes on Creation of Indices................................................................................................................... 56
   Public Workplace Index: Methodology ................................................................................................... 56
   DC Fast Charger Index: Methodology ..................................................................................................... 57
   Residential Index: Methodology ............................................................................................................. 58
APPENDIX E. MUNICIPAL FLEET ELECTRIFICATION PLAN............................................................................ 59
APPENDIX F. UTILITY RATES AND ELECTRIC VEHICLES ................................................................................ 63
APPENDIX G. PUBLIC ENGAGEMENT SURVEY (ENGLISH)............................................................................ 65
APPENDIX H. PUBLIC ENGAGEMENT SURVEY (SPANISH) ........................................................................... 77

                                                                                                                                           iii | P a g e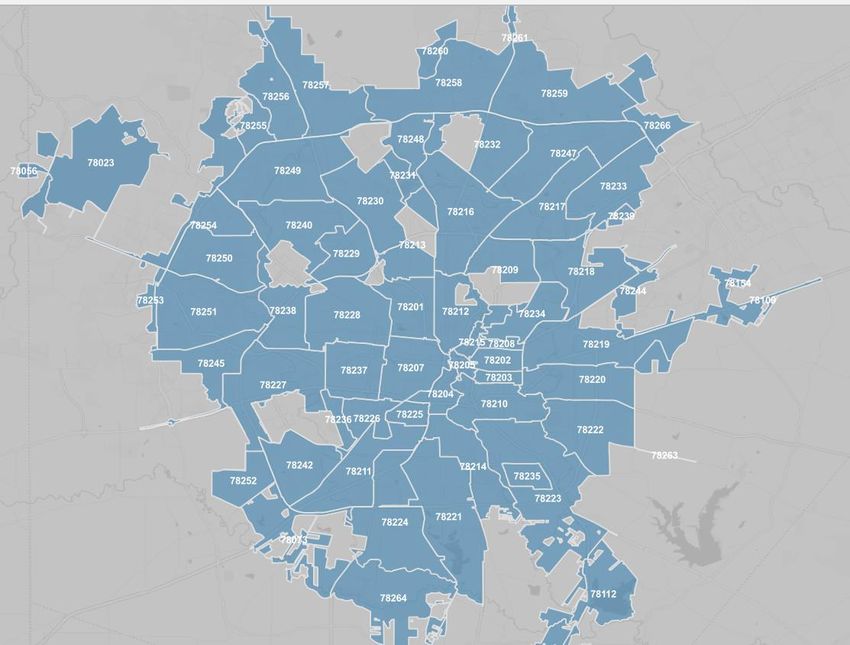
MESSAGE FROM THE MAYOR
San Antonio’s transportation sector is quickly changing.
Ridesharing and carsharing programs connect our communities,
save travelers’ time and money, create new employment
opportunities, and reduce car ownership. Micro-mobility, like
shared electric scooters and bikes, dot our sidewalks and
provide “last mile” solutions to mobility challenges. Yet,
nowhere are changes in the transportation sector more evident
than in the rapidly growing market for electric vehicles (EVs).

We cannot hide the fact the transportation sector has real
challenges. Over the past few years, ground-level ozone in Bexar
County has risen, creating tangible health impacts for all
residents – particularly those in underserved communities.
Greenhouse gases emitted from combustion engines contribute
to climate change and impact our residents’ susceptibility to
flooding and inclement weather. San Antonio must do
everything we can to improve our air and environment.

I am proud of the progress to date for addressing these issues—
San Antonio is one of 25 cities chosen to participate in the
American Cities Climate Challenge to accelerate the mitigation of greenhouse gas emissions by the end
of 2020. Eight actions have been prioritized in the building energy and transportation sectors, two of
which impact EVs. Additionally, the Climate Action and Adaption Plan outlines several actions that will
result in cleaner and more efficient vehicle technologies.

Largescale transportation electrification is needed now! This study provides a blueprint for a smooth,
equitable, and cost-effective transition to greater EV adoption. The path is not easy. We must take the
“long view” and ensure our infrastructure and municipal programs are ready for the transition. We must
build on successes, one at a time. We must harness the collective spirit of all EV stakeholders. It is hard
work, but ultimately, transportation electrification will clean our air, improve our health, reduce traffic
noise, and save us money.

Mayor Ron Nirenberg
This page intentionally left blank

                                     v|Page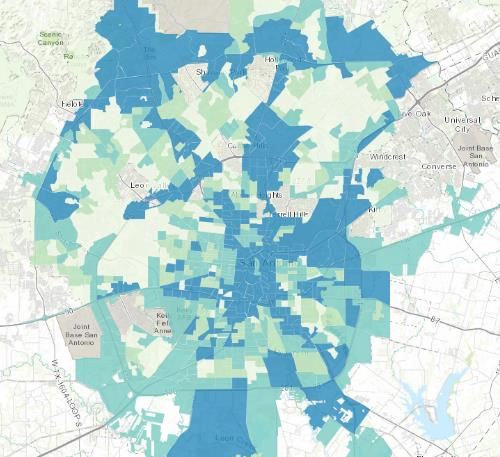
GLOSSARY
ADA – American Disabilities Act

AMD – Automated Mobility Districts. A campus-sized implementation of connected/automated vehicle
technology to realize the full benefits of a fully electric automated mobility service within a confined
region or district.

BEV – Battery electric vehicle is a vehicle powered exclusively by electricity (such as a Nissan LEAF).

CAAP – San Antonio Climate Ready: A Pathway for Climate Action and Adaptation Plan, adopted in
October 2019, is a community-driven plan to guide San Antonio’s efforts to reduce its greenhouse gas
contributions to climate change and prepare for current and future impacts.

CPS Energy – Municipal-owned utility that provides electricity to Bexar County.

DCFC – Direct-current (DC) fast charging equipment, sometimes called DC Level 2 (typically 208/480V AC
three-phase input), enables rapid charging of an EV. More details are below.

DOE – United States Department of Energy.

EV – Electric vehicle is a vehicle powered, at least in part, by electricity. Unless otherwise noted, the
term “EV” refers to all plug-in vehicles in this report and includes BEVs and plug-in hybrid electric
vehicles (PHEVs) defined below. The term “EV” is synonymous with “plug-in electric vehicle” (PEV).

GHG – Greenhouse gas.

ICE vehicle – Internal combustion engine vehicle is a vehicle that combusts fuel, such as gasoline or
diesel, for power.

kW – Kilowatt is a unit of power.

kWh – Kilowatt-hour is a unit of energy.

Level 1 station – AC Level 1 station (often referred to simply as Level 1) provides charging through a
120-volt (120V) AC port.

Level 2 station – AC Level 2 station offers charging through 208V (typical in commercial applications) to
240V (typical in residential applications) electrical service.

LMI households – Low- and moderate-income households are defined by the United States Department
of Housing and Urban Development as at least 80% (low) and 100% (moderate) of the median income of
a region. For example, for a four-person household in the San Antonio–New Braunfels metro area, the
low threshold is $56,800 and the moderate threshold is $71,000 in 2019.1

NOx – Oxides of nitrogen.

1US Department of Housing and Urban Development. 2019. Low and Moderate Income Thresholds.
https://www.huduser.gov/portal/datasets/il/il2019/2019ILCalc3080.odn
PEV – Plug-in electric vehicle is a vehicle powered, at least in part, by electricity. The term “PEV” is
synonymous with the term “EV.” In this document the term EV is used instead of PEV.

PHEV – Plug-in hybrid electric vehicle (such as a Prius Prime) is a vehicle that is powered by electricity or
an internal combustion engine.

Plug – The component of a station that connects with the vehicle and provides electricity. Plug is
sometimes used interchangeably with “connector” or “port.” This study uses the word “port.” See
Figure 1.

PM2.5 – Fine particulate matter.

PM10 – Large particulate matter.

Port – The component of a station that connects with the vehicle and provides electricity. Port is
sometimes used interchangeably with “connector” or “plug.” This study uses the word “port.” See
Figure 1.

SOx – Sulfur oxides.

Station – A stand-alone piece of equipment capable of charging a vehicle. Station is sometimes used
interchangeably with “charger,” “pedestal,” “machine,” “electric vehicle supply equipment (EVSE),” or
“dispenser.” See Figure 1.

Station plaza – A set of one or more stations at a single
location operated by the same EV service provider. See
Figure 1.
                                                                               Charging Station
TCO – Total cost of ownership, comprising vehicle
purchase cost, infrastructure costs, and operations and
maintenance costs, less any residual value recovered at
the time of sale.                                                                                                     Port or
TNC – Transportation Network Companies, such as Uber                                                                   Plug
and Lyft.

TOU rates – Time of use electricity rates that typically
trade higher on-peak rates for lower off-peak rates. They
can be designed for residential customers in general, or
specifically for EV charging.

VOC – Volatile organic compounds.
                                                                                   Station Plaza
Well-to-wheels – A complete vehicle fuel-cycle analysis                     Figure 1. Explanation of station, port,
that includes the emissions associated with fuel mining,                               and station plaza.
transport, and production (well-to-tank), as well as
vehicle operation (tank-to-wheels).

                                                                                                   vii | P a g e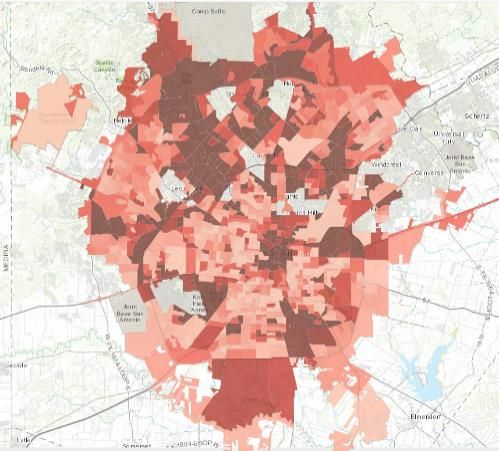
EXECUTIVE SUMMARY
       The Electric Vehicle Fleet Conversion and City-Wide Electric Vehicle Infrastructure Study assesses the
       barriers and opportunities to greater electric vehicle (EV) adoption in San Antonio. EVs include any car
       or truck powered by electricity, including pure battery electric vehicles (BEVs) such as the Nissan LEAF
       and plug-in hybrid electric vehicles (PHEVs) such as the Prius Prime.2 The objectives of this study are to
       promote a common understanding of EVs in San Antonio, provide near-term strategies for accelerating
       EV adoption, describe a plan for the electrification of the municipal fleet, and ensure that the benefits
       and costs of EVs are shared equally across residents of San Antonio. The box below summarizes basic
       facts about San Antonio’s emerging EV market.3

                        Q U I C K FAC T S : SA N AN TON I O E Vs
2,400 EVs in San Antonio                                                                      16 light-duty EV models available
~50% BEVs and ~50% PHEVs                                                                      Many more expected in next 3 years, including electric pickup trucks

1.5 EVs per 1,000 people                                                                      253 public charging ports
Compared to 1.4 in Texas and 3.9 nationally                                                   19 DC fast charging ports and 234 public Level 2 ports

45,000 EVs projected by 2030                                                                  1 charging port per 10 EVs
Based on CPS Energy forecasts                                                                 Compared to 5 to 10 in leading EV cities

       EVs offer San Antonio an array of economic, environmental, public health, and social benefits:

       ❖ Health outcomes
             Internal combustion engine vehicles produce air pollution through tailpipe emissions, which
             adversely affects health outcomes. Populations in disadvantaged communities are particularly
             vulnerable to air pollution stressors and often live closer to roadways than people in other
             communities.4 Transportation electrification is the only technological strategy that entirely
             eliminates tailpipe emissions.
       ❖ Greenhouse gas reductions
             The transportation sector accounts for 38% of greenhouse gas (GHG) emissions in San Antonio, most
             of which are from light-duty vehicles. On a lifecycle basis, EVs are superior to internal combustion

       2 BEVs are powered exclusively by electricity. PHEVs are powered by either electricity or gasoline/diesel.
       3 According to CPS Energy, there were 3,202 EVs in Bexar County in August 2019. San Antonio has approximately 75% of the vehicle population in Bexar County. The
       San Antonio count reflects 75% of 3,202. Texas and U.S. values for EVs per 1,000 people are based on EV populations available in Auto Alliance. 2019. Advanced
       Technology Vehicle Sales Dashboard. https://autoalliance.org/energy-environment/advanced-technology-vehicle-sales-dashboard/
       The 45,000 EVs in 2030 projections are explained below in the EV Charging Needs Assessment section.
       The estimate of 16 EV models available is described in the Barriers to Electric Vehicle Ownership section.
       Values for charging ports include networked and non-networked stations: three DCDC station plazas with 19 ports, 73 networked public Level 2 stations with 164
       ports, and 70 non-networked public Level 2 stations with 70 ports.
       4 Hajat, Anjum, et al. 2015. Socioeconomic Disparities and Air Pollution Exposure: Global Review. https://doi.org/10.1007/s40572-015-0069-5

                                                                                                                                                           1 | Page
engine vehicles in San Antonio. For example, according to the Union of Concerned Scientists’ online
calculator, a Nissan LEAF driven in San Antonio emits an estimated 168 grams of carbon dioxide
equivalent5 (CO2e) per mile, while a similarly sized gasoline vehicle emits 381 grams of CO2e per
mile.6 As renewable electricity generation increases in coming years, the benefits of EVs will further
increase compared to gasoline and diesel vehicles.
❖ Regulatory compliance
San Antonio lies in Bexar County, a marginal non-attainment area for ground-level ozone. High
ozone levels result in negative human health impacts, such as chronic respiratory problems and
even premature death. Ozone forms through complex interactions between nitrogen oxides (NOx)
and volatile organic compounds (VOCs) in the presence of sunlight. Transportation is a major
contributor to NOx emissions, and therefore ozone formation. With zero tailpipe emissions, the EV is
a key enabling technology to solve the ozone problem. Bexar County must demonstrate ozone
attainment or will face stricter regulations that could affect industry activity and expansion.
❖ Benefits to the electricity grid
Widespread transportation electrification increases the utilization rate of the grid, to the extent that
charging can be shifted to off-peak periods. By strategically adding new electric load at the right
times (such as at night when grid use is lowest), EV adoption in San Antonio can support increased
utilization of renewable wind energy.
❖ Economic development
By transitioning its transportation system toward EVs, San Antonio can increase dependence on
locally produced fuels (electricity). San Antonio could benefit from the job growth created through
the installation of an estimated 10,000 new charging ports by 2030, as well as related EV and
charging station services like education and training of EV mechanics (see the EV Charging Needs
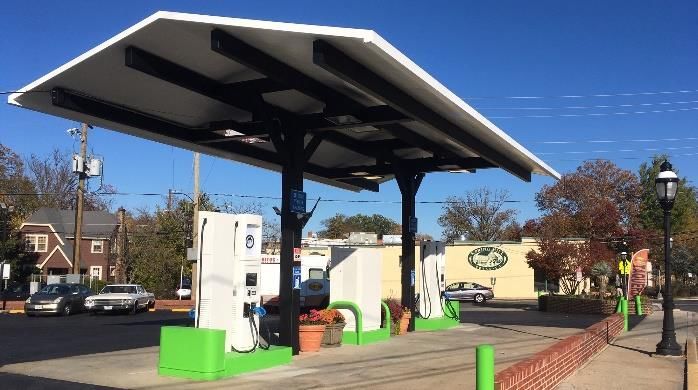
Assessment section). Figure 2 shows construction of a new charging station.7
Figure 2. Installing and maintaining the estimated 10,000 charging ports needed by 2030 will create
new jobs for electricians and construction workers.
Despite the benefits of EVs, several barriers impede greater EV ownership in San Antonio. These are
shown in Figure 3, and include upfront vehicle cost, vehicle availability, consumer awareness,
charger availability, housing stock, and equity.
5 CO2e is a metric that includes the global warming potential of all GHG emissions combined into a single metric: units of CO2.
6 Values are lifecycle emission estimates, which include upstream emissions from electricity and gasoline production, as well as emissions in the fuel supply chain
and at the tailpipe. Source: Union of Concerned Scientists. 2019. How Clean is Your Electric Vehicle? https://www.ucsusa.org/resources/how-clean-your-electric-
vehicle#z/78201/
7 Photo by Leo Jarzomb, SGV Tribune/ SCNG.
2|PageB a r r i e r s t o E V Ow n e r s h i p i n S a n A n t o n i o
Upfront Vehicle Cost Vehicle Availability Consumer Awareness
The average cost of a new EV is As of November 2019, only 16 light- Research strongly suggests that both
$56,000 across all available models duty EV options were available at consumers and dealers lack an
within San Antonio. After removing San Antonio dealerships: nine PHEV understanding and awareness of basic
luxury vehicles and accounting for the models and seven BEV models (see principles of EVs, including incentives,
federal EV tax credit, the average cost Appendix A). charging operations, and model
of non-luxury EV brands in availability.
San Antonio is $27,000.
Charger Availability Housing Stock Equity
Although San Antonio has a similar Within San Antonio, 44% of residents The perception that EV programs only
level of public charge ports to EVs (10 live in a home without access to favor high-income households creates
EVs per charger) as other major overnight charging at a dedicated a lack of support among the general
metropolitan areas, large sections of garage or driveway. population for these programs.
San Antonio have no access to these
faster forms of public charging (i.e.,
DCFCs and Level 2 chargers).
Figure 3. Barriers to EV ownership in San Antonio.
Moving forward, the City of San Antonio can help drive EV adoption by expanding EV readiness
programs, deploying EV infrastructure, and electrifying its municipal fleet. This document provides a
number of specific strategies to help the City succeed in these tasks. As entities in San Antonio work
together with the City to implement strategies, it will be important to conduct pilot tests and evaluate
the impact of these policies as they are implemented to ensure the strategies are having the desired
impact of increasing EV adoption.
Municipal Fleet Electrification
The study begins by exploring common barriers
to EV ownership. Then it presents Chapter 4 of this study describes a plan for converting
recommendations to electrify the City’s the municipal fleet of San Antonio to electric. The
municipal fleet and increase available EV analysis identifies 1,202 vehicles in the fleet that are
charging infrastructure. The study then outlines candidates for electrification. Of these, 26% have a
specific and achievable strategies to increase lower total cost of ownership than the comparable
public EV adoption. Lastly, the study provides gasoline or diesel vehicle. Additionally, the average
San Antonio with plans to increase the equity CO2e and NOx savings on a lifecycle basis are 74% and
of the City’s transportation system and to 76%, respectively.
accommodate emerging mobility options.
3|PageThis page intentionally left blank
4|Page1. INTRODUCTION
The transportation sector is rapidly evolving, with new modes of travel and innovative technologies
disrupting a decades-old status quo. One quickly evolving trend is increased adoption of electric vehicles
(EVs)—in 2018, over 320,000 EVs were sold nationwide, compared to 188,000 in 2017 and 146,000 in
2016. EVs include any vehicle that uses electricity for propulsion, including pure battery electric vehicles
(BEVs) and plug-in hybrid electric vehicles (PHEVs). This study refers to these by their common name:
EVs. This study does not discuss hydrogen fuel cell EVs.
1.1. Context within San Antonio
As with many American cities, San Antonio is built around the automobile. Over 90% of San Antonio full-
time workers commute by car, while over 79% drive alone by car.8 San Antonio’s transportation sector
accounts for 38% of San Antonio’s greenhouse gas (GHG) emissions, as shown in Figure 4.9
Today, San Antonio has approximately 2,400 EVs, Waste, 6%
Industrial
composed mostly of small and mid-sized passenger Process and
cars. Approximately 1% of new vehicle sales in Product Use
2018 were EVs.10 For comparison, leading markets (IPPU), 8%
in the United States, such as San Jose, California,
have new EV sales rates of closer to 10%. Transportation,
Near-term EV growth within San Antonio is almost 38%
certain as more makes and models become Stationary,
available, upfront costs decrease, public charging Energy Use in
infrastructure grows, and the availability of Buildings, 48%
programs and incentives increases. In the longer
term, EV growth remains more uncertain. A 2018
report from Frontier Group forecasts 40,000 EVs
Figure 4. GHG emissions by sector in San Antonio
on the road in San Antonio by 2030.11 CPS Energy
in the 2016 Community GHG Inventory.
estimates approximately 45,000 EVs in San Antonio
in its Medium Scenario by 2030.12 For reference, in 2018 the State of Texas had a stock of 45,020 EVs.13
8 U.S. Census Bureau. 2013-2017 American Community Survey 5-Year Estimates, City of San Antonio, Texas. “Aggregate Number of Vehicles (Car, Truck, Or Van) Used
In Commuting By Workers 16 Years And Over By Sex.”
https://factfinder.census.gov/faces/tableservices/jsf/pages/productview.xhtml?pid=ACS_17_5YR_B08015&prodType=table
9 City of San Antonio. 2019. San Antonio Climate Ready: A Pathway for Climate Action and Adaptation. https://saclimateready.org/wp-
content/uploads/2019/08/SACR-DRAFT-082219_SPREAD_WEB.pdf
10 Values provided in phone conversation with CPS Energy. There were 3,202 EVs in Bexar County in August 2019. San Antonio has approximately 75% of the vehicle
population in Bexar County. The San Antonio count reflects 75% of 3,202, or approximately 2,400.
11 Frontier Group, Environment America, U.S. PIRG, and PennEnvironment Research and Policy Center. 2018. Plugging In: Readying America’s Cities for the Arrival of
Electric Vehicles. https://frontiergroup.org/sites/default/files/reports/US%20Plugging%20In%20Feb18.pdf
12
Values provided in phone conversation with CPS Energy, based on forecasts performed by EPRI. 45,000 EVs by 2030 is the portion of EVs for the City of San
Antonio from CPS Energy’s projection of 60,000 EV’s in Bexar County by 2030.
13 Auto Alliance. 2019. Advanced Technology Vehicle Sales Dashboard. https://autoalliance.org/energy-environment/advanced-technology-vehicle-sales-dashboard/
5 | Page1.2. Municipal Actions
The City of San Antonio has taken several actions to lower transportation emissions. In 2010, with
funding from the State Energy Conservation Office (SECO), the Office of Sustainability converted five of
its fleet Toyota Priuses into plug-in electric vehicles. The grant also supported five dedicated electric
vehicle charging stations which were assigned to different City departments. In the intervening years,
the City has committed to purchasing hybrid electric vehicles for its administrative sedan fleet. As of
September 30, 2019, hybrid sedans accounted for 83% of administrative sedans. The San Antonio
Tomorrow Sustainability Plan, adopted on August 11, 2016, provides a roadmap for enhancing
San Antonio’s quality of life and overall resilience, while balancing the impacts of its expected
1.1 million-person population growth by 2040 with existing resources.14 Additionally, amplifying its
backing of worldwide partnerships to address climate change, San Antonio’s City Council Resolution No.
2017-06-22-0031R, passed on June 22, 2017, supports the Paris Climate Agreement with its own goals to
reduce GHG emissions.15
On October 17, 2019, the City adopted San Antonio Climate Ready: A Pathway for Climate Action and
Adaptation Plan (CAAP), which outlines its strategy to transition to cleaner and more efficient personal
vehicles, trucks, transit, and freight.16 The implementation actions related to EVs in this strategy are to:
• Invest in new EV charging infrastructure throughout the City,
• Develop EV group purchase programs,
• Accelerate the adoption of carbon-free vehicular transportation in all sectors through education
and incentives, and
• Assess the barriers to EV ownership, with a priority focus on equity.17
Additionally, San Antonio was one of 25 cities in the United States selected to participate in the
American Cities Climate Challenge, through which the City committed to pursue infrastructure and
policy improvements to advance electric transportation by the end of 2020. At the time of this report,
the City was exploring business models and partnership opportunities for publicly accessible EV charging
infrastructure on City property. The City’s EV-SA program includes outreach, policy, and infrastructure
initiatives.
1.3. Utility Actions (CPS Energy)
CPS Energy began participating in the EV market in 2011, launching its education program for early EV
adopters. By 2012, the community-owned utility had installed a network of Level 2 public charging
stations at more than 30 locations across San Antonio. Since then, CPS Energy continues to add charging
stations, including in VIA Metropolitan Transit’s newest and largest park and ride facility located in far
north San Antonio.
14 City of San Antonio. 2016. SA Tomorrow: City of San Antonio Sustainability Plan.
https://www.sanantonio.gov/Portals/0/Files/Sustainability/SATomorrowSustainabilityPlan.pdf
15 City of San Antonio. 2017. A Resolution of the City of San Antonio in Support of the Paris Climate Agreement.
https://www.sanantonio.gov/Portals/0/Files/Sustainability/Resolution2017-06-22-0031R.pdf
16 City of San Antonio. 2019. San Antonio Climate Ready: A Pathway for Climate Action and Adaptation. https://saclimateready.org/about-us/climate-action-
adaptation-plan/
17 Ibid.
6|PageIn January 2019, CPS Energy launched a website to help customers navigate the fast growing EV
industry.18 The website provides savings calculators for fuel and carbon reduction, where entering a
current internal combustion vehicle model and an EV model results in a calculation comparing gasoline
costs to electricity for the estimated miles driven. The website also includes a directory of EV models
using data from the U.S. Department of Energy (DOE) with images available from the automobile
manufacturers.
CPS Energy is active in piloting electricity rates that accelerate EV adoption
and create a positive customer experience. A pilot Public Charging Flat Rate
Program is available that allows access to charging stations in the CPS Energy
ChargePoint® network for an annual fee. Powered by CPS Energy and using a
pilot time-of-use (TOU) rate with a demand charge, Electrify America
installed a station plaza featuring six 150 kilowatt (kW) and two 350 kW DC
fast chargers (DCFC) in a Walmart parking lot (Figure 5). CPS Energy plans to
evaluate pilot programs to learn about charging behavior and to create the
right experiences for customers.
1.4. State Actions Figure 5. Electrify
America station powered
At a statewide level, in 2018 the Texas Commission on Environmental Quality by CPS Energy.
(TECQ) published the Volkswagen Environmental Mitigation Trust:
Beneficiary Mitigation Plan for Texas. This plan identifies seven priority areas that “bear a
disproportionate share of air pollution and particularly ozone within Texas,” and allocates specific
funding for emission reductions strategies for each of these areas, including an estimated $61.5 million
for San Antonio.19 The plan also establishes specific actions to increase funding for EVs and charging
infrastructure across the state. The TECQ also administers a limited-time Light-Duty Motor Vehicle
Purchase and Vehicle Lease Incentive Program, where EVs are eligible for a rebate of $2,500 for the first
2,000 applicants.
Figure 6. Examples of City, CPS Energy, and State
planning documents and websites related to EVs.
18CPS Energy. 2019. Electric Vehicles. https://www.cpsenergy.com/en/about-us/programs-services/electric-vehicles.html
19Texas Commission on Environmental Quality, Air Quality Division. 2018. Volkswagen Environmental Mitigation Trust: Beneficiary Mitigation Plan for Texas.
https://www.tceq.texas.gov/assets/public/comm_exec/pubs/rg/rg-537.pdf
7 | PageThis page intentionally left blank
8|Page2. COMMUNITY EV STRATEGIES
This section describes barriers to EV ownership, projections of EVs and EV infrastructure to 2030, a
geospatial analysis of charging locations, and descriptions of best practices on EV permitting, codes,
parking, and signage.
2.1. Barriers to Electric Vehicle Ownership
Several barriers hinder the growth of EVs in San Antonio, including economic, technical, behavioral, and
social. This section draws on academic literature, public data sources, input from the Office of
Sustainability, input from CPS Energy (the municipal utility), and survey data from the CAAP.
2.1.1. Upfront Vehicle Price
Despite lower fuel and maintenance costs, EVs are still more
expensive to purchase than similar gasoline vehicles. In a recent $27,000
public engagement survey, conducted as part of San Antonio’s Average purchase price of an
CAAP,20 914 respondents were asked about barriers that EV in San Antonio after
influenced their vehicle purchases. A majority (52%) said that removing luxury brands and
purchase price was “very important” to whether they would accounting for the federal EV
purchase an EV. Only 5% of respondents said the purchase price tax credit.
was “not important at all.”
The average purchase price of EV models in San Antonio is $61,000, or $56,000 after accounting for
federal EV tax credits.21 This relatively high average price can be misleading, however, because many
currently available EVs are luxury brands, aimed at high-income households. When considering non-
luxury EV models (such as the Chevy Bolt, Nissan LEAF, and Tesla Model 3), the average, after-federal tax
credit price in San Antonio is $27,000—which is much closer to a comparable gasoline vehicle.
Additionally, EV purchase prices are quickly decreasing. Bloomberg New Energy Finance recently
estimated that EV upfront vehicle costs will reach cost parity with gasoline upfront vehicle costs as early
as 2022.22 Appendix A provides a list of the 16 EV models for sale at dealerships and online in
San Antonio as of October 2019.23
2.1.2. Vehicle Availability
Another constraint on EV market growth is a lack of diversity in vehicle size. Nationally, consumers
prefer large vehicles: more than 65% of passenger vehicles sold in 2018 were pickup trucks, vans, and
crossovers or sports utility vehicles (SUVs).24 Yet, of these larger vehicles, only electric crossovers/SUVs
are available in San Antonio, as shown in Table 1.
20 City of San Antonio. 2019. San Antonio Climate Ready: A Pathway for Climate Action and Adaptation. https://saclimateready.org/wp-
content/uploads/2019/08/SACR-DRAFT-082219_SPREAD_WEB.pdf
21 U.S. Department of Energy Office of Energy Efficiency & Renewable Energy. Federal Tax Credits for All-Electric and Plug-in Hybrid Vehicles.
https://www.fueleconomy.gov/feg/taxevb.shtml
Tesla is the only automaker to no longer receive the federal tax credit.
22 Bullard, Nathaniel. 2019. Electric Car Price Tag Shrinks Along with Battery Cost. https://www.bloomberg.com/opinion/articles/2019-04-12/electric-vehicle-
battery-shrinks-and-so-does-the-total-cost
23 Data were collected by the analysts using the website autotrader.com.
24 Auto Alliance. Facts About Auto Sales. https://autoalliance.org/economy/facts-about-auto-sales/
9 | PageThis trend could be changing. Over the next few years, automakers will introduce several new, larger EV
models. For example, Ford, General Motors, and Tesla have all confirmed plans for an electric truck in
the next three to five years.
Vehicle availability presents an even larger Table 1. Availability of EV models in San Antonio by size class.
barrier for medium- and heavy-duty vehicles.
Appendix B lists this market segment’s vehicle Vehicle Class PHEV Models BEV Models
makes and models in the United States at the Subcompact 0 1
Compact 1 3
time of this writing. Many vehicles in this
Mid-sized sedan 4 0
segment are custom-built and only available in Full-sized sedan 0 1
certain regions of the United States. Except for Sports car 1 0
electric buses, no mass market models are Crossover/SUVs 3 2
available in the medium- and heavy-duty Total 9 7
vehicle classes.
2.1.3. Consumer Awareness
Studies clearly demonstrate that awareness of EVs is low among the car-buying public. One study
revealed the results of a survey conducted with 5,654 new car buying households across the country
and estimated that the fraction of a given state’s respondents who reported seeing EVs on the road
ranged from 25% in Delaware to 72% in Oregon.25 Other research shows that, even after driving an EV
for several weeks, drivers may be confused about how the vehicle operates and when it must be
plugged into a power source.26 Awareness barriers can compound one another. For example, staff at
auto dealers often lack training to speak knowledgeably about EVs, thereby reducing the propagation of
knowledge among consumers.
2.1.4. Housing Stock
Another barrier to greater EV ownership in San Antonio is the housing stock. One estimate suggests that
overnight charging at home accounts for an estimated 80% of all charging among the general public.27
Yet, a large fraction of San Antonio homes are ill-equipped for installing a charger. Of the 893,000
housing units in San Antonio (per the American Housing Survey), only 56% are single-family detached
homes that have a driveway or garage.28 The implication is that 44% of potential EV owners in
San Antonio would need to rely on public or workplace charging.
2.1.5. Equity
Government investment to advance EV ownership often confronts opposition because of the perception
that EVs are “only for the rich.” This creates an indirect barrier. Rather than impacting a consumer EV
purchase decision, this barrier tends to stall programming and policies. Without question, early EV
adopters are largely high-income households, and often own more than one vehicle. Additionally, EV
25 Kurani, Ken, Nicolette Caperello, and Jennifer TyreeHageman. 2016. New Car Buyers’ Valuation of Zero-Emission Vehicles: California.
https://ww3.arb.ca.gov/research/apr/past/12-332.pdf
26 Kurani, Ken, and Gil Tal. 2014. Growing PEV markets? University of California, Davis Sustainable Transportation Energy Pathways (STEPS).
27 Idaho National Laboratory. Plugged In: How Americans Charge Their Electric Vehicles.
https://avt.inl.gov/sites/default/files/pdf/arra/PluggedInSummaryReport.pdf
28 U.S. Census Bureau. American Housing Survey. https://www.census.gov/programs-
surveys/ahs/data/interactive/ahstablecreator.html?s_areas=41700&s_year=2017&s_tablename=TABLE0&s_bygroup1=3&s_bygroup2=1&s_filtergroup1=1&s_filter
group2=1
10 | P a g eadopters need a sufficiently high tax liability to take advantage of the federal income tax credit.
Overcoming this perception requires stressing the shared benefits of EVs and that purchase prices of EVs
are rapidly falling.
2.1.6. Charger Availability and Access
Compared to gasoline vehicles, EVs have fewer public charging stations and require greater refueling
times than gasoline vehicles. Results from an early CAPP survey clearly demonstrated that the range per
charge and the lack of public charging stations pose barriers for most people. As described in the EV
Charging Needs Assessment section below, San Antonio has approximately 2,400 EVs, 234 public charge
ports, and an estimated population of 1.99 million people.29 This means the City has approximately
8,000 people or 12.5 EVs per charge port, which aligns with leading cities throughout the United States
(see Figure 7).30
Figure 7. Figure from International Council on Clean Transportation white paper showing EV sales shares and EVs per
public charge port for cities throughout the world.
29U.S Census Bureau. Community Facts. https://factfinder.census.gov/faces/nav/jsf/pages/community_facts.xhtml?src=bkmk
30The International Council on Clean Transportation. 2018. Emerging Best Practices for Electric Vehicle Charging Infrastructure.
https://theicct.org/sites/default/files/publications/EV-charging-best-practices_ICCT-white-paper_04102017_vF.pdf
11 | Page2.2. EV Charging Needs Assessment
This section describes EV infrastructure in San Antonio, identifies high-priority locations for new
charging stations, and provides insights into building, permitting, and zoning to future-proof EV
infrastructure in San Antonio.
2.2.1. Types of Electric Vehicle Chargers
There are three primary types of EV chargers currently available in the United States: Level 1, Level 2,
and DC Fast Charging (DCFC) stations:
• Level 1 chargers are a standard 120V outlet. Though the slowest option, Level 1 chargers offer
the least expensive make-ready costs, since no permits or supplemental equipment are typically
needed beyond an electrical outlet. Due to the slow charge rate, Level 1 chargers are good for
vehicles with long dwell times and relatively low daily mileage. For example, Level 1 chargers are
good for a vehicle that is driven 30 miles or less per day and that is parked at work most of the
work day and at home at night. Level 1 chargers provide 3-5 miles per hour of charge.
• Level 2 chargers require a 208V to 240V electrical circuit (as do dryers) and have a faster charge
speed than Level 1 charger.31 Level 2 chargers require a residential permit and a certified
electrician and comprise the vast majority of public chargers in San Antonio (approximately
98%). Tesla Level 2 chargers have a unique connector that can only be used by Tesla vehicles.
The J1772 connector on all other Level 2 chargers can be used by all PHEVs and BEVs (with an
adaptor for Tesla vehicles). Level 2 chargers provide 10-25 miles per hour of charge.
• DCFCs provide between 50 kW and 350 kW of power and are the most expensive, fastest
chargers available today. However, only BEVs and one PHEV (the Mitsubishi Outlander) are
capable of using DCFCs.32 Additionally, because of limitations
in the battery management systems on the vehicles, 50 kW is
the highest charging power that most vehicles can accept
today (except Tesla vehicles, which can charge up to 250 kW).
The next generation of EVs coming to U.S. markets will charge
at power levels up to 350 kW. Electrify America, a major
provider of DCFC in the United States, now exclusively builds
DCFC stations equipped to charge up to 350 kW. The newest
chargers are backward compatible with the older, slower
charging vehicles. DCFCs come with three different charger
connectors. The Combined Charging System Combo connector
is used by American- and European-made EVs. The CHAdeMO
connector is used by Japanese- and Korean-made EVs. Tesla Figure 8. Dual-port DCFC station.
superchargers are only capable of charging Tesla vehicles.
However, Tesla vehicles are capable of charging at CHAdeMO connectors if using a $450
adapter. DCFCs provide 200 miles per hour of charge.
31 City of Palo Alto. 2019. Submittal Guidelines: Residential Electric Vehicle Supply Equipment – Expedited.
https://www.cityofpaloalto.org/civicax/filebank/documents/37623
32 All other PHEVs are only capable of charging at Level 2 chargers at a maximum of 9 kW.
12 | P a g eTable 2 describes the three types of EV chargers in more detail.
Table 2. Descriptive information about EV charger types.
Level 1 Level 2 DCFC
Home charging, but can be Public, on-the-go charging; sometimes for
Home charging, public,
Primary Use used for workplace and multifamily residents and fleets with high
and workplace charging
public charging daily mileage*
No additional cost unless $1,500 to $7,000 for $50,000 for a 150 kW station with two
Equipment Cost
new plug is needed single or dual port station ports
No additional cost unless $2,000 to 8,000 for single $37,500 for station plaza with four 150 kW
Make-Ready Cost
new plug is needed or dual port station stations, or $9,000 per station
Note: Table cost values are based on detailed modeling and discussions with EV service providers.
* Source: The International Council on Clean Transportation. 2018. Lessons Learned on Early Electric Vehicle Fast-Charging
Deployments. https://www.theicct.org/sites/default/files/publications/ZEV_fast_charging_white_paper_final.pdf
Charger technology is rapidly evolving. DCFCs are becoming faster each year as automakers shift toward
producing EVs that can accept higher charging levels. Level 1 and Level 2 charger prices continue to
decrease and there is considerable innovation around solutions such as smart circuit breakers (Eaton,
and Atom Power) that could revolutionize the charging landscape. For these reasons, cost projections
are highly uncertain and were not attempted in this study.
To maximize station usage, publicly available chargers can be placed in centrally located attractions—
such as near shopping centers, parks, schools, and workplaces—to increase use and charging
accessibility. DCFC stations are useful in locations with relatively short dwell times, such as at groceries
stores and big-box stores, or along corridors at convenience stations. Level 1 and Level 2 charging
stations are useful where vehicles may be parked for longer time periods, such as workplaces,
government offices, airports, and hotels.33
2.2.2. Meeting Future Electric Vehicle Charging Demand
It is key for the City to anticipate the EV population in the coming decade: the answer shapes the
quantity of public and workplace EV chargers needed. Frontier Group projects 40,000 EVs in San Antonio
by 2030,34 while CPS Energy projects 60,000 EVs in Bexar County by 2030 in its medium adoption
scenario.35 In collaboration with the City and CPS Energy, a projection of 45,000 EVs is used in this report
as a medium adoption scenario for San Antonio for 2030.36
Table 3 shows vehicle sales and vehicle stock numbers needed to reach 45,000 EVs by 2030. The table
values were estimated using a simple stock turnover model that assumes all vehicles are retired after
10 years and that the vehicle population in San Antonio is a constant 1.66 million.37
33 U.S. Department of Energy Alternative Fuels Data Center. Charging Plug-In Electric Vehicles in Public.
https://afdc.energy.gov/fuels/electricity_charging_public.html
34 Frontier Group, Environment America, U.S. PIRG, and PennEnvironment Research and Policy Center. 2018. Plugging In: Readying America’s Cities for the Arrival of
Electric Vehicles. https://frontiergroup.org/sites/default/files/reports/US%20Plugging%20In%20Feb18.pdf
35 Value provided by CPS Energy via a telephone conversation with the analysts of this report.
36 This value is based on an estimate of 60,000 EVs in Bexar County by 2030 and the fact San Antonio has approximately 75% of the vehicles in Bexar County.
37 Estimate analyzing San Antonio Metro Area using U.S. Department of Energy Alternative Fuels Data Center. 2019. Electric Vehicle Infrastructure Projection Tool
(EVI-Pro) Lite. https://afdc.energy.gov/evi-pro-lite
13 | PageTable 3. Projections of EV sales in San Antonio to reach 45,000 EVs on the on road in 2030.
New EV Sales Total Stock of EVs
Year EV Sales Share of New EV Share of Vehicle Cumulative EV
Annual EV Sales
Vehicles Population Population
2019 0.8% 1,300 0.25% 2,400
2025 2% 3,500 0.8% 16,500
2030 6% 10,000 2% 45,000
The projections in Table 3 are only a starting point and should be updated and refined. To estimate the
number of chargers needed over the next decade, the analysts used the EVI-Pro Lite Tool, developed by
National Renewable Energy Laboratory. This tool uses manual location-specific inputs on home charging,
vehicle mix, and electrified miles in PHEVs and estimates the number of DCFC, public Level 2, and
workplace Level 2 plugs needed to support a given vehicle population.38
When using this tool, the analysts used the following input assumptions:
• Home charging. Over half (56%) the population has access to home charging. This value was
discussed in more detail in the Barriers to Electric Vehicle Ownership section above.
• Vehicle mix. PHEVs with a 20-mile range account for approximately 45% of EVs in San Antonio,
while PHEVs with a 50-mile range account for 7% of EVs, BEVs with a 100-mile range or less
account for 14% of EVs, and longer-range BEVs account for 34% of EVs.39
• Electric miles in PHEVs. Analysts selected the “partial support” option, which assumes that PHEV
are driven using a mix of gasoline and electricity.
Table 4 gives the number and type of stations that currently exist. Note the EVI-Pro Lite Tool assumes
one port per station. Many Level 2 and DCFC stations have multiple ports per station, but typically only
one can operate at a time at the rated power level.
Table 4. Estimated number of stations needed to support 16,500 EVs by 2025 and 45,000 EVs by 2030.
Number of Ports in 2019 New Ports Needed by 2025* New Ports Needed by 2030*
Public Level 2 ports 234 1,069 2,687
DCFC ports 19 1,284 2,902
Workplace Level 2 ports Unknown 1,672 4,422
Total Unknown 4,025 10,011
* New ports are the incremental number needed in addition to 2019 numbers.
One insight from Table 4 is that workplace Level 2 ports are the largest share of new ports needed.
Municipal programs that mobilize individual workplaces to install EV charging have been effective in
other jurisdictions and are especially critical for small workplaces with limited resources. Workplace
charging is also attractive for San Antonio because the time of charging (during the workday) matches
peak solar generation.
Another insight from Table 4 is that San Antonio needs to vastly expand its DCFC network. The DOE
recommends prioritizing DCFC networks before Level 2 networks because of DCFCs important role in
alleviating range anxiety among the car-buying public.
38 U.S. Department of Energy Alternative Fuels Data Center. 2019. Electric Vehicle Infrastructure Projection Tool (EVI-Pro) Lite. https://afdc.energy.gov/evi-pro-lite
39 Values based on data provided by CPS Energy.
14 | P a g e2.2.3. Geospatial EV Charger Analysis for San Antonio
A geospatial EV charging analysis is a quantitative method for identifying and prioritizing locations for
future EV charging infrastructure based on a set of pre-defined attributes. A well-planned charging
network in San Antonio ensures cost-effective and equitable use of public money and strengthens buy-
in from various stakeholder groups. The geospatial analysis focused on three EV charging use cases:
1. Public and Workplace: Level 2 chargers shared between drivers in public locations or employee
parking lots.
2. DCFCs: Public DCFCs shared by drivers in public locations near major intersections or major
retail centers.
3. Residential: Level 2 chargers in multi-unit dwellings for drivers without a garage or driveway for
overnight charging.
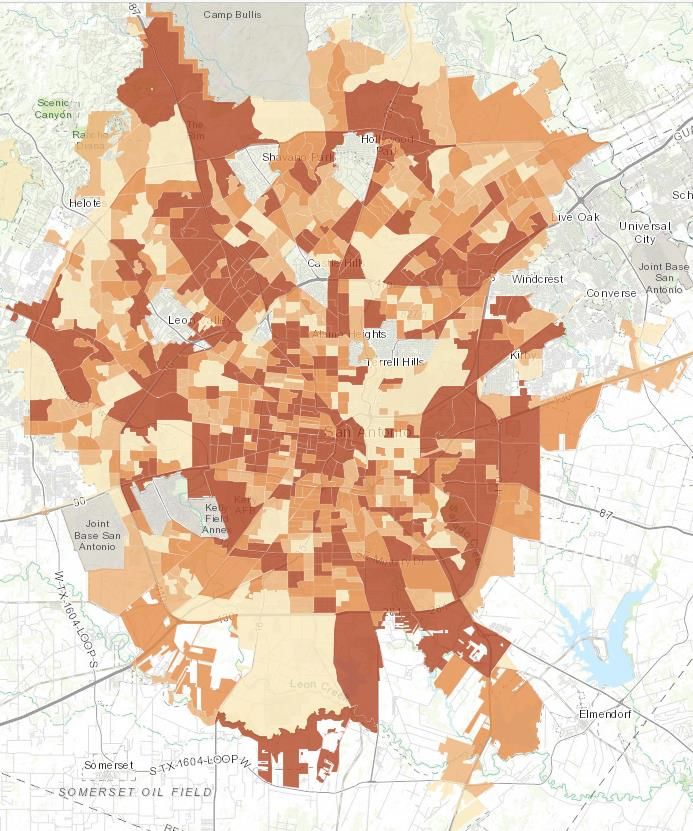
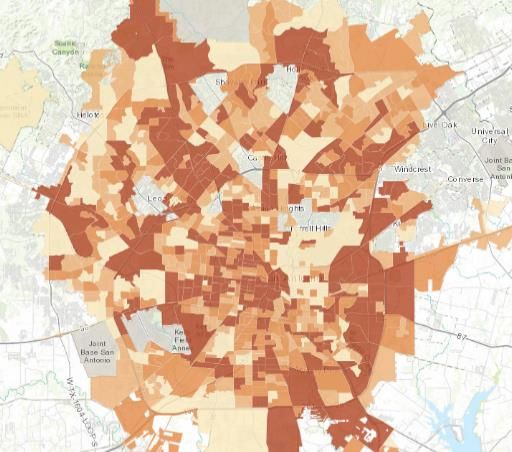
Figure 9. Geospatial analysis of charging prioritization for San Antonio, comparing three use cases. Darker regions are
more attractive locations for new charging infrastructure.
Public and Workplace Charging Index DCFC Index Residential Charging Index
The three indices shown Figure 9 are composite scores based on multiple indicators that were
normalized on a scale of 0 to 1 then summed based on weights. The set of indicators and weights were
determined in coordination with the City of San Antonio. Each indicator, the rationale for including it,
and its weight are given in Table 5. In the maps above, the scores are portrayed in four shade gradients
(used to allow for easier viewing): lighter shades are lower scoring block groups and darker shades are
higher scoring block groups. Larger versions of each map and a list of the 25 highest scoring block groups
are given in Appendix C and Appendix D.
Based on geospatial analysis conducted in ArcGIS, certain block groups emerged as highest priorities for
each index for installing an EV charge port.
• The Public and Workplace Index shows that the top three block groups of highest priority are (in
order, starting with the highest) 480291101001 (zip code 78205), 480291814021 (zip code
78229), and 480291918171 (zip code 78258), as symbolized by the darker brown locations in the
left-most map in Figure 9.
• The DCFC Index shows that the top three block groups of highest priority are (in order, starting
with the highest) 480291101001 (zip code 78205), 480291101003 (zip code 78207), and
15 | Page480291909011 (zip code 78216), as symbolized by the darker blue locations in the middle map
in Figure 9.
• The Residential Index shows that the top three block groups of highest priority are (in order,
starting with the highest) 480291810033 (zip code 78229), 480291814031 (zip code 78229), and
480291810042 (zip code 78229), as symbolized by the darker red locations in Figure 9.
Table 5. Indices and justifications to determine San Antonio charging infrastructure needs.
Factor Weight Rationale for Inclusion of Factor
Public and Workplace Index
Assuming that areas with larger numbers of jobs attract more people and that people
Number of jobs 30% will charge while at work or near their work when running errands or engaged in
activities near their workplaces
Number of longer Assuming that people will charge their cars when engaged in activities at these longer
40%
dwell time sites dwell time sites
New charging infrastructure is needed in areas where it is currently lacking, assuming
Number of existing
30% that the City is trying to address a coverage issue with charging infrastructure rather
charge ports
than a capacity issue
DCFC Index
Number of short-
Assuming that DCFC users will likely charge at places with shorter average dwell
and medium- dwell 40%
times, such as grocery stores and gas stations
time sites
Number of existing
20% New DCFC infrastructure is needed in places where it currently does not exist
DCFC ports
Assuming that high average annual daily traffic values provide a good indicator of
Traffic counts (max)
40% where people are driving and that it would be convenient for drivers to exit the
at highway exits
highway to charge
Residential Index
Assuming that those living in multifamily buildings will have less access to at-home
Share of multifamily charging (garage orphans) and that there is a higher likelihood of having any (or
50%
buildings more) EV owners in larger apartment buildings than in a three-family multifamily
building
Assuming that those who rent are less likely to have at-home charging access and will
Share of renters 12.5%
need to use public charging infrastructure
Share of car Assuming that areas with a higher number of drivers will be more likely to use
12.5%
commuters charging infrastructure
Using the finding from the Center for Sustainable Energy CA EV owner survey that
Median income 25% 47% of EV owners have a household income over $150,000 and 20% of EV owners
have an income between $100,000 and $149,999
2.3. Permitting, Codes, Parking Requirements, and Signage
2.3.1. Streamline Permitting Process
Streamlined permitting for residential charger installation is a revenue-neutral approach to encouraging
EV adoption. The City of San Antonio is already effective at streamlining its permitting process and
follows best practices regarding residential permits, including rapid processing and relatively low fees.
For an existing residence in San Antonio, a licensed electrician can obtain an electrical permit online or
in person the same day as the application. 40 The cost of obtaining the permit is based on the scope of
40 City of San Antonio. 2018. Electrical Permit Application. https://docsonline.sanantonio.gov/FileUploads/DSD/DSD_Electrical_Application.pdf
16 | P a g ework performed. If a port is being installed, the permit cost is $51.50. If a new panel must be installed
along with the port, the permit cost is $59.60. These costs compare favorably with jurisdictions (Table 6
shows a sample of cities and state residential Level 2 permitting fees).
Table 6. Example of residential Level 2 charger permit fees.
Jurisdiction Average Residential Permit Fee Available Online?
Palo Alto* $172.00 to $270.00 Y
Arizona** $96.11 Y
Oregon** $40.98 Y
Tennessee** $41.15 Y
Washington** $78.27 Y
San Antonio*** $51.50 to 59.60 Y
* Source: City of Palo Alto. 2019. Adopted Municipal Fee Schedule.
https://www.cityofpaloalto.org/civicax/filebank/documents/66147
** Source: New York State Energy Research and Development Authority. 2013. Residential EVSE
Permit Process Best Practices. https://www.nyserda.ny.gov/-
/media/Files/Programs/ChargeNY/Permit-Process-Streamlining.pdf
*** Source: City of San Antonio. 2018. Electrical Permit Application.
https://docsonline.sanantonio.gov/FileUploads/DSD/DSD_Electrical_Application.pdf
For commercial permits, a port could be installed with a trade permit in the exact same manner as in
residential construction, and the permit would be issued immediately. If the work includes an upgraded
service, engineering drawings are required. These permits are typically processed the same day as the
application but not longer than three days after the application. CPS Energy review is required for any
projects that increase connected load by 25 kW or more.
2.3.2. Pre-Wiring Parking
The City of San Antonio can encourage EV ownership by ensuring that new construction is ready for
Level 2 chargers. The most common EV-readiness building codes include pre-wiring electricity outlets
near parking spots with Level 2 charger voltage (208V or 240V). Even if EV chargers are not installed
during initial construction of parking facilities, pre-wiring decreases future costs when EV chargers are
installed. Other jurisdictions in the United States with charge-ready building codes tend to require that
between 5% and 25% of parking spots are wired for Level 2 charging.
2.3.3. EV-Ready Codes
Through the American Cities Climate Challenge, the City is considering developing “EV Ready”
construction requirements for new residential and commercial buildings, as well as for certain retrofits
or rehabilitations. As it creates these new requirements, the City will balance the goal of expanding
access to EV charging with the need to maintain equity and housing affordability.
The City of San Antonio has adopted the 2018 International Energy Conservation Code (IECC). The State
of Texas follows the 2015 IECC. The IECC is a set of model building code regulations, enacted by the
International Code Council, to establish minimum design and construction requirements to achieve
energy efficiency. Many states and municipal governments adopt the IECC, which is updated every three
years. The IECC contains separate guidelines for commercial buildings and for low-rise residential
buildings (those with no more than three stories).41 The next version of the IECC will be issued in 2021.
41International Code Council. 2019. Overview of the International Energy Conservation Code. https://www.iccsafe.org/products-and-services/i-codes/2018-i-
codes/iecc/
17 | PageYou can also read