AES 2014 Sustainability Report - AES Corporation
←
→
Page content transcription
If your browser does not render page correctly, please read the page content below

AES 2014 Sustainability Report
AES 2014 Sustainability Report

TABLE OF CONTENTS
Statement from the President and CEO .  .  .  .  .  .  .  .  .  .  .  .  .  .  .  .  .  .  .  .  .  .  .  .  .  .  .  .  .  .  .  .  .  .  .  .  .  .  .  .  .  .  .  .  .  .  .  .  .  .  .  .  .  .  .  .  .  . 3
Organizational Profile .  .  .  .  .  .  .  .  .  .  .  .  .  .  .  .  .  .  .  .  .  .  .  .  .  .  .  .  .  .  .  .  .  .  .  .  .  .  .  .  .  .  .  .  .  .  .  .  .  .  .  .  .  .  .  .  .  .  .  .  .  .  .  .  .  .  .  .  .  .  .  .  . 6
Report Highlights .  .  .  .  .  .  .  .  .  .  .  .  .  .  .  .  .  .  .  .  .  .  .  .  .  .  .  .  .  .  .  .  .  .  .  .  .  .  .  .  .  .  .  .  .  .  .  .  .  .  .  .  .  .  .  .  .  .  .  .  .  .  .  .  .  .  .  .  .  .  .  .  .  .  .  .  . 8

                                                                                                                                                                                                                                                                          TABLE OF CONTENTS
Financial Excellence .  .  .  .  .  .  .  .  .  .  .  .  .  .  .  .  .  .  .  .  .  .  .  .  .  .  .  .  .  .  .  .  .  .  .  .  .  .  .  .  .  .  .  .  .  .  .  .  .  .  .  .  .  .  .  .  .  .  .  .  .  .  .  .  .  .  .  .  .  .  .  .  .  .  .  . 9
           Aspect: Economic Performance and Investment Return on Capital Allocation  .  .  .  .  .  .  .  .  .  .  .  .  .  . 10
Operational Excellence .  .  .  .  .  .  .  .  .  .  .  .  .  .  .  .  .  .  .  .  .  .  .  .  .  .  .  .  .  .  .  .  .  .  .  .  .  .  .  .  .  .  .  .  .  .  .  .  .  .  .  .  .  .  .  .  .  .  .  .  .  .  .  .  .  .  .  .  .  .  .  . 12
           Aspect: Availability, Reliability and Access to Electricity .  .  .  .  .  .  .  .  .  .  .  .  .  .  .  .  .  .  .  .  .  .  .  .  .  .  .  .  .  .  .  .  .  . 12
           		Generation .  .  .  .  .  .  .  .  .  .  .  .  .  .  .  .  .  .  .  .  .  .  .  .  .  .  .  .  .  .  .  .  .  .  .  .  .  .  .  .  .  .  .  .  .  .  .  .  .  .  .  .  .  .  .  .  .  .  .  .  .  .  .  .  .  .  . 12
           		Distribution  .  .  .  .  .  .  .  .  .  .  .  .  .  .  .  .  .  .  .  .  .  .  .  .  .  .  .  .  .  .  .  .  .  .  .  .  .  .  .  .  .  .  .  .  .  .  .  .  .  .  .  .  .  .  .  .  .  .  .  .  .  .  .  .  .  . 16
                           Customer Satisfaction .  .  .  .  .  .  .  .  .  .  .  .  .  .  .  .  .  .  .  .  .  .  .  .  .  .  .  .  .  .  .  .  .  .  .  .  .  .  .  .  .  .  .  .  .  .  .  .  .  .  .  .  .  .  .  .  . 19
           Aspect: Cybersecurity .  .  .  .  .  .  .  .  .  .  .  .  .  .  .  .  .  .  .  .  .  .  .  .  .  .  .  .  .  .  .  .  .  .  .  .  .  .  .  .  .  .  .  .  .  .  .  .  .  .  .  .  .  .  .  .  .  .  .  .  .  .  . 20
           Aspect: Disaster/Emergency Planning and Response .  .  .  .  .  .  .  .  .  .  .  .  .  .  .  .  .  .  .  .  .  .  .  .  .  .  .  .  .  .  .  .  .  .  .  . 22
Environmental Performance .  .  .  .  .  .  .  .  .  .  .  .  .  .  .  .  .  .  .  .  .  .  .  .  .  .  .  .  .  .  .  .  .  .  .  .  .  .  .  .  .  .  .  .  .  .  .  .  .  .  .  .  .  .  .  .  .  .  .  .  .  .  .  .  .  . 25
           Aspect: Air Emissions  .  .  .  .  .  .  .  .  .  .  .  .  .  .  .  .  .  .  .  .  .  .  .  .  .  .  .  .  .  .  .  .  .  .  .  .  .  .  .  .  .  .  .  .  .  .  .  .  .  .  .  .  .  .  .  .  .  .  .  .  .  .  . 28
                           Direct Greenhouse Gas Emissions, Scope 1  .  .  .  .  .  .  .  .  .  .  .  .  .  .  .  .  .  .  .  .  .  .  .  .  .  .  .  .  .  .  .  .  .  .  .  .  .  . 29
                           Indirect GHG Emissions, Scope 2 And Scope 3 .  .  .  .  .  .  .  .  .  .  .  .  .  .  .  .  .  .  .  .  .  .  .  .  .  .  .  .  .  .  .  .  .  .  .  . 31
                           NOx, SO2 and Other Air Emissions .  .  .  .  .  .  .  .  .  .  .  .  .  .  .  .  .  .  .  .  .  .  .  .  .  .  .  .  .  .  .  .  .  .  .  .  .  .  .  .  .  .  .  .  . 32
                           Reduction of Greenhouse Gas (GHG) and Other Air Emissions —  .  .  .  .  .  .  .  .  .  .  .  .  .  .  .  .  .  . 32
                           Energy Efficiency for Our Customers
           Aspect: Water .  .  .  .  .  .  .  .  .  .  .  .  .  .  .  .  .  .  .  .  .  .  .  .  .  .  .  .  .  .  .  .  .  .  .  .  .  .  .  .  .  .  .  .  .  .  .  .  .  .  .  .  .  .  .  .  .  .  .  .  .  .  .  .  .  .  .  .  .  . 34
                           Water Withdrawal and Discharge  .  .  .  .  .  .  .  .  .  .  .  .  .  .  .  .  .  .  .  .  .  .  .  .  .  .  .  .  .  .  .  .  .  .  .  .  .  .  .  .  .  .  .  .  .  . 35
           Aspect: Effluents and Byproducts  .  .  .  .  .  .  .  .  .  .  .  .  .  .  .  .  .  .  .  .  .  .  .  .  .  .  .  .  .  .  .  .  .  .  .  .  .  .  .  .  .  .  .  .  .  .  .  .  .  .  .  . 37
                           Coal Combustion Products (CCPs) Generation, Reuse and Recycle .  .  .  .  .  .  .  .  .  .  .  .  .  .  .  .  . 37
                           Environmental Cost Savings and Revenue Generation  .  .  .  .  .  .  .  .  .  .  .  .  .  .  .  .  .  .  .  .  .  .  .  .  .  .  .  . 38
           		Spills .  .  .  .  .  .  .  .  .  .  .  .  .  .  .  .  .  .  .  .  .  .  .  .  .  .  .  .  .  .  .  .  .  .  .  .  .  .  .  .  .  .  .  .  .  .  .  .  .  .  .  .  .  .  .  .  .  .  .  .  .  .  .  .  .  .  .  .  .  .  .  . 39
           Aspect: Biodiversity .  .  .  .  .  .  .  .  .  .  .  .  .  .  .  .  .  .  .  .  .  .  .  .  .  .  .  .  .  .  .  .  .  .  .  .  .  .  .  .  .  .  .  .  .  .  .  .  .  .  .  .  .  .  .  .  .  .  .  .  .  .  .  .  . 39
                           Restoring Habitats and Protecting Wildlife .  .  .  .  .  .  .  .  .  .  .  .  .  .  .  .  .  .  .  .  .  .  .  .  .  .  .  .  .  .  .  .  .  .  .  .  .  .  . 41
Stakeholder Engagement .  .  .  .  .  .  .  .  .  .  .  .  .  .  .  .  .  .  .  .  .  .  .  .  .  .  .  .  .  .  .  .  .  .  .  .  .  .  .  .  .  .  .  .  .  .  .  .  .  .  .  .  .  .  .  .  .  .  .  .  .  .  .  .  .  .  .  .  . 42
           Stakeholders  .  .  .  .  .  .  .  .  .  .  .  .  .  .  .  .  .  .  .  .  .  .  .  .  .  .  .  .  .  .  .  .  .  .  .  .  .  .  .  .  .  .  .  .  .  .  .  .  .  .  .  .  .  .  .  .  .  .  .  .  .  .  .  .  .  .  .  .  .  . 42
           Aspect: Impacts On Education and Living Standards in Our Communities .  .  .  .  .  .  .  .  .  .  .  .  .  .  .  .  . 47
           Aspect: Public Safety  .  .  .  .  .  .  .  .  .  .  .  .  .  .  .  .  .  .  .  .  .  .  .  .  .  .  .  .  .  .  .  .  .  .  .  .  .  .  .  .  .  .  .  .  .  .  .  .  .  .  .  .  .  .  .  .  .  .  .  .  .  .  .  . 51
Our People .  .  .  .  .  .  .  .  .  .  .  .  .  .  .  .  .  .  .  .  .  .  .  .  .  .  .  .  .  .  .  .  .  .  .  .  .  .  .  .  .  .  .  .  .  .  .  .  .  .  .  .  .  .  .  .  .  .  .  .  .  .  .  .  .  .  .  .  .  .  .  .  .  .  .  .  .  .  .  .  .  . 53
           Aspect: Global Talent Management .  .  .  .  .  .  .  .  .  .  .  .  .  .  .  .  .  .  .  .  .  .  .  .  .  .  .  .  .  .  .  .  .  .  .  .  .  .  .  .  .  .  .  .  .  .  .  .  .  .  . 55
                           ACE Academy for Talent Development .  .  .  .  .  .  .  .  .  .  .  .  .  .  .  .  .  .  .  .  .  .  .  .  .  .  .  .  .  .  .  .  .  .  .  .  .  .  .  .  .  . 56
                           Assessments and Career Planning .  .  .  .  .  .  .  .  .  .  .  .  .  .  .  .  .  .  .  .  .  .  .  .  .  .  .  .  .  .  .  .  .  .  .  .  .  .  .  .  .  .  .  .  .  . 57
                           Experience and Exposure .  .  .  .  .  .  .  .  .  .  .  .  .  .  .  .  .  .  .  .  .  .  .  .  .  .  .  .  .  .  .  .  .  .  .  .  .  .  .  .  .  .  .  .  .  .  .  .  .  .  .  .  .  . 57
                           Continuing to Strengthen Our Culture .  .  .  .  .  .  .  .  .  .  .  .  .  .  .  .  .  .  .  .  .  .  .  .  .  .  .  .  .  .  .  .  .  .  .  .  .  .  .  .  .  . 57
                           Rewarding Our People .  .  .  .  .  .  .  .  .  .  .  .  .  .  .  .  .  .  .  .  .  .  .  .  .  .  .  .  .  .  .  .  .  .  .  .  .  .  .  .  .  .  .  .  .  .  .  .  .  .  .  .  .  .  .  . 58
                           AES Performance Excellence .  .  .  .  .  .  .  .  .  .  .  .  .  .  .  .  .  .  .  .  .  .  .  .  .  .  .  .  .  .  .  .  .  .  .  .  .  .  .  .  .  .  .  .  .  .  .  .  .  .  . 60
           Aspect: Occupational Health and Safety .  .  .  .  .  .  .  .  .  .  .  .  .  .  .  .  .  .  .  .  .  .  .  .  .  .  .  .  .  .  .  .  .  .  .  .  .  .  .  .  .  .  .  .  .  .  . 61
                           Health and Safety Management  .  .  .  .  .  .  .  .  .  .  .  .  .  .  .  .  .  .  .  .  .  .  .  .  .  .  .  .  .  .  .  .  .  .  .  .  .  .  .  .  .  .  .  .  .  .  . 62
                           Health and Safety Performance .  .  .  .  .  .  .  .  .  .  .  .  .  .  .  .  .  .  .  .  .  .  .  .  .  .  .  .  .  .  .  .  .  .  .  .  .  .  .  .  .  .  .  .  .  .  .  . 65
                           Health and Safety Recognition .  .  .  .  .  .  .  .  .  .  .  .  .  .  .  .  .  .  .  .  .  .  .  .  .  .  .  .  .  .  .  .  .  .  .  .  .  .  .  .  .  .  .  .  .  .  .  .  . 69
Index Of Figures and Tables .  .  .  .  .  .  .  .  .  .  .  .  .  .  .  .  .  .  .  .  .  .  .  .  .  .  .  .  .  .  .  .  .  .  .  .  .  .  .  .  .  .  .  .  .  .  .  .  .  .  .  .  .  .  .  .  .  .  .  .  .  .  .  .  .  .  . 73
AES 2014 Sustainability Report

                                           STATEMENT FROM THE
                                           PRESIDENT AND CEO

                                                                                                                                               STATEMENT FRON THE PRESIDENT AND CEO
                                        To Our Stakeholders,

                                        Our mission is to improve lives by providing safe, reliable and sustainable
                                        energy to the millions of customers that we serve.

Our power plants use a broad range of technologies and fuel types, including fossil fuels and renewables. Our
utilities serve diverse markets such as São Paulo, Brazil, or Indianapolis, Indiana. In all of our markets, our
actions are guided by the goal of building a sustainable future while meeting today’s need for safe and reliable
energy.

Executing a Strategy to Transform AES

In late 2011, we set a strategy to position the company for the future:

                           L everaging our platforms: focus our growth on platform expansions,
                            including adjacencies, in markets where we already operate and have a
                            competitive advantage to realize attractive risk-adjusted returns.

                           Performance excellence: be the low-cost manager of a portfolio of
                           international energy assets and to derive synergies and scale from our
                           businesses.

                           Expanding access to capital: raise capital by building strategic and
                           financial partnerships at the project and business level. Through these
                           partnerships, we aim to optimize our risk-adjusted returns in our existing
                           businesses and growth projects.

                           Reducing complexity: exit businesses and markets where we do not
                           have a competitive advantage, to simplify our portfolio and reduce risk.

Since then, we have consistently executed on these long-term strategic objectives, and I am pleased to share in this
report some of our achivements for 2014. Going forward, the foundation we have built will allow us to continue
to capitalize on the opportunities we see across our portfolio and create value for our shareholders.

                                                           3                                                       back to table of contents
AES 2014 Sustainability Report

Achieving Our Objectives

In 2014 we made a lot of progress towards our long-term strategic objectives even while facing a second
year of drought along the Eastern Pacific Rim from California to Chile, which affected the results of some
of our businesses.

                                                                                                                                          STATEMENT FRON THE PRESIDENT AND CEO
The weakening of commodities and foreign currencies and negative investor sentiment towards exposure to
countries outside the United States also contributed to the underperformance of our stock price, which does not
reflect the continued strong execution of our strategy.

Nonetheless, we feel proud of our accomplishments: it was our safest year on record with no AES people
fatalities. We did, unfortunately, have one contractor fatality and a number of serious incidents. While we must
recognize the progress we have made through our continued focus on safety, we have not reached our goal of an
incident-free workplace, and we won’t be satisfied until we achieve this objective.

                                    It was our safest year on record
                                      with no AES people fatalities

To grow our platforms, we started construction of new projects in Indiana, India and Chile. With these new
projects, we have the largest number of megawatts (MW) under construction or being environmentally
upgraded in our 34-year history. To finance our growth, we entered into a record number of financial
partnerships at the business and project level for a total of US $1.9 billion.

We are also developing adjacent business lines, such as supplying natural gas to our platform markets. Almost
11 years ago, AES Dominicana expanded its Andres facility in Boca Chica (Dominican Republic, MCAC SBU) to
include a port and the country’s only storage tank for liquefied natural gas (LNG). In 2014 AES Dominicana
achieved a milestone by receiving its 100th natural gas tanker, which brought the total cumulative amount
of LNG received to 12 million cubic meters. This is a good example of how we are leveraging our platforms
while making a lasting difference in our communities. Since the opening of the LNG terminal, the country has
saved approximately US $1.8 billion by using natural gas, compared to the cost of generating electricity from
petroleum fuels.

In late 2014, we won the largest bid in our history for 1,284 MW of replacement thermal generation and
100 MW of energy storage in Southern California. This was the first time battery storage competed and won
against other peaking and flexible power capacity alternatives in a competitive bid process. As technology
improvements shape the global electric sector, AES is positioned to maintain its leadership position. With eight
years of successful experience in energy storage, AES has become the world leader in battery-based energy
storage with more than 114 MW of resources in operation or construction.

As a part of our goal to reduce complexity, we also completed our exit from Turkey, Cameroon and Nigeria. I feel
very proud of the operational and safety improvements we were able to accomplish in Africa, which are second
to none.

                                                        4                                                     back to table of contents
AES 2014 Sustainability Report

Finally, we made significant strides in our capital allocation priorities. Due to our expected strong and growing
cash flow, we announced a 100% increase in our dividend to shareholders to US $0.10 per share beginning in
2015. We also continued to repurchase our shares at attractive prices and reduce leverage to strengthen our
balance sheet.

                                                                                                                                             STATEMENT FRON THE PRESIDENT AND CEO
Building a Sustainable Future

For AES people, how we accomplish our successes and deliver electricity is as important as the services we
provide. Ethics, integrity and compliance are the foundation and principles that guide our company and our
people. In 2014, AES was recognized as one of the World’s Most Ethical Companies by the Ethisphere Institute
for going beyond making statements about doing business ethically and turning words into action.

                 AES was named to the Dow Jones Sustainability Index (DJSI)
                          for North America for the first time ever

We also made very good progress on our other two long-term corporate objectives set in late 2011: becoming
a top quartile place to work at each of our businesses and reaching the top quartile in sustainability. AES was
named to the Dow Jones Sustainability Index (DJSI) for North America for the first time ever and was ranked in
the top quartile for sustainability among all electric utilities assessed by RobecoSAM.

Many of our companies achieved top quartile place to work rankings, and this year AES Corporate ranked as
a top workplace in a survey conducted by The Washington Post. Additionally, many of our businesses were
recognized for excellence in customer service; sustainability and corporate social responsibility; safety, the
environment and operational excellence.

Despite a difficult environment in 2014, we look back with pride on our continued progress on many fronts and
focus on our ultimate mission to improve lives by providing safe, reliable and sustainable energy solutions in
every market we serve.

Andrés Gluski
President and Chief Executive Officer

                                                         5                                                       back to table of contents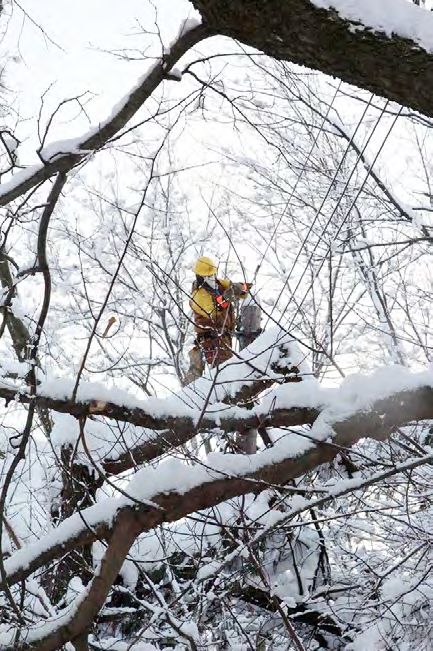
AES 2014 Sustainability Report

                                                                           types, including coal, diesel, gas, oil, pet coke and
                                                                           renewables. Our people share a passion to help
   ORGANIZATIONAL                                                          meet the world’s current and increasing energy
   PROFILE                                                                 needs, while providing communities and countries
                                                                           the opportunity for economic growth due to the
                                                                           availability of reliable, affordable electric power.
The AES Corporation (NYSE: AES) is a Fortune 200
global power company that was founded in 1981.
                                                                           The company is organized in six Strategic Business
The company is headquartered in Arlington,
                                                                           Units (SBUs):
Virginia, USA and is a publically traded global power

                                                                                                                                                              ORGANIZATIONAL PROFILE
company incorporated under the laws of Delaware,
                                                                                 •
                                                                                   Andes: Chile, Colombia and Argentina
governed by a Board of Directors.                                                •
                                                                                   Asia: Vietnam, Sri Lanka, India and the
                                                                                    Philippines
We provide affordable, sustainable energy to 18                                  •
                                                                                   Brazil: São Paulo and Rio Grande do Sul
countries through our diverse portfolio of
                                                                                 • Europe: Bulgaria, Jordan, Kazakhstan,
distribution businesses as well as thermal and
                                                                                    Netherlands and the United Kingdom
renewable generation facilities. Our workforce of
18,389 people is committed to operational                                        • MCAC (Mexico, Central America and the
excellence and meeting the world’s changing power                                   Caribbean): El Salvador, Dominican Republic,
needs. Our 2014 revenues were US $17 billion and                                    Mexico, Panama and Puerto Rico
we own and manage US $39 billion in total assets.                                •
                                                                                   US (United States of America): California,
                                                                                    Hawaii, Indiana, Maryland, Ohio, Oklahoma,
We are dedicated to improving the lives of our                                      Pennsylvania, Texas and West Virginia
customers by leveraging our energy solutions that
encompass a broad range of technologies and fuel

                                                                                            102 Generation Facilities
                     18,389 Employees
                                                                                            8 Utilities

                                                                                            Net Revenue: US $17.1 billion
                     18 Countries
                                                                                            Total Assets: US $38.9 billion

                                                                                            Beneficial Owenership:
                     34,732 MW capacity
                                                                                            9.3% T. Rowe Price Associates, Inc.
                     95,691 Utility GWh
                                                                                            8.7% BlackRock
                                                                                            8.5% CIC
                                                                                            7.4% The Vanguard Group
                                                                                            5.1% Robeco

                                               Figure 1: Scale of The AES Corporation.

    * Additional financial information is located in The AES Corporation’s 2014 Annual Report and 10-K.

                                                                     6                                                            back to table of contents
AES 2014 Sustainability Report

Within the six SBUs, we have two primary business
lines. The first business line is generation, where we       34,732 Gross MW
own and/or operate power plants to generate and              in Operation
sell power to customers, such as utilities, industrial
users, and other intermediaries. The second
business line is utilities, where we own and/or
                                                                             5%
operate utilities to generate or purchase, distribute,
                                                                                        24%
transmit and sell electricity to end-user customers
in the residential, commercial, industrial and
governmental sectors within a defined service area.           38%

                                                                                                                                     ORGANIZATIONAL PROFILE
In certain circumstances, our utilities also generate
and sell electricity on the wholesale market.
                                                                                       33%
AES is the world leader in battery-based energy
storage, with 114 MW in operation or under
construction. Although it is likely to remain                       Renewables
relatively small in the near-term, we see the
potential for a much larger opportunity over the                    Natural Gas
next four or five years:
                                                                    Coal
    •
      AES has the most comprehensive and
      accomplished fleet of battery-based energy                    Oil, Deisel and Pet Coke
      storage in the world.
    •
      U.S. Energy Information Administration (EIA)            Figure 2: Total MW by Fuel type.
      forecasts 28,000 MW of new renewable
      capacity in the next ten years and 82,000
      MW of power plant retirements over the
      same period.
    •
      Energy storage can serve as a replacement                     23%
                                                                                           36%
      resource, to absorb renewable energy AES
      Advancion is a complete battery-based grid              4%
      resource offered to utility companies and
      renewable developers.
                                                                 19%
    •
      Tailored to specific market needs in terms of                                   9%
                                                                              9%
      power and duration.

                                                                    US                 Europe

                                                                    MCAC               Asia

                                                                    Brazil             Andes

                                                              Figure 3: Total MW by SBU.

                                                         7                                               back to table of contents
AES 2014 Sustainability Report

   MATERIAL ASPECTS HIGHLIGHTED
   IN THIS REPORT
The report has been prepared in accordance with the recommendations of the Sustainability Reporting
Guidelines, version 4.0, of the Global Reporting Initiative (GRI Guidelines). We have chosen to prepare the
report in accordance with the criteria listed under the “core” option and include responses to guidance
specifically for Electric Utility Sector Disclosures. We have also responded to several aspects and disclosures
listed under the “comprehensive” option. This report is structured to present the following “material aspects”
within the context of our five broad strategic initiatives.

                                                                                                                                              REPORT HILIGHTS
  Financial Excellence

  Economic Performance
  Investment Return on Capital Allocation

  Operational Excellence

  Availability, Reliability and Access to Electricity
  Cybersecurity
  Disaster/Emergency Planning and Response

  Environmental Performance

  Aspect: Air Emissions
  Aspect: Water
  Aspect: Effluents and Byproducts
  Aspect: Biodiversity

  Stakeholder Engagement

  Impacts On Education and Living Standards in Our Communities
  Public Safety

  Our People

  Global Talent Management
  Occupational Health and Safety

                                                              8                                                   back to table of contents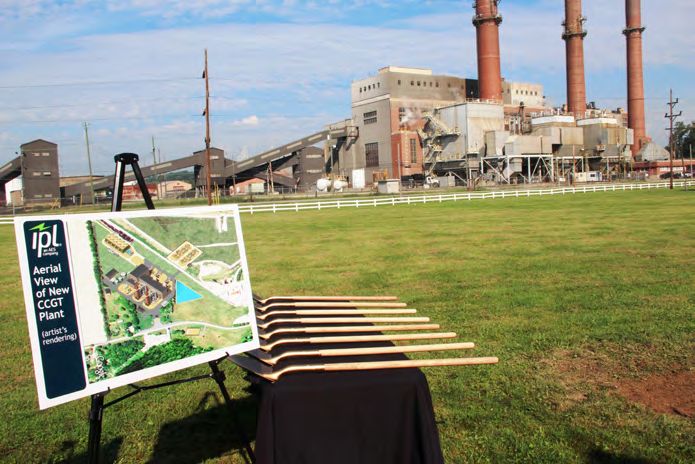
AES 2014 Sustainability Report

                                                            through contractual, regulatory and hedging
                                                            activities; and iv) focus our growth investments on
   FINANCIAL                                                expanding from our platforms in our markets where
   EXCELLENCE                                               we have a competitive advantage.

                                                            To ensure our investment opportunities align with
Executing our strategy requires that we manage
                                                            management objectives, we have an investment
sustainability issues with discipline. Financial
                                                            decision making process in place that includes
success enables us to continue to attract capital
                                                            participation from functional areas both at the
and talented people as well as invest in innovative
                                                            corporate and local levels to incorporate broad-
solutions for our customers.
                                                            based analysis of project, economic, environmental
                                                            and social risks in analyzing and prioritizing our
When our long-term strategy was defined, one of
                                                            investment opportunities.

                                                                                                                                           FINANCIAL EXCELLENCE
the three corporate objectives was to achieve total
shareholder return that is greater than our peers.
This is about delivering on our financial
                                                               Our growth plans are focused on
commitments, cost savings and creating synergies
                                                               expanding from existing platforms
and economies of scale across our portfolio of
businesses. We compare our performance relative
                                                               where we have a sustainable
to the Standard & Poor’s 500 Utilities Index.
                                                               competitive advantage.

Our financial performance is managed in keeping
                                                            This provides an added level of discipline,
with our corporate strategy to ensure the
                                                            transparency and agility to our decision making.
company’s economic sustainability. Anticipating,
                                                            Projects and transactions pass through as many as
identifying and managing risk is an essential
                                                            three decisions points through an Executive-level
element of our governance and financial
                                                            Investment Committee. For major projects, the
management functions. We manage risk at the
                                                            approval process includes a presentation to the
Strategic Business Unit (SBU) and corporate levels,
                                                            Board of Directors. According to our growth
first by minimizing exposure during the initial
                                                            investment strategy, we will only invest in a new
structuring of a business, and then by aggregating
                                                            project if it meets the following criteria:
all existing risk under the Risk Management Team,
which reviews, balances and manages risks across                •
                                                                  Maintains or enhances the value of existing
the entire portfolio. For more details on risk                     businesses;
management, please refer to 2014 AES Annual                     •
                                                                  Offers compelling risk-adjusted returns,
Report and Form 10-K.                                              while minimizing AES’ equity investment by
                                                                   utilizing project-level cash or local leverage
Disciplined allocation of our capital is an essential              capacity; and
element of our strategy. To achieve our objectives
                                                                •
                                                                  For large projects, ability to bring in partners
we operate our portfolio to: i) create value for our
                                                                   to maximize returns and fine-tune total
shareholders; ii) drive our operating businesses to
                                                                   exposure to the project.
generate capital for deployment into operational
improvements, growth investments, debt
repayment, and shareholder dividends; iii) drive
stability of cash flow and earnings in our businesses

                                                        9                                                      back to table of contents
AES 2014 Sustainability Report

                                                           We also achieved a record number of new
  ASPECT: ECONOMIC PERFORMANCE                             financings at US $5.2 billion, which ensures our
  AND INVESTMENT RETURN ON                                 debt is largely fixed rate, with longer term
  CAPITAL ALLOCATION                                       maturities and denominated in the functional
                                                           currency of the business.

Our financial results are made possible by our             By efficiently managing our operations, we have
operational excellence, safety, risk management            reduced our global administrative expenses by
approach, and ethical and effective conduct by AES         about a third, or US $200 million cumulatively,
people at all our businesses. We achieved a number         achieving the goal we established in 2011 one year
of our objectives in 2014 despite the impacts from         early. Going forward, we’re focusing on additional
adverse hydrology and other factors that affected          cost savings initiatives.
our Adjusted Earnings Per Share (EPS) by US $0.10.

                                                                                                                                          FINANCIAL EXCELLENCE
                                                           Following our goal of reducing complexity by
                                                           simplifying our portfolio, since 2011 we have
   We achieved new financings for                          reduced the number of countries where we operate
   US $5.2 billion                                         from 28 to 18 and raised US $3 billion in equity
                                                           proceeds from asset sales. In 2014 alone, we closed
                                                           10 transactions totaling US $1.8 billion in equity
Still, we earned Adjusted EPS of US $1.30, which           proceeds to AES. As a result of our efforts, 80
was at the lower end of our original guidance range        percent of our 2014 earnings and Proportional
of US $1.30 to US $1.40. We were able to offset            Free Cash Flow was generated in 10 countries in
these issues through operational improvements,             the Americas.
accelerated cost savings and our capital allocation
decisions, including share repurchases and debt
prepayments.                                                  We raised a total of US $1.9 billion
                                                              from four new partners
Our 2014 strategic achievements include:
    •
      Received US $1.9 billion from new financial
      partnerships in our subsidiaries;                    Through financial partnerships, we are expanding
    •
      Announced or closed 10 transactions for              our access to capital and fine-tuning our portfolio’s
		 US $1.8 billion in equity proceeds from                 global macroeconomic exposure and commodity
		 asset sales;                                            risks. In total, we have raised US $2.5 billion in
                                                           proceeds to AES. In 2014 we raised a total of US
    •
      Broke ground on six new platform expansion
                                                           $1.9 billion from four new partners:
   projects, totaling 2,226 MW, and won
   long-term contracts to build 1,384 MW                     •
                                                               Estrella and Linda Groups in the
		 of capacity;                                            		 Dominican Republic;

    •
      Allocated US $608 million to reduce Parent               •
                                                                 Global Infrastructure Partners (GIP) in Chile;
      debt and improve our credit profile;                     •
                                                                 La Caisse de dépôt et placement du Québec
    •
      Returned US $452 million back to                            (CDPQ) in the United States; and
      shareholders; and                                        •
                                                                 Electricity Generating Company Limited
    •
      Announced a doubling of our dividend, with                  (EGCO) in the Philippines.
      an intended growth rate of 10% per year.

                                                      10                                                      back to table of contents
AES 2014 Sustainability Report
Our overall capital allocation during the last three Our successful execution has positioned us to
years has been very shareholder focused. We have deliver average annual cash flow growth of 10 to 15
allocated 78 percent of our discretionary cash to percent over the next four years as our construction
Parent debt prepayments and returning cash to projects come on-line. We recognize that 2015 will
shareholders. We have allocated US $1.6 billion to be a challenging year due to negative
decrease our Parent debt by almost 20 percent and macroeconomic factors and poor hydrology in
improve our financial flexibility. We have also Brazil. Nonetheless, we will continue to execute on
reduced our share count by 10 percent and doubled our strategy to create shareholder value by
our dividend to US $0.10 per share per quarter, continuing to pull the levers we have outlined.
beginning in the first quarter of 2015.
Finally, we are pleased that despite our shortfall in
Proportional Free Cash Flow, we generated US $523
FINANCIAL EXCELLENCE
million in parent free cash flow, above the expected
guidance mid-point of US $500 million.
MONG DUONG II RECEIVES PFI ASIA BEST PRACTICE AWARD
Mong Duong II is a 1,240 MW coal-fired
power plant that will provide power for
2.25 million Vietnamese households
upon completion. The project is
expected to achieve commercial
operations during the second half of
2015. Once completed, this project
will contribute meaningful cash flow
to the company, while also providing
Vietnam with a safe and reliable source
of electricity to help support its growing
economy.
The project won a Project Finance International (PFI) Asia Best Practice Award. This is the second
PFI award the Mong Duong II construction project has received. In 2011 the project received the
award for Asia Pacific Power Deal of the Year.
Following the 2011 award, PFI continued to monitor the implementation and progress of the
Mong Duong II project. The project received the PFI Asia Best Practices Award for the power
sector by exceling in the following categories: government procurement, private sector
development, bond deal, infrastructure deal, power sector, and renewables.
The project is the country’s largest private sector power project, and AES is the first independent
power producer (IPP) to reach successful closure of a financial deal in Vietnam since 2003.
11 back to table of contentsAES 2014 Sustainability Report
where they operate. Local government and
authorities perform studies to anticipate energy
OPERATIONAL needs, and our businesses can act as market players
EXCELLENCE and make investments that are aligned with the
corporate strategy and criteria.
AES businesses improve lives by fueling quality of
life, local economies and the well-being of families ASPECT: AVAILABILITY, RELIABILITY
around the world. We continually improve the way AND ACCESS TO ELECTRICITY
we work and strive to deliver energy in the most
efficient, safe and reliable manner we can, and we
encourage our businesses to perform above and With more than 30 years of experience, our diverse
beyond expectations and strive for excellence. mix of generation sources and utilities provides us
OPERATIONAL EXCELLENCE
the strength and flexibility to adapt to local and
Guaranteeing a regular supply of electricity to our regional growing energy needs, maximize plant
customers requires the use of modern technologies efficiency and deliver the electricity needed now
for power delivery as well as system reliability and in the future, which is essential to human
monitoring. Thus, it is essential that we strive for progress, economic growth, public health
excellence as we operate our businesses each day. and security.
We consider operational excellence to include not Our 2014 operating performance for the year was
only supplying reliable, affordable power and driven by the strategic management of our assets
ensuring our plants are available to run as much of and cost reductions across our portfolio, but we
the time as possible, but also managing physical also faced dry hydrological conditions across a few
and cybersecurity, disasters and emergencies, public markets in Latin America and reliability challenges
safety, and environmental performance. at our generation businesses in the Philippines
and the United States as well as our utilities in
For each of these dimensions of our operations, we Brazil.
have management systems in place that provide
training to support better performance as well as a
uniform system of Key Performance Indicators Generation
(KPIs) for all of our distribution and generation We own and/or operate power plants, which we use
businesses. to generate electricity for our customers, such as
utilities, industrial users and other intermediaries
Operational KPIs performance is tracked on a under both long-term contracts and in competitive
monthly basis and reported in the Executive markets. We strive to provide diverse fuel
Leadership Monthly Performance Review meeting. technologies that are well-suited to the individual
Additionally, KPIs are tied to the compensation of markets in which we operate. These fuel
AES people at the business and corporate levels and technologies include coal, diesel, gas, oil, pet coke
yearly global targets are set and disclosed in and renewables.
corporate filings.
AES businesses have no direct responsibility over 247 MW of new capacity
the programmed capacity to address projected came online in 2014
long-term electricity demand in the countries
12 back to table of contentsAES 2014 Sustainability Report
In 2014, we added 247 MW of new capacity
through one platform expansion project: IPP4 in We have 7,141 MW of new
Jordan. We also broke ground on six new platform capacity under construction —
expansion projects totaling 2,200 MW. Also, the most in our 34-year history.
Southern California Edison (SCE) awarded AES
20-year Power Purchase Agreements (PPAs) to
provide 1,284 MW of combined cycle gas-fired Our planned future capacity growth will come from
generation and 100 MW of interconnected a combination of projects currently under
battery-based energy storage. The System Operator construction and development. We have 7,141 MW
Northern Ireland (SONI), the firm that manages the of new capacity under construction — the most in
reliability of the electricity system, also awarded to our 34-year history. These projects — which are
AES a contract to provide additional capacity of expected to come on-line through 2018 —
OPERATIONAL EXCELLENCE
250 MW to meet a projected energy shortfall over represent US $9 billion in total capital expenditures,
the coming years. with the majority of AES’ US $1.5 billion in equity
already funded.
Country Power Plant Fuel Gross MW
Cochrane Coal 532
Alto Maipo Hydro 531
Chile Guacolda V Coal 152
Cochrane Energy Storage1 Energy Storage 20
Andes Solar Solar 21
Colombia Tunjita Hydro 20
Dominican Republic DPP (Los Mina) Conversion Gas 122
India OPGC II Coal 1,320
Panama Estrella del Mar I Fuel Oil 72
IPL MATS Coal 2,400
United States Eagle Valley CCGT Gas 671
Warrior Run Energy Storage1 Energy Storage 20
Vietnam Mong Duong II Coal 1,240
Table 1: Megawatts under construction - 2014.
1
Energy Storage MW are a power plant equivalent dispatchable resource, including supply and load capability.
13 back to table of contentsAES 2014 Sustainability Report
In pursuit of operational excellence, AES businesses additional 15 MW at the 236 MW gas-fired
are continuously looking for ways to improve generation facility. This increased capacity will allow
performance and develop new adjacencies and Los Mina to provide additional power to their
enhancements that help us better serve our customers if required. The installation of fogging
customers. technology in gas turbines allows the recovery of a
substantial part of the rated output of the gas
For example in 2014, Los Mina (Dominican turbine in order to compensate the loss of power
Republic, MCAC SBU) successfully installed due to the increase of ambient air temperature.
innovative fogging technology that generates an
POWERING A CLEANER FUTURE FOR CALIFORNIA
OPERATIONAL EXCELLENCE
AES is providing innovative energy
solutions designed to meet California’s
long-term electricity needs and help
achieve its environmental goals. By using
advanced battery-based energy storage
and modern combined cycle gas turbine
(CCGT) technology, we are laying the
groundwork for a better, smarter and
cleaner power grid.
Rendering of Alamitos Energy Storage
In November 2014 AES was awarded 20-year contracts by Southern California Edison (SCE)
to provide 1,284 MW of combined cycle gas-fired generation and 100 MW of interconnected
battery-based energy storage (equivalent to 200 MW of flexible energy storage resource). This
new capacity will be built at the company’s existing power plant sites in Huntington Beach and
Long Beach, located south of Los Angeles, California.
AES offered SCE a suite of energy solutions designed to modernize vintage power plants and bring
the cleanest and best technology to Southern California. These new power solutions help support
a low carbon, highly reliable grid that makes the most of California’s natural resources.
In addition to replacing older plants, SCE chose advanced energy storage as a cost-effective way
to ensure critical power system reliability in the Western Los Angeles Basin. This new storage
resource will provide unmatched operational flexibility, enabling the most efficient dispatch of
other generating plants, lowering cost and emissions, and supporting the ongoing addition of
renewable power sources.
This win not only ensures our continued strong presence in the U.S. Independent Power Producer
(IPP) market and Southern California in particular, but it also consolidates our global lead in the
use of utility scale lithium ion batteries for grid applications.
14 back to table of contentsAES 2014 Sustainability Report
AVERAGE PLANT AVAILABILITY FACTOR In 2014, our generation portfolio performance in
Generation in Gigawatt-hour (GWh) was down 4 terms of commercial availability deteriorated,
percent compared to 2013, mainly driven by dry largely driven by the unplanned outages mentioned
hydrological conditions in Brazil and Panama, as before. Most of these events have been resolved
well as higher unplanned outages at our generation and going forward, mitigation plans have been
plants in Ohio and the Philippines. The dry implemented.
conditions were partially offset by new capacity
in Chile.
Renewables
Natural Oil, Diesel
OPERATIONAL EXCELLENCE
SBU Coal (Hydro, Wind, Biomass, Total
Gas Landfill Gas) & Petcoke
AES Total 69,669.48 25,528.47 29,189.11 5,456.24 129,843.29
Andes 18,168.10 10,496.70 7,250.91 0.14 35,915.86
Asia 6,726.63 0.00 0.00 487.61 7,214.23
Brazil 0.00 0.51 7,352.95 0.00 7,353.46
EMEA 5,823.03 6,663.17 10,030.65 858.70 23,375.55
MCAC 5,518.53 5,822.38 2,004.75 3,962.09 17,307.76
US 33,433.19 2,545.70 2,549.85 147.70 38,676.43
Table 2: 2014 Net Energy Generated (GWh) by SBU and fuel type.
Commercial
2011 2012 2013 2014 2014 target
Availability (CA)1
AES total 92.2% 89.1% 93.5% 90.5% 93.86%
Coal 90.2% 88.3% 88.4% 83.51%
Gas 92.4% 91.4% 90.4% 95.31%
Hydro 99.9% 97.1% 98.3% 97%
Oil 97.7% 99% 100% 95.47%
Wind2 95.6% 96.8% 96.3% 95.65%
Table 3: Commercial Availability by energy source, 2011 - 2014.
1
Commercial Availability: Actual variable margin, as a percentage of potential variable margin if the unit had been available at full
capacity during outages
2
Commercial Availability of a wind farm is determined using a different methodology, that is why it is not included in the AES Total
15 back to table of contentsAES 2014 Sustainability Report
Brazilian businesses, which increased our System
Distribution
Average Interruption Duration Index (SAIDI) and
System Average Interruption Frequency Index
Our AES utilities businesses deliver electricity to
(SAIFI). For example, the area served by AES Sul in
approximately 10.4 million customers. The
Brazil experienced severe weather conditions such
reliability of our distribution networks is tracked by
as atypical frequent summer storms (14 storms
the average number and duration of system
within 28 days with winds higher than 150km/h),
interruptions per customer and is consolidated
which caused damage to the distribution
based on ownership-adjusted EBITDA. In addition,
infrastructure and impacted performance.
AES sets targets for customer satisfaction
(percentage of customers satisfied/greatly satisfied)
Nevertheless, we continue to experience an
as one of five KPIs for the utilities’ businesses.
improvement trend over the past years due to
OPERATIONAL EXCELLENCE
proactive programs to improve reliability and
Our utility portfolio performance declined mainly
customer satisfaction.
driven by severe weather-related impacts at our
Business 2011 2012 2013 2014 2014 target
Actual 10.02 7.01 5.96 6.13 5 .23
AES El Salvador 19.56 17.39 18.31 19.38
AES Eletropaulo 10.43 8.35 7.99 8.86
AES Sul 15.37 14.26 14.08 18.30
Dayton Power & - 1.56 1.32 1.82
Light (DP&L)
Indianapolis Power 0.59 0.95 0.81 0.95
& Light (IPL)
Table 4: System Average Interruption Duration Index (SAIDI)3 , 2011 - 2014.
3
SAIDI - represents the total minutes of interruption the average customer experiences annually.
16 back to table of contentsAES 2014 Sustainability Report
12.00
8.00
4.00
0.00
2011 2012 2013 2014
Actual Trend
Figure 4: Utility businesses SAIDI trend, 2011 - 2014.
OPERATIONAL EXCELLENCE
Business 2011 2012 2013 2014 2014 target
Actual 5.59 3.93 2.97 3.70 4 .01
AES El Salvador 8.03 7.52 6.92 5.93
AES Eletropaulo 5.50 4.64 4.34 3.81
AES Sul 9.27 8.44 7.41 8.99
Dayton Power & - 0.79 0.58 0.92
Light (DP&L)
Indianapolis Power 0.60 0.82 0.73 0.71
& Light (IPL)
Table 5: System Average Interruption Frequency Index (SAIFI)4, 2011 - 2014.
SAIFI – represents the average number of interruptions the average customer experiences annually
4
6.00
4.00
2.00
0.00
2011 2012 2013 2014
Actual Trend
Figure 5: Utility businesses SAIFI trend, 2011 - 2014.
17 back to table of contentsAES 2014 Sustainability Report
GUARANTEEING RELIABILITY AND DISTRIBUTION
CAPACITY DURING THE WORLD CUP
During 2014, Brazil was busy preparing
to host the FIFA World Cup. AES Brazil
worked hard to ensure the games, and
the fans, had the power they needed
as well as to guarantee there were no
disruptions in the distribution of energy
during the matches.
OPERATIONAL EXCELLENCE
AES Eletropaulo, which serves various
cities in the State of Sao Paulo, was
part of a committee created to unify
all public and infrastructure services
involved with the games of the World Cup, such as the fire department, city hall and civil defense.
AES Eletropaulo reinforced its contingency plan with more than 2,000 employees working in shifts
24 hours/day during the World Cup. AES people also were on call on during the matches as a back-
up plan.
The strategic points of the concession area included power circuits near hospitals, airports, bus
stations and hotels as well as regions with high concentrations of fans. We worked proactively to
avoid any event with the distribution network during the games, and we were prepared to respond
as soon as possible if anything happened.
Also, as part of the effort to ensure energy was supplied to the Corinthians Stadium, which
hosted the World Cup’s opening ceremony, the stadium was set up to receive supply from two
independent energy circuits, so one would work even if the other was undergoing problems.
Another guarantee for the maintenance of energy distribution during the event was the
commissioning of the new 120 MW Juscelino Kubitscheck Distribution Transformation Station.
This station supplies energy to approximately 300,000 people.
18 back to table of contentsAES 2014 Sustainability Report
by a Service Quality and Image Recovery Plan
implemented by our Brazilian utility AES
Eletropaulo.
The 2014 customer satisfaction results for AES’
utilities businesses combined is lower than the
established target attributable to external factors
related to lengthy severe weather in Brazil, as
mentioned before, that had an effect on customer
sensitivity. The third party survey conducted in
Brazil occurs in March every year during summer
Customer Satisfaction weather conditions and often is negatively
OPERATIONAL EXCELLENCE
impacted by weather-related energy outages.
AES sets annual targets for customer satisfaction as
one of five KPIs for utility businesses that impacts Some of our customer satisfaction
highlights include:
annual compensation of business leaders. The
targets and actuals are tracked on a monthly basis US SBU
in the Executive Monthly Performance Review
• IPL has the best satisfaction rating amongst
meeting. Our utilities’ customer satisfaction surveys
Indiana investor-owned utilities and the fifth
target both residential and commercial customers.
highest customer satisfaction ranking out of
the seventeen utilities included in the Midwest
In cases where nationally and/or regionally
Mid-size region, as measured by the J.D. Power
conducted third-party surveys are available, AES
and Associates 2014 Electric Utility Residential
utilities participate in them. These include J.D.
Study.
Power & Associates for our US utilities and CIER/
ABRADEE surveys for our El Salvadoran and Brazilian • IPL ranked number one, for the second
utilities. The surveys, with their statistically consecutive year, in business customer
significant representative samples, included AES’ satisfaction among Midwest Mid-Size Utilities
complete customer base and employed similar in the J.D. Power 2014 Electric Utility Business
methodologies in 2013 and 2014. Customer Satisfaction Study.
• IPL and DPL were recognized in December
AES has experienced a recent growing positive 2014 as two of only three Midwest electric
trend in customer satisfaction in 2013 and 2014 as utilities named as 2014 Utility Customer
compared to 2011 and 2012. This is mainly driven Champions by Cogent Reports, a division of
Market Strategies International.
2011 2012 2013 2014 2014 target
Percentage of customer
77.8% 79.1% 86.4% 85.6% 87.5%
satisfaction5
Table 6: Consolidated Customer Satisfaction for distribution businesses 2011 - 2014.
The consolidated Customer Satisfaction Totals from 2010 to 2012 do not include IPL and DPL satisfaction results due to the
5
different survey methodologies.
19 back to table of contentsAES 2014 Sustainability Report
Brazil SBU
ASPECT: CYBERSECURITY
• AES Eletropaulo was recognized by the Exame
Magazine’s Sustainability Guide as the best
company in the energy sector and as a leader
At AES, we consider cybersecurity a safety issue
in customer relations for initiatives such as the
that starts with our people — we must put safety
Jeito AES de Atender (JAAT) program.
first when leveraging the power of the Internet both
• Achieved the best position in PROCON at work and at home. The energy sector continues
Ranking (a government agency that defends to be the top targeted industry in regard to
the rights of clients) for AES Eletropaulo in 10 industrial control system attacks. According to The
years. AES Eletropaulo improved six positions Industrial Control Systems Cyber Emergency
in relation to the State Ranking 2014, going Response Team (ICS CERT), the organization
from 21st to 27th. AES Eletropaulo’s answered
OPERATIONAL EXCELLENCE
responsible for industry response to cybersecurity
complaints index also improved. This ranking threats in the United States, in 2014 the energy
considers all complaints registered and sector garnered 32 percent of industrial control
classified by the PROCON from January to system attacks. The majority of these attacks are
December 2014. reconnaissance to capture infrastructure/
• AES Eletropaulo received the ABT Award in architecture designs or determine system
Technical and Quality Management Service capabilities. As a result of the growing cyber threats
from the Brazilian Institute of Relationship targeting industrial control systems, the U.S.
Marketing (IBMR). Congress and the European Community (EC) are
• AES Eletropaulo received three awards based working to strengthen national policy and
on client support improvements made to its regulatory requirements.
website, mobile support and in stores. The
awards were granted at the 2014 Smart Although AES has not experienced any significant
Contact Center Congress in São Paulo and intrusion to our systems or customer data, the
acknowledge the best practices in customer converging trends drove the recent evolution of our
relations. AES Eletropaulo also received the cybersecurity plan from broad strategic goals to a
highest accolade of the event, which is given highly organized program supported by five
annually to the company with the best well-defined elements (see Figure 6).
practices in customer relations.
In order to better manage global cyber risk, the
Our generation businesses also focus on customer AES Cybersecurity Team is implementing a Data
satisfaction, which is measured through surveys and Lifecycle Risk Model to address cybersecurity risk at
discussions related to long-term purchase power the data, infrastructure/application and end user
agreements. For example, our Europe SBU levels as well as a system criticality and impact
developed CRM guidelines/policies in 2014 that are methodology for networks in the power operations
applicable to our businesses in order to improve environment.
their relations with customers as well as to
standardize these processes within the SBU. In 2014 we expanded the AES Cybersecurity
Guidelines to better address critical operational
systems risks. The latest guidelines were developed
in synchronization with the AES Cyber Program’s
strategic roadmap and current cyber risks and are
based on industry standards such as the U.S.
20 back to table of contentsAES 2014 Sustainability Report
Risk
Management
Governance Cyber
and Policy Program Communications
Elements
Cybersecurity AES Cyber
Operations Academy
OPERATIONAL EXCELLENCE
Figure 6: AES Cybersecurity Program Elements.
Department of Energy’s Capability Maturity Model, and reinforce messages. These efforts will aid in the
SANS Institute Critical Controls and the U.S. institutionalization of other program elements and
National Institute of Standards and Technology ensure a more secure and self-perpetuating
(NIST) Cybersecurity Framework. The Cybersecurity cybersecurity culture.
Team continuously refines the program’s risk-based
approaches to address the constantly changing In addition to developing a more robust
threat environment that the energy sector and, communication strategy, the AES Cybersecurity
more specifically, AES must counter on a Team is also consolidating and expanding current
real-time basis. cybersecurity awareness initiatives, positional
skillset identification and assignments, and training
In order to further mitigate cyber risk, the Chief curriculum development efforts into a
Information Security Officer (CISO) works in direct comprehensive initiative entitled the AES Cyber
coordination with all AES businesses to identify risks Academy. The Academy is an expansion of the
and determine appropriate mitigation solutions and Cybersecurity Team’s efforts to raise awareness
best practices in proactive monitoring. AES also regarding cybersecurity threats and risks across not
partners with key U.S. government agencies and only our cybersecurity personnel but the entire AES
other agencies abroad as well as with leading global workforce. The AES Cyber Academy will also
technology companies to help reduce the likelihood expand the training opportunities for all AES people
of a cyberattack, and allow the Cybersecurity Team needing or interested in gaining greater
to respond quickly and appropriately if the cybersecurity skills.
company is impacted.
Finally, on the technical side of cybersecurity
To better communicate the growing importance of operations, the corporate office has worked with
cybersecurity to our business success, the the SBUs to improve the security architecture and
Cybersecurity Team is developing a unified segmentation of their networks. In addition, AES
communication strategy designed to collect all of Corporate and SBUs have begun the process of
the communication means and channels currently transitioning to a single global Security Operation
used as well as leveraging others used by different Center (SOC) to unify cyber defenses and create
functions within AES. The goal is to better cost savings and technical synergies for both
communicate a unified set of cybersecurity themes enterprise and power operations systems and
applications.
21 back to table of contentsAES 2014 Sustainability Report
Our Cybersecurity Guidelines
cover over 10 foundational areas
of cybersecurity and are based on
industry standards and best
practices.
In 2014 the Cybersecurity Team was recognized by
SANS Institue for their efforts to keep AES safe by
identifying an opportunity to improve AES’ defense
architecture by piloting and then implementing a
OPERATIONAL EXCELLENCE
global advanced threat protection solution to
complement our existing defenses (such as
firewalls, intrusion prevention and detection – Cyber Ninja Guide –
systems, anti-malware software, and web and email
content filters). SANS is the most trusted and the
AES Cyber Ninja Guide provide guidelines to
largest source for information security training in educate, enable and empower AES people
the world, and since 2011 has been celebrating and contractors.
those “Difference Makers” whose innovation, skill
and effort have driven real improvements in
information security.
The Global Cybersecurity Team also received
accolades for the development of the 2014 AES
Cyber Ninja Guide, which provides a comprehensive ASPECT: DISASTER/EMERGENCY
set of guidelines designed to educate, enable and PLANNING AND RESPONSE
empower AES people and contractors to play an
active role in protecting themselves and their
families from the growing risks of connectivity. AES businesses face a multitude of potential
scenarios that can cause significant business and
The guide was prepared through a collaborative operational disruption. Natural disasters, weather,
effort among all six SBUs and the AES Cybersecurity as well as socio-political instability can affect our
Team and covers topics related to: operations.
• Cybersecurity when working in the field
As a provider of essential services, we have
or in AES facilities;
established programs to ensure our operations are
• Cybersecurity when working outside prepared to cope with unusual disruptions. Our
the office; management approach includes a set of emergency
• Suggestions on what to do in specific preparedness standards describing requirements for
threatening situations; and the development, review and implementation of
• Cyber safety tips when traveling. Business Continuity Plans at each AES location.
22 back to table of contentsAES 2014 Sustainability Report
These plans, which also consider local regulations,
include preparedness for: We have programs in place to
ensure our operations are prepared
• Operational emergencies;
to deal with unusual disruptions
• Emergencies
involving nature, e.g., severe
weather, floods, earthquakes, tsunamis, etc.;
• Off-site
emergencies that will have a For example, as part of a proactive risk prevention
significant impact on operations or staff; and plan for its hydroelectric plants, AES Panama
• Physical
security measures, including conducted simulation exercises with the
evacuation of our employees in case communities near its plants of Bayano and Esti.
of unrest. More than 80 people representing AES Panama,
national safety institutions and the local
OPERATIONAL EXCELLENCE
We proactively prepare for such events with the governments participated in two separate
goal of keeping our business and operations running simulations of potential disaster scenarios designed
effectively, safely and securely. To ensure business to help assess emergency alert procedures as well
continuity, scenarios are defined with actions to as determine emergency response capacity and
maintain an acceptable level of operational coordination with government institutions. This
capability while restoring AES operations. simulation exercise allowed the local team to test
the effectiveness of our procedures and raise
Such actions include continual monitoring of awareness in our neighboring communities about
weather systems; staging of resources prior to the risk of living in flood-prone areas.
anticipated emergencies; mobilization to restore
outages; clear and frequent communications with In addition to emergency preparedness standards,
customers, the media and government officials; each business has a comprehensive playbook with
continuous improvement of our emergency the following plans: Business Continuity,
response capabilities based on past performance; Cybersecurity, Physical Asset and Personnel
collaboration with neighboring utilities, contractors Security, Crisis Communication, Stakeholder
and government officials; and extensive storm Management and Succession.
response training including detailed storm
simulations. In addition, each business trains its
people and, when necessary, establishes an
educational program with the local communities.
23 back to table of contentsAES 2014 Sustainability Report
COMMUNITY APPLAUDS RECOVERY EFFORTS DURING WINTER STORM
Early in 2014, much of the United States suffered from a
major winter storm that brought record low temperatures
to most of the country. Our utility and Indianapolis Power
& Light (IPL) in the US Strategic Business Unit (SBU), faced
significant outages and challenging work conditions.
The storm affected the highest number of customers in
the IPL served area since September 2008. The extreme
conditions of cold temperatures, high winds, snow and ice,
OPERATIONAL EXCELLENCE
plus less daylight added extra challenges to the restoration
efforts when compared to 2008’s storm caused by winds
from Hurricane Ike.
After days of 16-hour shifts, minus 40 degree Fahrenheit
wind chill temperatures and snow-buried access to
damaged lines and transformers, the restoration of
approximately 65,000 customers affected by the storm was completed by the target date.
During the recovery efforts, there were continuous updates to the Indiana Utility Regulatory
Commission (IURC), state and local agencies, and key accounts as well as communications to
the public via traditional and social media.
These efforts were recognized with an editorial cartoon in the Indianapolis Star depicting an IPL
lineman in a Superman uniform on a utility pole battling the elements. Additionally, the local
city council passed a special resolution honoring a five-day restoration effort by IPL and mutual
assistance crews that restored 1,000 outage events during the city’s worst storm since 1978.
IPL also received many emails from grateful customers, who included a variety of community
members such as downtown hotel representatives, local university officials and homeowners.
Words like “awesome,” “heroic” and “respect” were repeatedly used.
24 back to table of contentsAES 2014 Sustainability Report
Environmental performance is managed in
ENVIRONMENTAL accordance with an Environmental Management
PERFORMANCE System (EMS) Framework that is consistent with
the principles of the ISO 14001 Environmental
Management System standard. Under the
OUR APPROACH framework, each business develops an
At AES, we are committed to our company vision to environmental program that includes
be the world’s leading sustainable power company environmental procedures, performance
that safely provides reliable, affordable energy. We monitoring, audits and risk assessment, objectives,
seek to select environmentally compliant as well as targets and action plans. A graphical representation
an environmentally sound energy solutions for each of our EMS approach is shown in Figure 7.
market we serve through impact evaluations,
technological innovation and implementation of In order to verify the adherence and compliance of
ENVIRONMENTAL PERFORMANCE
appropriate environmental controls. our businesses to the AES EMS Framework and
standards, we have developed an environmental
We have established a governance structure that audit program that includes both formal external
ensures assigning clear roles, responsibilities and (conducted by Environmental Health and Safety
accountability for overall environmental [EHS] specialists from outside the audited site) and
performance and goal attainment. Each business internal (conducted by operating site personnel)
managed by AES is responsible for aligning their audits. Findings are accompanied by a corrective
local environmental goals with AES company-wide action plan and an agreed upon completion date.
and SBU goals. Also, about 67 percent of our AES operating
businesses have voluntarily certified their EMS to
AES has an Environmental Policy (available on our the ISO 14001 international standard.
website), which comprises four principles applicable
to all of our operating businesses and construction
projects. The policy sets the expectations for our 61 AES operating businesses have
AES people and contractors at all covered locations, an ISO 14001 certified EMS
and is the foundation of our environmental
management approach.
AES ENVIRONMENTAL POLICY
1. Meet or exceed the requirements of environmental rules and regulations imposed by
local, regional, and national governments and by participating financial institutions.
2. Meet or exceed our Environmental Standards.
3. Make decisions on additional expenditures based on a number of factors, including an
evaluation of the local, regional and global environment where the term “environment”
is broadly defined as the external surroundings or conditions within which people live —
including ecological, economic, social and all other factors that determine quality of life
and standard of living.
4. Seek continual improvement of the environmental performance at every AES business.
25 back to table of contentsYou can also read