Palliative and end of life care - Marie Curie
←
→
Page content transcription
If your browser does not render page correctly, please read the page content below
Palliative
and end of
life care
for Black, Asian and Minority
Ethnic groups in the UK
Demographic profile and the current state
of palliative and end of life care provision
Natalia Calanzani, Dr Jonathan Koffman, Irene J Higginson
King’s College London, Cicely Saunders Institute

June 2013

End-of-life needs and attitudes: review summary

2

Palliative and end of life care for Black,
Asian and Minority Ethnic groups
in the UK
Demographic profile and the current state
of palliative and end of life care provision
Natalia Calanzani, Dr Jonathan Koffman, Irene J Higginson
King’s College London, Cicely Saunders Institute
Palliative and end of life care for Black, Asian and Minority Ethnic (BAME) groups in the UK

Contents
                     List of boxes, tables and figures                                              5
                     Foreword                                                                       6
                     Executive summary                                                              7
                     1. Introduction                                                               11
                        1.1 Differences that make a difference                                     11

                     2. Methods                                                                    14
                        2.1 Analysis of socio-demographic data and projections                     14
                        2.2 Identification and appraisal of evidence from reviews                  16

                     3. Current and projected profile of BAME groups in the UK                     18
                        3.1 Current profile in England: ethnicity, language, religion, age and
                     		 characteristics of the foreign born                                        18
                        3.2 Current profile in Wales: ethnicity, language, religion, age and
                     		 characteristics of the foreign born                                        24
                        3.3 Current profile in Scotland: ethnicity, religion and characteristics
                     		 of the foreign born                                                        28
                        3.4 Current profile in Northern Ireland: ethnicity, language, religion
                     		 and characteristics of the foreign born                                    29
                        3.5 Projected profile: UK population projections by ethnicity              32

                     4. Literature reviews on palliative and end of life care for BAME groups      36
                        4.1 Results                                                                36
                        4.2 Information on included studies                                        36
                        4.3 Methodological quality                                                 37
                        4.4 Key findings on the current state of palliative and end of life
                     		 care provision                                                             37
                     		 4.4.1 Unmet needs and disparities in access to palliative and
                     			           end of life care                                                38
                     		 4.4.2 Unmet needs and disparities when in receipt of palliative
                     			           and end of life care                                            39
                        4.5 Ways forward: Recommendations for policy, practice and research
                     		 and best practices from reviews                                            42
                     5. Take home messages                                                         47
                        5.1. Limitations of report and current evidence                            47
                        5.2 Where do we go from here?                                              49
                     6. Appendices                                                                 52
                     7. References                                                                 71
4
Palliative and end of life care for Black, Asian and Minority Ethnic (BAME) groups in the UK
List of boxes, tables
and figures
Boxes
Box 1 – Conceptual confusion and the language of diversity 12
Box 2 – Residents’ top ten main languages and English proficiency
in 2011 (England) 22
Box 3 – Usual residents in England born outside the UK 23
Box 4 – Residents’ top ten main languages and English proficiency
in 2011 (Wales) 26
Box 5 – Usual residents in Wales born outside the UK 27
Box 6 – Religion and top ten countries of birth in Scotland (2001 Census
and 2011 estimates) 29
Box 7 – Residents’ top 10 main languages and English proficiency in 2011
(Northern Ireland) 31
Box 8 – The ageing of minority ethnic groups according to Lievesley (2010) 34
Tables
Table 1 – Census questions on ethnicity for England and Wales 15
Table 2 – Population by ethnic group in England in 2001 and 2011 19
Table 3 – Population by ethnic group in Wales in 2001 and 2011 24
Table 4 – Population by ethnic group in Scotland in 2001 28
Table 5 – Population by ethnic group in Northern Ireland in 2001 and 2011 30
Table 6 – Ageing of all ethnic groups in England and Wales (2016 and 2026) 33
Table 7 – Core issues regarding ethnic monitoring and assumptions
regarding ethnicity 37
Table 8 – Recommendations for policy from included reviews 44
Table 9 – Recommendations for practice from included reviews 44
Table 10 – Recommendations for research from included reviews 45
Figures
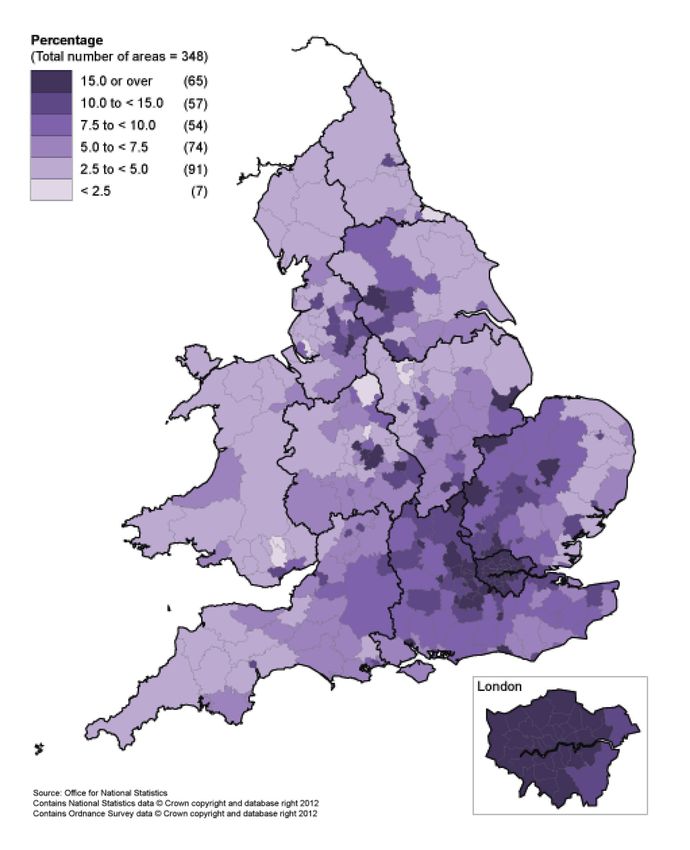
Figure 1 – Proportion of main ethnic groups across English regions in 2011 20
Figure 2 – Estimated number of people aged 65+ from BAME groups
in England (in thousands) 20
Figure 3 – Religion in England in 2001 and 2011 21
Figure 4 – Estimated number of people aged 65+ from BAME groups
in Wales (in thousands) 25
Figure 5 – Religion in Wales in 2001 and 2011 26
Figure 6 – Religion in Northern Ireland in 2001 and 2011 30
Figure 7 – Top ten countries of birth amongst the foreign born in
Northern Ireland in 2011 31
Figure 8 – Summary of the current state of palliative and end of life care
provision for BAME groups 43
5Palliative and end of life care for Black, Asian and Minority Ethnic (BAME) groups in the UK
Foreword
Every individual will have a view of what a ‘good may not always coincide with those of users of
death’ means to them. Recognising and meeting those services. Misunderstandings, mistrust and a
this aim for everyone should be the goal of lack of cultural sensitivity on the part of providers
all providers of palliative and end of life care. of services are identified as reasons for low uptake
Much has been achieved in the past five years but can begin to be addressed by the simple step
of increased political focus on End of Life Care, of improved communication with the person and
to identify and spread good practice, both in the their family.
organisation of whole services and in the delivery
of care to each person who is dying. This report This report marks the start of a programme of
recommends that the focus of end of life care work by many partners. A better understanding
needs to shift from care for those with terminal of the nation’s changing demographics, of the
cancer, to care for everyone, from all backgrounds needs of individual ethnic and cultural groups
and with all terminal illnesses. and of the types of services which will best meet
their end of life care needs must be early outputs
Progress is already being made by ensuring that from the partnership. There are many areas
access to care is not influenced by a person’s which researchers will investigate further and
clinical diagnosis. Attention is now turning to many opportunities for service providers to work
recognising that ethnic and cultural differences together with local communities to develop care
impact on all aspects of health and the uptake of which is sensitive and responsive to their needs
health care. There is good evidence that there is as well as on a scale which will be needed for the
low use of end of life care services by people of large numbers of people who could benefit.
Black, Asian and Minority Ethnic (BAME) groups.
As more emphasis is given to the impact on health Better training is needed for health and social
and social services of an ageing population, care professionals to enable them to provide
and the need to extend the capacity and cost appropriate care to people from the different
effectiveness of care, it is clear that the numbers ethnic, cultural and religious background within
of people from BAME groups aged over 65 are their locality. This may require them to make
increasing and that the challenge of how to ensure significant changes to the way in which they have
that end of life care is appropriate and accessible traditionally worked with people and their families.
to them all is with us now.
Policy makers and commissioners will also wish to
This excellent report provides data on the wide understand the needs of their BAME populations
diversity of BAME populations across the UK and ensure that they deliver health and social care
and emphasises that these groups will soon which is available on an equitable basis.
be representing a significant proportion of the
over 65s, with almost a trebling of their numbers This report is important, thoughtful and timely. It
in 25 years. There is a great need to understand should stimulate a process of better understanding
what factors have enabled some groups of the of the needs of BAME groups and a subsequent
BAME population, particularly in areas of ethnic improvement in the support available to those
diversity, to feel able to access end of life care who are approaching the end of their lives. I am
and to learn from these services. delighted that the momentum which has been
established by the publication of the report will be
It has become apparent however that for the large sustained by a review in two years of the progress
majority of this population, services are perceived which has been made.
to have been developed by health and social care
professionals whose focus on issues of importance Dr Teresa Tate OBE, FRCP, FRCR
6Palliative and end of life care for Black, Asian and Minority Ethnic (BAME) groups in the UK
Executive summary
Background to this report increased; in 2011 they represented a fifth of the
population (10.7 million people). Wales, Northern
There is growing evidence that ethnic and cultural Ireland and Scotland also experienced changes
differences can influence patterns of advanced to the ethnic composition of their populations
disease, illness experiences, healthcare seeking (especially due to a wave of migration since 2000).
behaviour, and the use of healthcare services. In England, Other White (4.6%), Indian (2.6%) and
The End of Life Care Strategy highlights that Pakistani (2.1%) were the largest BAME groups in
although much has been done, inequalities still 2011. However, Census data identify that ethnic
exist in the care that different groups of people groups are not equally distributed across England.
receive at the end of life. In light of increasing For example, while in London less than half of the
national and international evidence of low use population was White British, in the North East
of end of life care services amongst Black, Asian they represented over 90% of the population.
and Minority Ethnic (BAME) groups it is critical to
understand the influence of ethnicity and culture Age
in the context of end of life care and to examine The relationship between those from BAME groups
strategies and recommendations to address and age is important; data for England show
inequalities. This report therefore provides an that in mid-2009 nine out of ten people over the
evidence-base to understand the profile of BAME age of 65 were White British (over 7.7 million
populations living in the UK, and identifies their people), but there have been substantial increases
unmet needs regarding palliative and end of life in the number of older people from BAME
care. Firstly, we describe the characteristics of groups when comparing mid-2001 to mid-2009
BAME groups in the UK (ethnic groups by age (reaching over 700,000 people in 2009, with wide
and geographical region, religion, language and variation across groups). About a third of the Irish
characteristics of the foreign born population). We population was aged 65+ in mid-2009 (the highest
examine to what extent the BAME populations proportion across all BAME groups), followed by
are expected to increase and grow older in the the White British (18.0%) and the Black Caribbean
next few decades according to the most recent (13.8%). In Wales there were around 18,500 people
population projections. Secondly, we appraise the from BAME groups aged 65+ in 2009 (compared
state of palliative and end of life care provision for to over half a million White British residents in this
BAME groups and present recommendations for age group). In Scotland and Northern Ireland, data
policy, practice and research available from the on the foreign born residents show that they are
literature. Lastly, based on these two sources of usually younger than the UK born population.
information we present further recommendations
with the aim to improve care for BAME Religion
populations in the UK. The numbers and proportions of people who
described themselves as Christian in England
decreased from 2001 to 2011 (from 71.7% or
What can the Census tell us over 35 million to 59.4% or over 31 million), while
about BAME groups in the UK? numbers and proportions of those having no
religion almost doubled (reaching over 13 million
Ethnicity people in 2011). Numbers and proportions of
According to the 1991, 2001 and 2011 UK people from religions other than Christian have
Censuses, the UK has become more ethnically also increased, with Muslims being the second
diverse in the past 20 years. This was especially largest religious group in 2011. Certain religious
true in England where both the numbers and groups tend to concentrate in particular areas,
proportions of people from BAME groups (all such as Muslims in London, Bradford, Luton,
ethnic groups other than White British) have Slough and Birmingham; Hindus in London and
7Palliative and end of life care for Black, Asian and Minority Ethnic (BAME) groups in the UK
Leicester; Buddhists and Jewish people in London. What do we know about the care
In Wales it was noted a decrease in numbers being provided to BAME groups in
for Jewish and Christian religions from 2001 to the UK at the end of life?
2011, while there was an increase for all other
religions and for those reporting to have no We identified 45 literature reviews describing
religion. In Northern Ireland there was an increase unmet needs and disparities in palliative and
in numbers for religions other than Christian, but end of life care for BAME groups. These reviews
also for Catholic, Other Christian religions and a principally focused on two issues: access to,
substantial increase for those either reporting to and receipt of care. Authors also recognised the
have no religion or not stating their religion. importance of understanding social inequities
(such as deprivation, differences in access to care
Language in general, social exclusion and racism) when
When it comes to language, in England over 90% analysing unmet needs and disparities. They also
of people had English as their first language in identified several difficulties in relation to coding
2011, but one out of five people who did not and monitoring ethnicity. Additionally, they warned
have it as a principal language either could not against assumptions and the use of stereotypes
speak it well or could not speak it at all (over when providing care for BAME populations (for
800,000 people). This could indicate a demand example, assuming that everyone from the same
for translation services when in receipt of care. In group behaves the same way or not being aware
Wales 97.1% had English as the first language in of their own values).
2011 and 19,305 residents could not speak English
well or could not speak it at all. Similar to Wales, in Access to palliative and end of life care
Northern Ireland 96.9% of residents had English as In terms of access to care, several authors
their principal language, while 14,469 people could reported that BAME groups had lower access
not speak it well or at all. to palliative and end of life care services when
compared to White British people. This was
associated with lack of referrals, lack of awareness
Are the numbers of people from of relevant services, previous bad experiences
BAME groups expected to increase when accessing care, a lack of information in
over time? Will people from BAME relevant languages or formats and family/religious
groups grow older? values conflicting with the idea of hospice care.
A number of authors stated that BAME groups
Population projections suggest that both the are usually younger and consequently experience
numbers and proportions of people from BAME different types of cancer compared to the majority
groups will increase in the UK, and they will White population. However, they also stated that
represent a larger proportion of older people. In these trends are likely to change and so this should
England and Wales it is estimated that by 2026 not be seen as the only explanation to account for
there will be over 1.3 million people from BAME lower rates of service use.
groups aged 65+ (compared to over half a million
in 2001); in 2026 almost half a million people from Receipt of palliative and end of life care
BAME groups will be aged 70+. Amongst BAME Disparities and unmet needs when receiving care
groups, the White Irish are expected to have the were also examined, especially issues regarding
highest proportion of people aged 65+ (35.9% communication, end of life decision making and
of its population is expected to be in this age health outcomes (for example, pain). The most
group), followed by the Black Caribbean (13.4%), discussed issue was poor communication between
White Other (10.7%), Indian (10.6%) and Other the healthcare professional and the patient/family.
Asian (9.6%). This was associated with lack of sensitivity to
cultural/religious differences, lack of availability
of translators and low availability of training for
healthcare professionals. Evidence on disparities
on end of life decision making was more common
8Palliative and end of life care for Black, Asian and Minority Ethnic (BAME) groups in the UK
in studies from the United States, with minority studies with underrepresented minority groups
ethnic patients less likely to complete advance (such as White minorities) was also highlighted.
care planning documents and more likely to desire A few authors also described ‘best practices’ and
life-sustaining treatment (such as intubation initiatives to improve care, but it was not always
and artificial feeding) than the majority White reported how beneficial these were to patients
population. The impact of mistrust (due to and families. These practices were usually based
experiences of discrimination and poor access in locations with a large number of people from
to care) and the possible influence of religion on BAME groups instead of being part of a wider
decisions were also emphasised. Many stated national initiative.
that advance care planning is guided by Western
values of autonomy and self-determination which
are not applicable to several populations with a Where do we go from here?
collective approach to decision making. Finally,
some disparities regarding health outcomes Current evidence shows that, overall, palliative
were reported, such as worse pain outcomes and end of life care provision for BAME groups
for minority ethnic groups (mostly in the United is often inadequate. Demographic data tell us
States), differences in place of death (with minority that the number of people from BAME groups
ethnic groups dying at home less often); and less will increase, and a substantial number of them
satisfaction with the care received. will be older people who might need care. This
raises questions on how care, which is currently
reported as inadequate, will meet the needs of
Recommendations on how to even larger numbers of people, including those
improve care for BAME groups usually not represented in research, for example
the White Irish (with one-third of their population
The reviews presented several recommendations already over the age of 65) and the Gypsy and Irish
on how to improve care; these are summarised Traveller communities. Almost 900,000 people in
in this publication and include addressing social the UK either cannot speak English well or cannot
inequities in healthcare as a whole, involving speak it at all. It is likely that there are older people
BAME groups when developing new policies, amongst them and evidence shows that there
providing palliative care for non-cancer patients, is a lack of (or inadequate) translation services.
and improving ethnic monitoring nationwide. Examples of best practice are understandably
Authors emphasised the importance of cultural localised in areas with more ethnic diversity.
competency and communication skills training However, this raises questions about whether
for healthcare professionals. Being sensitive minority ethnic groups living in less diverse areas
and developing open, two-way conversations would benefit from good practice shown to be
with patients and families was also encouraged. working elsewhere. About two-thirds of the
Authors warned against assumptions about how population in England reported having a religion,
patients behave (or should behave). Authors and it is likely that a number of them would have
suggested that strategies to reach BAME groups specific requirements at the end of life (which
should involve the BAME communities and currently are not always met).
encouraged the recruitment of people from BAME
groups. Authors advised researchers to assess With all these issues and challenges in mind,
if interventions which aim to improve care for we suggest studying the recommendations
BAME groups actually work/make a difference to developed by authors and summarised in this
patients and families and also to evaluate the care publication to then plan care for BAME groups in
currently being provided to BAME groups. Authors the future. We also recommend the development
recommended the use of different research of a national initiative to fund studies assessing
methods (for example analysing patients over time the effectiveness of interventions designed to
instead of only analysing data records) and the improve care for BAME groups (or, in other words,
use of standardised tools/measures. The need to assessing how beneficial they are to patients and
better record/report ethnicity and develop more families) and wide dissemination of results from
9Palliative and end of life care for Black, Asian and Minority Ethnic (BAME) groups in the UK
these studies. It is important that those involved these can be disseminated and adapted to other
with care make the most of the demographic populations. Finally, research needs a stronger
information available for free from national focus on assessing health outcomes for BAME
statistical bodies (especially data from the 2011 patients and family caregivers. This should be done
Census) to understand better the demographic in collaboration with both policy and practice.
profile of their local population. We also Researchers should analyse data from the 2011
recommend the systematic, organised examination Census further and develop new population
of practices which seem to be effective so projections with the most recent data available.
10Palliative and end of life care for Black, Asian and Minority Ethnic (BAME) groups in the UK
1. Introduction
We emerge deserving of little credit; we life, specifically, the growing numbers of older
who are capable of ignoring the conditions members from Black, Asian and Minority Ethnic
that make muted people suffer. The (BAME) groups living with and dying from cancer
dissatisfied dead cannot noise abroad the and other life limiting conditions including heart
negligence they have experienced1. failure and dementia. This represents a critical time
in their lives when there is no second opportunity
Nearly forty years ago the medical doctor, John to redress failings in care to them or their families.
Hinton, drew attention to the deficiencies that
were evident in the care offered to many patients The National End of Life Care Strategy recognises
with advanced disease, and their families. While that high quality care should be provided for all
we have witnessed a growing understanding of people approaching the end of life, ‘irrespective
the palliative care needs of patients and their of age, gender, ethnicity, religious belief, disability,
families and an acceptance that death is universal, sexual orientation, diagnosis or socioeconomic
which makes it a universal public health concern, status’9. It adopts a pathways approach (Figure A1
the actual provision of care at the end of life is in the Appendix) focusing on addressing the needs
still not always adequate. In recent years, both in of the individual, with an open communication and
the United Kingdom and elsewhere, questions are assessment of needs and preferences. The Strategy
being asked about how much palliative care we acknowledges, however, that although much has
need, from whom, where, and at what cost, given been achieved in the past few years, there is still
that accessible and good quality care towards the much to be done in order to address inequities in
end of life must be recognised as a basic human the care provided at the end of life10.
right to all those who can benefit from it2, 3:
Everyone has the right to (…) security 1.1 Differences that
in the event of sickness, disability, make a difference
widowhood, old age or other lack of
livelihood in circumstances beyond his Throughout human history, individuals, families,
[or her] control and groups have emigrated from their native
homes to other places globally for many reasons:
(Article 25, United Nations Universal the prospect of education, economic, or social
Declaration of Human Rights 2001) advantage; the need to escape war, political
torture or other conflicts; or the desire to reunite
Treating people equally and promoting dignity with other family members. In 2005 alone, there
and respect are the key principles contained were an estimated 191 million immigrants across
within this declaration. Since its introduction, all the globe: approximately 64 million of these
new legislation must comply with its principles. immigrants arrived in Europe and 44 million
In recent years human rights in health and social in North America, a tripling of the immigrant
care services have been given more attention4 populations in these regions compared to twenty
and extended to many groups in society. A Joint years earlier11. This trend is expected to continue
Committee on Human Rights (appointed by the to increase12. In Europe, the first decade of the
Houses of Lords and Commons to consider matters 21st century has seen large waves of migration
relating to human rights in the UK) has reported from both within and outside Europe. The number
on people with disabilities5, people with learning of European citizens migrating to a Member
disabilities6, on children7, and older people8. To State other than their own country of citizenship
date, however, this interest in ensuring that human increased on average by 12% per year during the
rights extend to all sectors of society has not period 2002–0813. Spain, Germany and the United
given enough attention to those at the end of Kingdom were the European countries with the
11Palliative and end of life care for Black, Asian and Minority Ethnic (BAME) groups in the UK
highest immigration, receiving more than half of end of life care in particular24–26, where there is
all immigrants in 200813. Diversity is therefore a growing evidence that we are not all equal in
reality, with an increased proportion of people not death. As cancer and chronic conditions affect
living within their own native country or culture14. more and more people from different ethnic
and cultural backgrounds27 it is important to
Ethnicity is a commonly used term when referring understand how services best serve all people,
to social diversity; it is also a concept surrounded and whether (and how), outcomes of care may
by enormous controversy and confusion (Box 1). vary. Robust and relevant intelligence is critical,
Ethnicity is a ‘multi-faceted and changing particularly as growing evidence suggests that a
phenomenon’ that may reflect a combination significant number of people living with advanced
of a number of features including country of disease miss out on palliative care and end of
birth, nationality, language spoken at home, life care28, 29. For example, older patients30–33, the
ancestral country of birth, skin colour, national or poor26, 34–36, and specifically those from BAME
geographical origin, racial group and religion15. communities37, are less likely than younger
patients, White patients, and more affluent groups
Ethnic minority health is increasingly recognised to use appropriate specialist services including
as a crucial ‘tracer’ for measuring the success in inpatient hospices. This situation exists in the
achieving health and patient preferred outcomes UK despite palliative care being free at the point
for the population in general23, and for palliative/ of delivery from the NHS and the independent
Box 1 – Conceptual confusion and the language of diversity
Race, ethnicity and culture have the potential preference is to permit the self-assessment
to be presented as explosive concepts15. All of ethnicity19. Amongst other factors, culture
these terms have been used to explain patterns underpins our ethnic identity. This too is a
of disease, illness experiences, responses to complex and problematic social concept with
treatment, and the use of services. However, several definitions. Culture is a patterned
confusion is still common. Firstly, researchers behavioural response that develops over time as
rarely define the terms they use12. Secondly, a result of imprints on the mind through social,
over the years, all terms have been used religious, intellectual and artistic structures20.
interchangeably, have been subject to misuse, From this definition culture can be seen as a
or combined with other social metrics, for ‘recipe’ for living in the world21. However, this is
example social class or education16. Race can be a limited understanding of culture that, if used
understood as the classification of people on the here, risks minimising discussions of cultural
basis of their physical appearance – with skin aspects of palliative and end of life care to
colour the most popular characteristic17. In the lists of beliefs and practices from a range of
past it has also been used as a way of dividing so-called ‘cultural’ groups. This has also been
humankind which has denoted inferiority referred to as the ‘fact-file’ or ‘checklist’22
and superiority, linked to subordination and approach that, while informative in interpreting
domination18. Ethnicity, sometimes employed behaviours, symbols, rituals, and other cultural
as a softer synonym for race, can be defined practices of certain ethnic or religious groups
as: Shared origins or social backgrounds; shared that may be important and meaningful at
culture and traditions that are distinctive, the end of life, runs the risk of encouraging
maintained between generations, and lead to generalisations about individuals and groups
a sense of identity and group; and a common based on cultural identity. This in turn may
language or religious tradition19. then lead to the development of stereotypes,
prejudices, and misunderstandings.
Ethnicity is fluid and depends greatly on context.
For practical and theoretical reasons, the current
12Palliative and end of life care for Black, Asian and Minority Ethnic (BAME) groups in the UK
charitable sector.
In this report we aim, firstly, to present key
intelligence on the current demographic profile
of BAME populations living in the UK according
to the most up-to-date estimates from the 2011
Census. We also aim to examine and appraise
demographic projections for BAME populations
in the UK, the implications of which deserve
attention. Secondly, we aim to identify and
appraise evidence from literature reviews to
describe the current state of palliative and end of
life care provision for BAME populations living in
the UK and in other English-speaking countries.
We will report on unmet needs and inequalities in
access to relevant service provision, and present
recommended practices and measures to reduce
inequalities and deliver high quality care.
13Palliative and end of life care for Black, Asian and Minority Ethnic (BAME) groups in the UK
2. Methods
This Section summarises the methodology applied in Table A3 in the Appendix). We show the most
to two distinct components of our work: the recent estimates on usual residents born outside
demographic data and population projections the UK (for all the UK countries), their age and year
(shown in Section 3) and the review on the current of arrival to the UK (England and Wales) and the
state of palliative and end of life care provision for ten most common countries of birth in 2001 (for
BAME populations (shown in Section 4). Table A2 England, Wales and Northern Ireland) and 2011
in the Appendix defines some of the terms used (for all the UK countries).
throughout the report.
The UK Census started requesting information
about ethnicity in 1991 (in Northern Ireland
2.1 Analysis of socio-demographic the question was introduced in 200143); ethnic
data and projections categories and instructions on how to answer the
question have been evolving since then (Table 1).
In Section 3 we present socio-demographic data We provide ethnicity data from 2001 and 2011 for
available free of charge from the Office for National the UK countries on a separate basis and also an
Statistics (ONS), Northern Ireland Statistics and additional analysis of all ethnic groups in England
Research Agency (NISRA) and National Records and Wales combined since 1991. Throughout the
of Scotland (NRS), formerly the General Register report we use the term BAME as any ethnic group
Office for Scotland (GROS). We focus on data from other than White British; we also use the term
the National Censuses (1991, 2001 and 2011), but ‘minority ethnic group’ when describing data from
also present statistics from the Annual Population countries other than the UK (Sections 4 and 5).
Surveys (APS) and the Labour Force Surveys (LFS)
when Census data are not yet available (this is the Ethnicity data from 2001 and 2011 in England
case for Scotland)38. Census data are shown for and Wales are broadly comparable, but there are
usual residents and households, excluding visitors some compatibility issues. Gypsy or Irish Traveller
or short-term residents (those living in the UK for and Arab categories were only available in 2011.
less than 12 months)39. In 2001, it is possible that the former might have
identified themselves with any of the other available
Key characteristics including ethnic group, religion White categories, while the latter seem to have
and language all help to provide a more detailed chosen one of the Other categories39. The Chinese
picture of social diversity in the UK40. We present category was repositioned from the main category
demographics on ethnicity, religion and main Other to the Asian/Asian British category in 2011.
spoken languages. We show the age composition As a consequence there was a loss of comparability
for the English and Welsh population according to between 2001 and 2011 for the categories Chinese,
ethnicity (estimates are not available for Scotland Other Asian, the Asian main category and Any other
and Northern Ireland). Importantly, these are ethnic group. The repositioning might also have
experimental statistics developed by the ONS from had an impact on responses to the White and Asian
mid-2001 up to mid-2009 and should be viewed category (part of Mixed/multiple ethnic groups)39.
with caution41, 42. Their estimates are shown by Ethnicity data from 2001 and 2011 in Northern
ethnic categories adopted by the 2001 Census; Ireland are fully comparable44, while ethnicity
Census 2011 tables on ethnicity and age are not data from 2011 are not yet available for Scotland
yet available. (Census questions for both countries are available in
Table A4 in the Appendix).
This report also presents 2011 data on ‘English
proficiency’ for England, Wales and Northern The Census question on religion was introduced
Ireland (a question of how well one speaks English in 2001 (shown in Tables A5, A6 and A7 in the
when this is not their native language – shown Appendix) and it is not mandatory. The question is
14Palliative and end of life care for Black, Asian and Minority Ethnic (BAME) groups in the UK
about religious affiliation; the ONS highlights that In addition to current and previous demographic
there are other aspects of religion such as religious profiles of BAME groups in the UK we also report
belief, religious practice or belonging which are on the most recent UK population projections.
not covered in their analysis40. We present data We searched the databases MEDLINE, PsycINFO,
from 2001 and 2011 (except for Scotland as only EMBASE and Social Policy and Practice for
2001 data were available). There were changes all original publications reporting on national
from 2001 to 2011 in terms of instructions on population projections which included estimates
how to answer the question. In England and Wales for BAME populations in at least one of the
it is possible that some people may have ticked UK countries. A time frame of five years (from
more than one answer in 2011 (but data remain 2008 onwards) was considered adequate
comparable)39, 44.
Table 1 – Census questions on ethnicity for England and Wales
Census 1991 Census 2001 Census 2011
Ethnic group What is your ethnic group? What is your ethnic group?
Please tick the appropriate box: Choose ONE Section from A to E, Choose one Section from A to E, then tick
White c then 3 the appropriate box to indicate your one box to best describe your ethnic group
cultural background. or background.
Black-Caribbean c
A White A White
Black-African c
c British c English/Welsh/Scottish/
Black-Other c
c Irish Northern Irish/British1
please describe
c Any other White background, c Irish
___________________________________
please write in c Gypsy or Irish Traveller
Indian c
___________________________________ c Any other White background, write in
Pakistani c
B Mixed ___________________________________
Bangladeshi c
c White and Black Caribbean B Mixed/multiple ethnic groups
Chinese c
c White and Black African c White and Black Caribbean
Any other group c
c White and Asian c White and Black African
please describe
c Any other Mixed background, c White and Asian
___________________________________
please write in c Any other Mixed/multiple ethnic
If you are descended from more than one background, write in
ethnic or racial group, please tick the group ___________________________________
___________________________________
to which you consider you belong, or tick the C Asian or Asian British
‘Any other ethnic group’ box and describe C Asian/Asian British
c Indian
your ancestry in the space provided. c Indian
c Pakistani
c Pakistani
c Bangladeshi
c Bangladeshi
c Any other Asian background,
c Chinese
please write in
c Any other Asian background, write in
___________________________________
___________________________________
D Black or Black British
D Black/African/Caribbean/Black British
c Caribbean
c African
c African
c Caribbean
c Any other Black background,
c Any other Black / African / Caribbean
please write in
background, write in
___________________________________
___________________________________
E Chinese or other ethnic group
E Other ethnic group
c Chinese
c Arab
c Any other, please write in
c Any other ethnic group, write in
___________________________________
___________________________________
1
In Wales, ‘Welsh’ is shown before ‘English’. Sources: original Census questionnaires available from: www.ons.gov.uk/ons/guide-method/census/census-2001/about-census-2001/census-
2001-forms/index.html and www.ons.gov.uk/ons/guide-method/census/2011/index.htm
15Palliative and end of life care for Black, Asian and Minority Ethnic (BAME) groups in the UK
since we were only interested in projections of life care provision for minority ethnic groups
adopting more recent population estimates. We (living in the UK and other English-speaking
found three different publications which are countries), reporting on unmet needs and
described in Section 3. One refers to population disparities in access or service provision, and/
projections for England and Wales published by or presenting evidence based recommendations,
Runnymede and the Centre for Policy on Ageing45 successful practices and measures used to reduce
(described by the author as both provisional and disparities for these populations. We also aimed
experimental), focusing on their projections up to use available evidence to recommend areas for
to the year 2026. The other two projections were further research and service delivery in order to
published by Wohland et al46 (also described by better meet the needs for BAME populations. We
authors as provisional and experimental), and by report on the original minority ethnic categories
Coleman47. We present the projections published as mentioned by authors in each review, therefore
by Runnymede and the Centre for Policy on Ageing inconsistencies regarding terminology are possible.
into more detail because they focused on the
ageing of BAME groups, which is most relevant Throughout the report we use the terms ‘palliative’
for this report. However, it is important to note and ‘end of life care’ together since we did not
that these projections were based on experimental wish to focus only on people at the end of life.
statistics on ethnic group and age published by We sometimes use the term ‘hospice’ when this
the ONS41, which might affect their accuracy. was mentioned in the reviews. In the UK this
might refer to palliative care provided in inpatient
Population projections require robust data on hospices, other institutional settings and at home.
migration, mortality and fertility. However, data However, in the United States of America (USA)
sources are limited and usually based on the palliative care and hospice care have a different
population’s country of birth (case of both birth meaning. Palliative care may be provided to
and death certificates – affecting estimates for anyone who might benefit from it, regardless of
fertility and mortality); estimates on ethnicity are prognosis. On the other hand, in order to receive
derived from national surveys (which can suffer hospice care the patient must have an expectancy
from sampling errors)48 and Census data (which of six months or less to live (certified by a medical
are only available every ten years). Migration data doctor). Furthermore, in the USA hospice care
have been reported as incomplete and limited47. is usually provided at home51. It is important to
Projections represent an estimation of how the be aware of these differences when analysing
population is likely to be45, they are not forecasts the evidence.
and do not attempt to predict the impact that
future government policies, changing economic Data sources/Search strategy
circumstances or other factors might have on In order to avoid duplicate work and due to a
demographic behaviour49. Therefore, projections restricted time frame to produce this review of
should always be viewed cautiously; estimates evidence we have focused on published reviews
also become considerably less reliable the longer (published in peer reviewed journals and grey
projections go across time49. literature) instead of primary studies. The following
databases were searched from January 1992 to
January 2013: Web of Science with conference
2.2 Identification and appraisal proceedings, Inspec, Journal Citation Reports,
of evidence from reviews MEDLINE, PsycINFO, EMBASE, ASSIA, CINAHL and
Cochrane reviews. We defined a time frame of
In Section 4 we present a review of the current the past 20 years because older studies are highly
state of palliative and end of life care provision likely to be out of date and therefore no longer
for BAME populations; this was informed by relevant for the aims of this review. A search
recommended methodology for undertaking strategy with MESH and free text terms was
systematic reviews published by the Centre adapted from relevant systematic reviews on the
for Reviews and Dissemination50. We aimed to topic25, 28, 52–54. Further information on the searched
identify reviews (systematic and non-systematic) databases and used keywords is available in Table
describing the current state of palliative and end A8 in the Appendix. We also checked the NHS
16Palliative and end of life care for Black, Asian and Minority Ethnic (BAME) groups in the UK
Ethnicity and Health Library using the term ‘end of studies (stage 3) involved discussion with a second
life care’ (no year restriction). The reference lists researcher; any disagreement was solved by
of all included articles were checked for reviews consensus. The bibliographic software EndNote X6
eligible for inclusion. Consultation with an expert was used to manage articles.
also resulted in possible reviews for inclusion
(from peer reviewed journals and grey literature). Data extraction and quality assessment
of included reviews
Selection of reviews/Inclusion and Data from included reviews were extracted by
exclusion criteria one researcher into tables (in Excel 2010 and
General inclusion and exclusion criteria were SPSS 19 for Windows) with categories defined
developed based on the project aims. We focused according to the study aims. A second researcher
on the adult population due to their growing independently checked the extracted data to verify
importance for palliative and end of life care any inconsistencies; disagreements were solved
provision in the current context of the ageing of by consensus.
the UK population. We included reviews reporting
on UK studies and also reviews from other English- Considering individual aspects of methodological
speaking countries (Canada, USA and Australia). quality of studies instead of focusing on quality
When evidence only referred to a specific country scores is recommended when doing quality
we highlighted this in the results. assessment and synthesis of data50. There are
several checklists available which can be used to
We included all reviews reporting on the provision assess quality of reviews. However, most were
of palliative and end of life care for adults developed to assess systematic reviews (which
belonging to one or more minority ethnic group is not the case in many reviews of palliative and
when these reported on unmet needs; and/or end of life care for minority ethnic populations).
disparities in palliative and end of life care. We We used a simple, validated index developed
only included evidence on needs and preferences by Oxman and Guyatt55 to assess the quality of
when these were described in the included review articles (full checklist available in Table
reviews that also reported on either unmet needs A10 in the Appendix). We followed a similar
or disparities. BAME groups did not have to be methodology to the one applied in a recent
the main focus of the reviews; we also included appraisal of UK reviews on end of life care for
broader reviews as long as they analysed minority minority ethnic groups25, assessing only systematic
ethnic groups as a subgroup. We specifically reviews and critical reviews which followed a
excluded reviews focusing on epidemiological data systematic approach. We focused on reporting
only and unmet needs in general (including cancer individual aspects of quality for each review.
treatment when this was not about palliative and Quality of studies was assessed by one reviewer;
end of life care). We also excluded overviews and a second reviewer assessed a random selection of
purely descriptive papers which did not describe included reviews (10%) and disagreements were
themselves as reviews. Full inclusion and exclusion solved by consensus.
criteria are available in Table A9 of the Appendix.
Data analysis and synthesis
Screening references We have used a narrative synthesis approach when
After developing a comprehensive search strategy reporting the findings from the included reviews.
in order not to miss any relevant reviews, we Narrative synthesis relies primarily on the use of
expected to screen a large number of records. words and text to summarise and explain findings;
Therefore, the screening of reviews occurred it uses a textual approach to ‘tell a story’ of the
in three stages: 1) screening titles against the findings56. This is a commonly used approach
inclusion and exclusion criteria to identify when there is considerable heterogeneity in
potentially relevant papers; 2) screening abstracts included studies in terms of methods, participants
of papers identified as possibly relevant from stage and interventions50, 56. The synthesis involved
1; 3) screening full texts of papers identified as the juxtaposition of findings from the included
possibly relevant in stage 2. Stages 1 and 2 were reviews, with an analysis of their common themes
done by a single researcher; the final selection of and findings56.
17Palliative and end of life care for Black, Asian and Minority Ethnic (BAME) groups in the UK
3. Current and projected
profile of BAME groups
in the UK
We start this Section by describing the current population in 2001 to 44.9% in 2011). The increase
demographic profile of all ethnic groups in the in both numbers and proportions of Other White
UK (focusing on BAME groups – all ethnic groups also happened in all regions in England, with the
other than White British), providing data separately highest increase in London (where more than
for England, Wales, Scotland and Northern Ireland. one out of ten people was Other White in 2011).
This is followed by briefly highlighting the While London had the greatest change between
most recent UK population projections for the 2001 and the 2011 Censuses (in terms of
BAME populations. an increase of people from BAME groups and
decrease of the White British population), the
North East had the smallest change (with White
3.1 Current profile in England: British decreasing by 2.8% in proportion and
ethnicity, language, religion, age and other ethnic groups increasing by less than 1%)57.
characteristics of the foreign born Table A12 in the Appendix shows ethnic groups by
English region in 2001 and 2011.
Ethnicity in England
Data from the 2001 and 2011 Censuses show that Distribution of ethnic groups across England is not
England has become more ethnically diverse57, homogeneous, and numbers and proportions for
with an increase in both numbers and proportions each group can differ widely across regions57. The
for all BAME groups from 2001 to 2011 (with the region with the highest number of people from
exception of White Irish). Although most residents BAME groups is London, where in 2011 more than
reported their ethnic group as White British in half (55.1%) of the population was from a BAME
2011, there was a reduction in both numbers group and most ethnic groups represented above
and proportions of people from this group average proportions of the population (Figure 1).
(7.2% reduction in proportion or 467,900 fewer In 2011 the North East was the area with least
residents)58, 59 (Table 2). Box A11 in the Appendix ethnic diversity (93.6% of the population identified
has ethnicity data from 1991 for England and themselves as White British)59.
Wales (shown together); it shows a substantial
increase in ethnic diversity in the past 20 years. Differences across local authorities are even more
pronounced. The ONS reported that the local
In 2011 Other White was the second largest ethnic authorities with the highest percentage of White
group in England (almost 2.5 million people or British were in the North East and North West;
4.6% of the population, an increase of more than these were Redcar & Cleveland and Allerdale with
one million people since 2001), followed by Indian 97.6% of their population being White British. In
(almost 1.4 million people or 2.6%) and Pakistani contrast, 16.7% of the population in Newham
(1.1 million or 2.1%). In 2011, all BAME groups and 18.0% in Brent (both London boroughs)
accounted for a fifth (20.3%) of the population in were White British57. This highlights the fact that
England (10.7 million residents) (Table 2). in some areas BAME groups are the substantial
majority of the population. The ONS website
The decrease in the proportion of White British has developed a key statistics interface in which
happened in all regions in England, with the ethnicity (and other characteristics such as religion
highest decrease in London (from 59.8% of the and country of birth) can be checked according
18Palliative and end of life care for Black, Asian and Minority Ethnic (BAME) groups in the UK
Table 2 – Population by ethnic group in England in 2001 and 2011
Main groups Subgroups 2001 2011
Number (%) Number (%)
White1 English/Welsh/Scottish/Northern Irish/British 42,747,136 (87.0) 42,279,236 (79.8)
Irish 624,115 (1.3) 517,001 (1.0)
Gypsy or Irish Traveller N/A 54,895 (0.1)
Other White 1,308,110 (2.7) 2,430,010 (4.6)
Mixed/multiple ethnic groups White and Black Caribbean 231,424 (0.5) 415,616 (0.8)
White and Black African 76,498 (0.2) 161,550 (0.3)
White and Asian 184,014 (0.4) 332,708 (0.6)
Other Mixed 151,437 (0.3) 283,005 (0.5)
Asian/Asian British Indian 1,028,546 (2.1) 1,395,702 (2.6)
Pakistani 706,539 (1.4) 1,112,282 (2.1)
Bangladeshi 275,394 (0.6) 436,514 (0.8)
Chinese 220,681 (0.4) 379,503 (0.7)
Other Asian 237,810 (0.5) 819,402 (1.5)
Black/African/Caribbean/Black British African 475,938 (1.0) 977,741 (1.8)
Caribbean 561,246 (1.1) 591,016 (1.1)
Other Black 95,324 (0.2) 277,857 (0.5)
Other Arab N/A 220,985 (0.4)
Any other ethnic group 214,619 (0.4) 327,433 (0.6)
Total All ethnic groups 49,138,831 (100) 53,012,456 (100)
1
Ethnic groups are the ones used by the 2011 Census. Comparison between Censuses is limited (see methods Section). Sources: Office for National Statistics (2003). Table KS06: Ethnic
group. Office for National Statistics (2012). Table KS201EW. Ethnic group
to local authorities in England and Wales (http:// The highest increase in numbers occurred amongst
www.ons.gov.uk/ons/guide-method/census/2011/ the White British (over 415,000 additional people
census-data/index.html). aged 65+ from 2001 to 2009). However, the
proportion of older White British has decreased
Age distribution of the BAME groups since 2002 (from 93.3% of the population aged
in England 65+ in 2001 to 91.6% in 2009).60, 61
Census 2011 data on ethnic groups broken down by
age had not been made available at the time of this About a third (32.5%) of the White Irish population
publication. Estimates published by the ONS41 using was aged 65+ in 2009 (the highest proportion
ethnic categories from the 2001 Census show across all ethnic groups); this is followed by the
that BAME groups are usually younger than the White British (18.0%) and the Black Caribbean
overall population, except for the White Irish. Over (13.8%).60 Table A13 in the Appendix shows the
8.4 million people were estimated to be aged 65+ complete age distribution for White British and
in mid-2009, most of them (91.6% or 7.7 million BAME groups in mid-2009.
people) were White British, the remaining 707,300
people aged 65+ belonged to a BAME group60. Table A14 in the Appendix shows the estimated
population aged 65+ (men) and 60+ (women) by
Estimates show an increase in the number of ethnic group and English regions in mid-2009.
people aged 65+ in England across all BAME It shows that London had the highest number
groups from mid-2001 to mid-2009 (Figure 2)60, 61. of older people across all BAME groups. For
The highest increase in percentage occurred example, over half of older Black African and Black
for the Other ethnic group (130% increase from Caribbean, almost half of older Bangladeshi, Other
6.3 thousand to 14.5 thousand people), Black Asian and Other Black and four out of ten older
African (111% increase from 10.9 to 23.0 thousand Indian lived in London62. Amongst non-White
people) and the Chinese (76.5% increase from BAME groups, East Midlands, West Midlands and
11.5 to 20.3 thousand people) categories. the South East together accounted for almost four
19Palliative and end of life care for Black, Asian and Minority Ethnic (BAME) groups in the UK
Figure 1 – Proportion of main ethnic groups across English regions in 2011
White (dotted for White British) Asian/Asian British Black/African/Caribbean/Black British Mixed/multiple ethnic groups Other
100.0%
2.9% 2.0%
1.7% 6.2% 4.8% 5.0% 5.2% 3.6%
7.3% 6.5%
3.1% 7.8%
3.0% 3.9% 10.8% 5.5% 5.4%
13.3%
5.7%
3.6%
75.0%
18.5%
14.9%
50.0%
93.6% 91.8%
87.1% 85.5% 85.4% 79.2% 85.3% 85.2%
79.8%
25.0% 44.9%
0.0%
North North Yorkshire East West East London South South All
East West & Humber Midlands Midlands East West England
Source: Office for National Statistics (2012). Table KS201EW. Ethnic group, local authorities in England and Wales.
Figure 2 – Estimated number of people aged 65+ from BAME groups in England (in thousands)
65+ in mid-2001 65+ in mid-2009
156.8
White Irish
181.4
135.0
Other White
165.9
5.4
Mixed White and Black Caribbean
6.1
1.7
Mixed White and Black African
2.6
6.5
Mixed White and Asian
9.0
5.3
Other Mixed
7.3
69.0
Asian or Asian British: Indian
106.1
30.0
Asian or Asian British: Pakistani
45.9
9.2
Asian or Asian British: Bangladeshi
16.5
12.6
Asian or Asian British: Other Asian
21.0
Black or Black British: Black Caribbean 60.7
83.9
Black or Black British: Black African 10.9
23.0
Black or Black British: Other Black 3.0
4.3
Chinese 11.5
20.3
Other ethnic group 6.3
14.5
0 50 100 150 200
Sources: Office for National Statistics (2011). Table EE4: Estimated resident population by ethnic group, age and sex, mid-2001. Rel. 8.0 Table EE4: Estimated resident population by ethnic
group, age and sex, mid-2009. Rel. 8.0.
20Palliative and end of life care for Black, Asian and Minority Ethnic (BAME) groups in the UK
out of ten older Indian, while the West Midlands, population) and highest proportion of all other
Yorkshire & the Humber and the North West main religions (except Sikh which showed the
together accounted for half of all older Pakistani62. highest proportion in the West Midlands)40. Table
A15 in the Appendix shows data on religion by
Religion in England English regions. The South West had the highest
Census data show that in 2011 the majority of the proportion of people reporting no religion (29.3%
population in England (59.4% or over 31 million of the population), while the North East and the
people) reported being Christian, but numbers and North West reported the highest proportion of
proportions have fallen since the question was Christians (about two thirds of the population in
introduced in the 2001 Census (when proportion both regions)40. Also similar to trends in ethnicity,
was 71.7% of the population, or over 35 million certain religious groups tend to concentrate in
people)58, 63 (Figure 3). Muslims were the second particular areas. Examples are the concentration
largest religious group in 2011 (with almost of Muslims in London, Bradford, Luton, Slough
2.7 million people or 5.0% of the population – and Birmingham; Hindus in London and Leicester;
an increase from 2001 when they represented Buddhists and Jewish people in London40.
3.1%)40, 64. There was an increase in numbers for all
other main religions in England from 2001 to 2011, Language in England
but there was also a substantial increase in the Over 90% of the population in England had
numbers and proportion of people who reported English as their main language in 2011. The second
having no religion (from 14.6% in 2001 to a most spoken language was Polish (1% of residents
quarter of the population in 2011 – over 13 million or over half a million people) (Box 2). Panjabi was
people). Both in 2001 and 2011 almost four million the third most spoken language, followed by other
residents did not answer the voluntary question on South Asian languages: Urdu (fourth), Bengali
religion (numbers not shown in Figure 3)40, 64. (fifth) and Gujarati (sixth)65.
Similar to trends in ethnicity, London was the most The majority of residents who did not possess
diverse area regarding religion in 2011, having the English as their principle language in 2011 could
lowest proportion of Christians (under half of the either speak it well or very well (79.2% of them
Figure 3 – Religion in England in 2001 and 2011
2001 2011
35,251,244
Christian
31,479,876
1,524,887
Muslim
2,660,116
546,982
Hindu
806,199
327,343
Sikh
420,196
257,671
Jewish
261,282
139,046
Buddhist
238,626
143,811
Other religion
227,825
7,171,332
No religion
13,114,232
0 20,000,000 40,000,000
Source: Office for National Statistics (2013). 2001–2011 Census comparator tool. Key statistics interface v2.5
21You can also read