ADVANCING DIVERSITY AND INCLUSION IN HIGHER EDUCATION - KEY DATA HIGHLIGHTS FOCUSING ON RACE AND ETHNICITY AND PROMISING PRACTICES
←
→
Page content transcription
If your browser does not render page correctly, please read the page content below
ADVANCING DIVERSITY
AND INCLUSION IN
HIGHER EDUCATION
KEY DATA HIGHLIGHTS FOCUSING
ON RACE AND ETHNICITY AND
PROMISING PRACTICES

Advancing Diversity and Inclusion in
Higher Education
Key Data Highlights Focusing on Race and Ethnicity and Promising
Practices

                             November 2016

           Office of Planning, Evaluation and Policy Development
                        Office of the Under Secretary
                        U.S. Department of Education
The U.S. Department of Education does not mandate or prescribe practices, models, or other activities in this report. This report contains examples of, adaptations of, and links to resources created and maintained by other public and private organizations. This information, informed by research and gathered in part from practitioners, is provided for the reader’s convenience and is included here to offer examples of the many resources that educators, parents, advocates, administrators, and other concerned parties may find helpful and use at their discretion. The U.S. Department of Education does not control or guarantee the accuracy, relevance, timeliness, or completeness of this outside information. Further, the inclusion of links to items and examples does not reflect their importance, nor are they intended to represent or be an endorsement by the U.S. Department of Education of any views expressed, or materials provided. U.S. Department of Education John B. King, Jr. Secretary Office of the Under Secretary Ted Mitchell Under Secretary Office of Planning, Evaluation and Policy Development Amy McIntosh Delegated Duties of Assistant Secretary Policy and Program Studies Service Jennifer Bell-Ellwanger Director November 2016 This report is in the public domain. Authorization to reproduce it in whole or in part is granted. While permission to reprint this publication is not necessary, the citation should be U.S. Department of Education, Office of Planning, Evaluation and Policy Development and Office of the Under Secretary, Advancing Diversity and Inclusion in Higher Education, Washington, D.C., 2016. This report is available at http://www2.ed.gov/rschstat/research/pubs/advancing-diversity-inclusion.pdf. Availability of Alternate Formats On request, this publication is available in alternate formats, such as Braille, large print or compact disk. For more information, contact the Department’s Alternate Format Center at 202-260-0852 or the 504 coordinator via email at OM_eeos@ed.gov. Notice to Limited English Proficient Persons If you have difficulty understanding English you may request language assistance services free of charge for Department information that is available to the public. If you need more information about these interpretation or translation services, please call 1-800-USA-LEARN (1-800-872-5327), (TTY: 1-800-437-0833), or e-mail us at ed.language.assistance@ed.gov, or write to the U.S. Department of Education, Information Resource Center, 400 Maryland Ave. SW, Washington, DC 20202.
Contents

List of Exhibits...................................................................................................................................iv
Acknowledgments ........................................................................................................................... vii
Executive Summary............................................................................................................................1
I. Introduction....................................................................................................................................5
II. Setting the Context: A Snapshot of Opportunity Gaps in Postsecondary Education.........................10
   A.     Trends in Educational Degree Attainment and Social Mobility ......................................................................10
   B.     Gaps in College Opportunity ..........................................................................................................................14
III. The Higher Education Pipeline for Underrepresented Students of Color ........................................19
   A.     Access: Applications, Admissions, and Enrollment ........................................................................................19
   B.     Student Success: Persistence, Completion, and Degree Attainment .............................................................24
   C.     Smaller Populations of Students of Color .......................................................................................................29
   D.     Multiple Dimensions of Gaps in College Opportunity ....................................................................................32
IV. Promoting Higher Education Access and Inclusion for All Students: Leadership Examples ............. 35
V. Conclusion ...................................................................................................................................46
Appendix A: Supplemental Charts ....................................................................................................49
   Opportunity Gaps in Postsecondary Education ......................................................................................................49
   The Higher Education Pipeline ................................................................................................................................54
Appendix B: Academic Level of Degrees Conferred to Students of Color ............................................71
Appendix C: Faculty Diversity ...........................................................................................................73
Appendix D: Postsecondary Data on Equity and Student Success .......................................................75
Appendix E: Office of Management and Budget (OMB) Definitions of Race and Ethnicity Categories .. 76
Endnotes .........................................................................................................................................77

                                                                               iii
List of Exhibits
Exhibit 1.1: Percentage of U.S. residents 25 years and older attaining a bachelor’s degree
or higher, by race and ethnicity: From 1964 through 2014........................................................................ 12
Exhibit 1.2: Total money earnings for U.S. residents 18 years and older, by race and ethnicity
and educational attainment: 2014 ............................................................................................................. 13
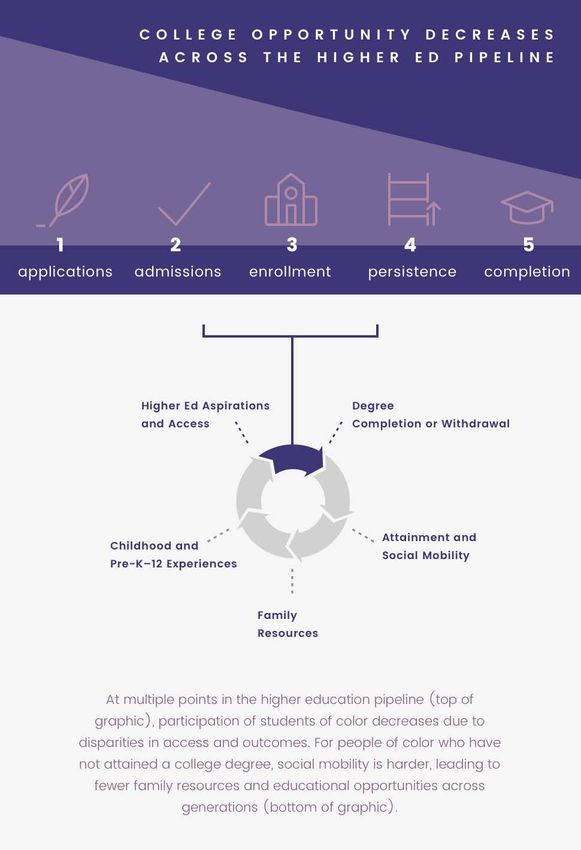
Exhibit 2.1: College opportunities and social mobility decrease at five points along the
higher education pipeline for students of color ......................................................................................... 16
Exhibit 3.1: Percentage of high school graduates enrolled in postsecondary institutions,
by race and ethnicity and institution type: Fall 2013 ................................................................................. 20
Exhibit 3.2: Percentage of U.S. undergraduates enrolled in postsecondary institutions,
by race and ethnicity: Selected years from 1980 through 2014................................................................. 23
Exhibit 4.1: Percentage of first-time, full-time U.S. students graduating with a bachelor’s degree
within six years of enrollment, by race and ethnicity and sex: 2007–08 through 2013–14....................... 25
Exhibit 4.2: Percentage of first-time, full-time U.S. students graduating with a bachelor’s degree
within six years, by race and ethnicity and institution control: From 2007–08 through 2013–14 ............ 26
Exhibit 4.3: Percentage degree attainment of U.S. students within six years of entering postsecondary
programs, by race and ethnicity and institution type: From 2003–04 through 2008–09 .......................... 28
Exhibit 5.1: Percentage bachelor’s degree attainment of students within six years of postsecondary
enrollment, by race and ethnicity and family income quartile: From 2003–04
through 2008–09 ........................................................................................................................................ 33
Exhibit 5.2: Total annual salary of bachelor’s degree recipients four years after graduation,
by race and ethnicity and family income: 2012 .......................................................................................... 34
Appendix A: Supplemental Charts
Exhibit A.1: Percentage of U.S. population, by race and ethnicity: Decades from 1960 to 2010 .............. 49
Exhibit A.2: Percentage of U.S. population, by age group and race and ethnicity: 2014 ........................... 50
Exhibit A.3: Percentage of U.S. residents 25 years and older attaining a high school diploma,
by race and ethnicity, and gap between blacks and whites and Hispanics and whites 25 years
and older attaining a high school diploma: Decades from 1964 to 2014 ................................................... 50
Exhibit A.4: Percentage of U.S. residents from 25–29 years old attaining a high school diploma,
by race and ethnicity, and gap between blacks and whites and Hispanics and whites from
25–29 years old attaining a high school diploma: Decades from 1964 to 2014......................................... 51
ivExhibit A.5: Percentage of U.S. residents 25–29 years old attaining a bachelor’s degree, by race and
ethnicity, and gaps between blacks and whites and Hispanics and whites from 25–29 years old
attaining a bachelor’s degree: Decades from 1964 to 2014 ....................................................................... 51
Exhibit A.6: Percentage point attainment gap between blacks and whites and Hispanics and whites
25 years and older earning a bachelor’s degree: Decades from 1964 to 2014 .......................................... 52
Exhibit A.7: Family socioeconomic status in quintiles of U.S. high school student freshmen,
by race and ethnicity: 2009–10................................................................................................................... 53
Exhibit A.8: Parental education of U.S. high school student freshmen, by race and ethnicity:
2009–10 ...................................................................................................................................................... 53
Exhibit A.9: Postsecondary enrollment percentages at four-year and less than four-year institutions
among 2013 U.S. high school graduates, and percentages of graduates not enrolled in postsecondary
education, by family socioeconomic status in quintiles: Fall 2013............................................................. 54
Exhibit A.10: Postsecondary enrollment percentages at four-year and less than four-year institutions
among 2013 U.S. high school graduates, and percentages of graduates not enrolled in postsecondary
education, by parental educational attainment: Fall 2013 ........................................................................ 54
Exhibit A.11: Percentage of 2013 U.S. high school graduates enrolled in postsecondary education,
by race and ethnicity and selectivity of institution: Fall 2013 .................................................................... 55
Exhibit A.12: Percentage of expected family contribution for U.S. undergraduate students,
by race and ethnicity and level of contribution: Fall 2012 ......................................................................... 55
Exhibit A.13: Percentage of U.S. postbaccalaureate students, by race and ethnicity:
Selected years from 1980 to 2014 .............................................................................................................. 56
Exhibit A.14: Percentage of U.S. undergraduate students, by race and ethnicity, level of institution,
and control of institution: 2014–15 ............................................................................................................ 57
Exhibit A.15: Age of entering U.S. undergraduates at degree-granting postsecondary institutions,
by race and ethnicity: Fall 2011 .................................................................................................................. 57
Exhibit A.16: Percentage graduation rate within six years for first-time, full-time students seeking a
bachelor’s degree, by race and ethnicity, and the graduation rate gap between black and white
students and Hispanic and white students, by Carnegie selectivity of the postsecondary institution:
2013–14 ...................................................................................................................................................... 57
Exhibit A.17: Number of first-time, full-time students seeking a bachelor’s degree and the percentage
graduating within six years, by race and ethnicity, sex, institution control, and Carnegie selectivity
of institution: From 2007–08 through 2013–14 ......................................................................................... 58
vExhibit A.18: Percentage of students attaining degrees within four years of postsecondary enrollment,
by race and ethnicity and type of degree: From 2003–04 through 2006–07 ............................................. 67
Exhibit A.19: Percentage of students attaining degrees within six years of postsecondary enrollment,
by type of degree, and income quartile of parents: From 2003–04 through 2008–09 .............................. 67
Exhibit A.20: Percentage of students attaining degrees within six years of postsecondary
enrollment, by degree type and parental education: From 2003–04 through 2008–09 ........................... 68
Exhibit A.21: Number of degrees awarded, by race and ethnicity and degree type: 2013–14.................. 68
Exhibit A.22: Percentage of degrees awarded, by race and ethnicity and degree type: 2013–14............. 68
Exhibit A.23: Percentage graduation rates for first-time, full-time, bachelor’s degree-seeking U.S.
students six years after initial postsecondary enrollment, by categories of small populations of
students of color and sex, and graduation rate gaps between each small population and whites and
Asians: 2013-14 ........................................................................................................................................... 69
Exhibit A.24: Percentage graduation rates for first-time, full-time, bachelor’s degree-seeking U.S.
students six years after initial postsecondary enrollment, by race and ethnicity and parental education:
From 2003–04 through 2008–09 ................................................................................................................ 69
Exhibit A.25: Total annual salary of bachelor’s degree recipients four years after graduation,
by race and ethnicity and parental education: 2012 .................................................................................. 70
Appendix B: Academic Level and Degrees Conferred to Students of Color
Exhibit B.1: Percentage of degree completions, by race and ethnicity and level of degree, and total
number of degree completions, by level of degree: 2013–14 ................................................................... 72
Appendix C: Faculty Diversity
Exhibit C.1: Percentage of higher education full-time instructional staff, by race and ethnicity
and tenure status, and total number of faculty by status: 2013–14 .......................................................... 73
Exhibit C.2: Number and percentages of full-time faculty at degree-granting postsecondary
institutions, by race and ethnicity: Fall 1993 .............................................................................................. 74
Appendix D: Postsecondary Data on Equity and Student Success
Measures Disaggregated by Race and Ethnicity ......................................................................................... 75
Measures Disaggregated by Socioeconomic Status ................................................................................... 75
viAcknowledgments
This report was written by a team from several offices at the Department of Education, comprising the
following individuals: Jared Bass and Clare McCann in the Office of Planning, Evaluation and Policy
Development; Chase Sackett and Oliver Schak in Policy and Program Studies Service; and Cynthia Cole,
Kim Hunter Reed, Jon O’Bergh, and Lauren Thompson Starks in the Office of the Under Secretary. Other
contributing offices included the Institute of Education Sciences; Office for Civil Rights; Office of Career,
Technical and Adult Education; Office of Communication and Outreach; Office of Postsecondary
Education; and Office of the Secretary.
viiExecutive Summary
The U.S. Department of Education’s mission is to promote student achievement and preparation for
global competitiveness by fostering educational excellence and ensuring equal access. Integral to
furthering that mission is supporting efforts to create diverse and welcoming campus communities for
all students. Toward that end, the Obama Administration has encouraged institutions not only to attract
and admit students from various backgrounds and experiences, but to support and retain these students
once on campus. The Administration has also supported efforts by institutions of higher education to
use legally permissible strategies to promote student body diversity on their campuses, including by
issuing guidance and technical assistance to help institutions do so. Through all of these strategies, we
can achieve the goal of preparing all of the nation’s students to be great citizens of the world and to
compete in a global environment.
While highlighting the Obama Administration’s efforts to promote diversity in institutions of higher
education, this report shows the continuing educational inequities and opportunity gaps in accessing
and completing a quality postsecondary education. The following are key findings from the analysis:
Higher education is a key pathway for social mobility in the United States. At roughly 2.5
percent, the unemployment rate for college graduates is about half of the national average.
Among Hispanics, adults who had only completed a high school diploma earned $30,329,
compared with $58,493 for those who had completed four-year college (or higher). Among
blacks, adults with a high school diploma earned $28,439 compared with $59,027 for those who
held a bachelor’s degree (see pages 10-14).
During the past 50 years, the U.S. has seen racial and ethnic disparities in higher education
enrollment and attainment, as well as gaps in earnings, employment, and other related
outcomes for communities of color. While the share of the population with a high school
diploma has risen over time for Hispanic, black, white, and Asian adult U.S. residents, the gap in
bachelor’s degree attainment has widened for both black and Hispanic adults compared to
white adults. Specifically, the gap in bachelor’s degree attainment has doubled, from 9 to 20
percent for Hispanic residents since 1974 and from 6 to 13 percent for black residents since
1964. This has significant effects for students’ lives; among all races and ethnicities, there are
significant gaps in post-college earnings and employment between those with only a high school
diploma and those with a bachelor’s degree (see pages 24-28).
Gaps in college opportunity have contributed to diminished social mobility (e.g., the ability to
jump to higher income levels across generations) within the United States, and gaps in college
opportunity are in turn influenced by disparities in students’ experiences before graduating
from high school. This is particularly true for people of color, who share many of the same
childhood and educational experiences as low-income and first-generation college students. For
instance, research shows that one of the factors most likely to negatively contribute to the racial
1and ethnic gap in college completion is elementary and high school segregation. Studies have
documented the impacts associated with racial and economic isolation in schools and
neighborhoods, such as greater stress that interferes with learning and less familiarity with
information and skills that are necessary for future success. Students of color also, on average,
have less access to advanced high school coursework and counselors who are focused on
preparing students for enrolling in postsecondary education (see pages 14-18).
The participation of underrepresented students of color decreases at multiple points across
the higher education pipeline including at application, admission, enrollment, persistence, and
completion. A smaller proportion of black or Hispanic high school graduates than white
graduates enroll in college, and more than 80 percent of Hispanic, black, and Asian students
have a gap between their financial need and grants and scholarships, compared with 71 percent
for white undergraduate students. Moreover, degree completion rates are lower among black
and Hispanic students than white and Asian students; nearly half of Asian students who enrolled
in postsecondary education complete a bachelor’s degree, compared with fewer than one in five
Hispanic and about one in five black students (see pages 19-28).
The interaction of race and ethnicity, family income, and parental education can influence
educational and labor market outcomes. In 2009, six-year bachelor's degree attainment among
postsecondary undergraduate students beginning in the 2003–04 school year was higher for
white and Asian students compared with black and Hispanic students, even after taking into
account family income — a measure of one aspect of socioeconomic status. Moreover, students
of color whose parents completed college were twice as likely as first-generation college
students to earn a bachelor’s degree (see pages 32-34).
To provide equitable, valuable experiences to students of color and low-income students — as well as
other underrepresented populations that are not highlighted in this report — colleges and universities
have implemented practices designed to meet the needs of their campuses. The following areas of focus
encompass practices that research suggests can help advance diversity and inclusion on college
campuses:
Institutional Commitment to Promoting Student Body Diversity and Inclusion on Campus:
Research shows that colleges and universities seeking to promote campus diversity identify how
diversity relates to their core institutional mission and the unique circumstances of the
institution. For example, mission statements and strategic plans that promote student body
diversity and inclusion on campus establish priorities that can, in turn, lead institutions to
allocate the necessary funds and resources for those purposes. Institutions are encouraged to
consider building their capacity to collect and analyze the data required to set and track their
diversity and inclusion goals (see pages 37-38).
Diversity Across All Levels of an Institution: Research shows that campus leadership, including a
diverse faculty, plays an important role in achieving inclusive institutions. For example, faculty
2members’ curricular decisions and pedagogy, including their individual interactions with
students, can foster inclusive climates. Also, students report that it is important for them to see
themselves reflected in the faculty and curriculum to which they are exposed to create a sense
of belonging and inclusiveness (see pages 38-39).
Outreach and Recruitment of Prospective Students: Institutions committed to student body
diversity can take steps to improve outreach and recruitment to a diverse array of students. For
instance, institutions often work to proactively develop relationships and provide support to the
elementary and secondary schools that are located within communities surrounding the
institution. Some strategies supported by research include comprehensive and ongoing support
from administrators and peers; peer advising provided by similarly aged students; targeted
support for critical steps such as completion of the Free Application for Federal Student Aid
(FAFSA) and test prep; and exposure for students to college-level work while they are in high
school (see pages 38-40).
Support Services for Students: In general, student support services are associated with
improved academic outcomes, including after students’ first years in college. Well-designed
course placement strategies mitigate the time students spend in remedial education without
making progress toward a credential. Individualized mentoring and coaching can increase the
odds that students remain enrolled in school. First-year experience programs, such as summer
bridge programs that support incoming students, can improve academic achievement and
credit-earning (see pages 39-41).
Inclusive Campus Climate: Students report less discrimination and bias at institutions where
they perceive a stronger institutional commitment to diversity. Institutions are encouraged to
develop and facilitate programming to increase the cultural competency of leadership, faculty,
staff, and students. Institutions are also encouraged to perform an assessment of their campus
climate related to diversity in order to identify areas for improvement. Many institutions include
cultural competency training in new student orientation and require that students take
coursework in diversity as freshmen. Cultural and socio-emotional support systems like personal
mentoring and counseling can help all students to thrive on campus and are important for
students who do not comprise a racial or ethnic majority. Institutional leaders create support
systems individualized to students’ needs that are highly visible and accessible, and engage
students in the decision-making process regarding campus climate. Successful institutions also
make financial support available to close the need gap for economically disadvantaged students
(see pages 41-44).
Finally, this report recommends areas for further study that can help shape a path forward toward
enrolling, retaining, and graduating more students from underrepresented groups in higher education,
and the promise of equal educational opportunity for all students.
3During the last seven years, the Obama Administration has worked to improve access to higher
education, as well as to help more students complete their college educations and obtain quality
degrees and credentials. Since the beginning of the Administration, the Department of Education has
focused on making college more affordable and accessible to more students, including low-income
students and students of color. However, the path forward will require a thoughtful discourse and a
range of strategies.
4I. Introduction
To ensure that higher education remains a key pathway for social mobility and economic opportunity in
the United States, it is critical to understand both the challenges and the opportunities of advancing
postsecondary diversity and inclusion. For most Americans, higher education is a necessary pathway for
social mobility. The unemployment rate for college graduates with a bachelor’s degree is about half of
the national average, and the pay gap between college graduates and individuals who did not graduate
from college is at a record high and growing. 1, 2 By 2020, experts predict that fully two-thirds of jobs will
require a postsecondary education. 3 For the United States to regain its foothold as the world leader in
college graduates, and to meet the projected workforce demands of the knowledge economy, we must
ensure equitable educational access for an increasingly diverse population. Institutions of higher
education can play a critical role in this effort by strengthening the focus on promoting higher education
access and success for underrepresented populations, and fostering inclusion on college campuses.
While a college education benefits students of all backgrounds, there are likely to be distinct economic
benefits for students from traditionally underserved and underrepresented populations. In an era of
increased wealth and income inequality, a college degree remains a powerful vehicle for upward
economic and social mobility. Data continue to show that the 21st-century economy favors college
graduates over those with only a high school diploma or GED. 4, 5, 6 However, data also show that too
many students of color and low-income students do not receive a higher education comparable to their
white peers. Colleges and universities are the gateways to economic opportunity; they hold the key to
supporting millions of students of color in accessing that mobility.
Thousands of institutions define and pursue educational access and promote diversity in unique ways
that relate to their educational mission and goals. Following a long history of racism and exclusivity of
educational opportunities, today’s college students are more diverse than their predecessors with
respect to race and ethnicity as well as socioeconomic background, as this report describes. 7, 8, 9, 10
This report seeks to build on those institutions’ actions by documenting the trends in educational
outcomes and degree attainment by race and ethnicity at critical points throughout the pipeline into,
during, and beyond higher education. After reviewing trends in the racial and ethnic demographics of
higher education and identifying important challenges, this report provides campus leaders with model
practices for enhancing their institution’s efforts to address these demographic gaps in higher
education, as well as the opportunity to enhance efforts to promote campus diversity and inclusion.
Highlights of Obama Administration Efforts to Promote Diversity in Higher Education
As noted above, research demonstrates that student body diversity in institutions of higher education is
important not only for improving the economic and educational opportunities for students of color, but
also for the social, academic, and societal benefits that diversity presents for all students and
communities. Diverse learning environments help students sharpen their critical thinking and analytical
skills; prepare students to succeed in an increasingly diverse and interconnected world; break down
stereotypes and reduce bias; and enable schools to fulfill their role in opening doors for students of all
backgrounds. 11 Toward that end, the Obama Administration has taken many actions to encourage
5educational institutions to promote diversity consistent with U.S. Supreme Court decisions about the
use of race and ethnicity in education. The Department of Education’s role in these efforts has included
issuing guidance and technical assistance to help postsecondary institutions to voluntarily pursue
campus diversity; promulgating discretionary grant priorities that can be used to promote racial, ethnic,
and socioeconomic diversity at postsecondary institutions in Department of Education-funded grant
programs; and participating, with the Department of Justice, as amicus curiae in Supreme Court and
federal appellate litigation to support racial diversity in higher education.
Ensuring Opportunities for All: Underrepresented Students in Higher Education
More work remains to ensure educational opportunity for all students in higher education. Data show
gaps in preparation, enrollment, and degree attainment for many students of color compared with
white students and Asian students. 12 For instance, fewer high schools with high percentages of students
of color offer advanced coursework opportunities than do high schools with low populations of students
of color. Additionally, many students of color — particularly those from lower-income areas — have
lower levels of academic preparation than their white peers upon entering college, which can affect
degree attainment rates. This report explores data that show that, regardless of the type of institution
they attend, black and Hispanic students are far more likely to be placed in remedial courses during their
first year of college than their white peers (30 and 29 percent, respectively, compared with 20 percent).
Enrolling in remedial courses, which are generally non-credit-bearing, can make it difficult for students
to earn a sufficient number of credits to be on track to graduate in a timely manner relative to the
program length.
Looking at students’ race and ethnicity, we see disparities in access to higher education. For example,
black and Hispanic students are less likely to be enrolled in college, and far less likely to be enrolled in
selective and four-year institutions, than their white and Asian peers. 13 In 2015, the college enrollment
rate for recent high school graduates was more than 70 percent for white students, but was only 55
percent for black students. Moreover, there is a clear divide in the demographics of students enrolling at
four-year institutions versus two-year institutions. Students of color (particularly black and Hispanic
students) who enroll in college are more likely than their white peers to be enrolled in two-year
institutions — 41 and 32 percent, respectively, compared with just 27 percent of white students. 14 While
this may mean that students of color take greater advantage of affordable pathways to a four-year
degree, it may also suggest that students of color lack equitable access to the four-year and selective
institutions that tend to have higher graduation rates and better post-college outcomes.
All of the factors above can significantly affect students’ likelihood of graduating from college. The rate
of college degree attainment for black and Hispanic college students is approximately half that of white
students, and even more stark a difference compared to Asian/Pacific Islander students. 15, 16 Though
overall high school graduation and college enrollment rates have increased among black and Hispanic
students, those students continue to trail their white and Asian counterparts in college completion and
degree attainment. 17 Six years after first enrolling in college, even higher-income black and Hispanic
students are far less likely to have earned a bachelor’s degree than their higher-income white peers (18
and 24 percentage points less, respectively).
6A National Dialogue on Improving Educational Opportunity for All Students in Higher
Education
Given the role that college access and completion play in improving opportunities for people of color —
and other historically underrepresented groups — there is a growing public focus on improving
educational opportunity for all students in higher education and efforts to better measure institutional
success in addressing the issue. 18
Already, dozens of organizations have launched studies of efforts to promote success among low-
income students. Though not a comprehensive list, some efforts on measuring student success include
reports by New America to identify institutions that do not perform well on access, affordability, or
both, 19, 20, 21 college rankings that account for economic diversity and low-income students’ outcomes
from the New York Times, 22, 23 an Education Trust report on the success of low-income students, 24 a
report from the Institute for Higher Education Policy examining colleges where enrolling a larger
population of Pell Grant recipients could generate significant increases in graduates from that
background, 25 and a report from the Jack Kent Cooke Foundation identifying gaps in access for high-
achieving, low-income students. 26
In addition to broad initiatives to refocus on equity and student success, other efforts have been made
to conceptualize and measure progress on racial and ethnic student enrollment and campus climate.
These efforts, which include the following among many others, present further, critical components of
promoting educational excellence and access in postsecondary education:
• Gallup conducted a survey among students and college presidents regarding on-campus race
relations. Although the survey found that 84 percent of presidents positively view race relations
on their campus, only a quarter positively view race relations on other campuses nationwide.
The authors suggest positive views of race relations on other campuses decreased sharply from
2015 to 2016 — presumably due to increased attention to issues of racial equity and inclusion in
higher education. Students interviewed also viewed campus climate positively on their campus,
although black and Hispanic students were less likely to describe relations as “excellent.” 27
• The Chronicle of Higher Education published an interactive tool, using data from the Integrated
Postsecondary Education Data System (IPEDS), allowing the public to examine faculty racial and
ethnic demographics at selective public universities in comparison to the students they serve. To
measure the racial and ethnic demographics of students and faculty, the authors used a
“diversity index,” which represents the probability that any two people chosen at random from
a sample will be of different races or ethnicities. The index works on a scale of zero to 100. A
score of zero means there’s no chance that those two people will be of different races; a score
of 100 means it’s guaranteed that they will be. 28
• Indiana University at Bloomington’s Culturally Engaging Campus Environment Project (CECE) has
developed a campus climate survey of students for the 2016–17 academic year that will help
participating colleges make meaningful changes in their campus environment. The overarching
aim of the CECE Project is to create and utilize tools to assist postsecondary institutions in their
efforts to examine, understand, and improve their campus environments and maximize success
among diverse student populations. The CECE Project moves beyond typical climate
7assessments that tend to focus on challenges in the environment. Instead, the CECE Project
focuses on the types of environments that engage and support college students from all
backgrounds. 29
• American Council on Education (ACE) conducted a national anonymous online survey of college
and university presidents for an institutional perspective on campus climate and reactions to
student movements for more inclusive higher education settings. The authors received
responses from 567 college and university presidents, including those at two-year and four-year
institutions. They found that, at almost half of four-year colleges, students have raised concerns
about racial diversity by organizing on campuses; and that the racial climate on campus is a
priority for more than half of four-year college presidents surveyed. 30
• Admission staff at the University of Colorado Boulder (CU-Boulder) took a hard look at how
underrepresented students were viewed during a holistic review of undergraduate applications.
Using data from the Education Longitudinal Study (ELS) of 2002, a nationally representative
dataset, CU-Boulder estimated the relationships between college access, socioeconomic status,
and high school academic achievement and created its disadvantage index and
overachievement index, which give special consideration to students who have faced significant
socioeconomic disadvantage and those who have succeeded despite their disadvantage. 31
All of these — and many other — efforts have made valuable contributions to our understanding of
campus racial and ethnic demographics, climate, and student success.
Obama Administration Efforts on the Expansion of College Opportunity
A March 2016 Department of Education report and summit focused on supporting Pell student success
in higher education: Fulfilling the Promise, Serving the Need highlights institutions that enroll an above-
average share of low-income students and help them to graduate, and identifies best practices for
institutional improvement. 32
This report builds on the substantial body of work, since the beginning of the Obama Administration, to
expand college opportunity — particularly the work to ensure more historically underserved students
are enrolling in and graduating from college. Recognizing the impact of affordability on college access
and completion, this Administration has increased the maximum annual Pell award by more than $1,000
per eligible student, enabling more students to access and complete college each year. Additionally, by
simplifying and streamlining the FAFSA and making it available earlier in the admissions process, and
through resources like the College Scorecard that can help students navigate their college options, this
Administration has expanded access to financial aid and made it easier for students and families to apply
for and enroll in college. Through the White House College Opportunity Summit and Day of Action, the
president and first lady secured more than 700 commitments from college presidents, K-12
superintendents, non-profit organizations, foundations, and businesses to help more students prepare
for and graduate from college, which altogether set 10 million more students on track to earn their
degrees within a decade.
A report released in conjunction with the January 2014 College Opportunity Summit noted that, “while
the President continues to push for changes that keep college affordable for all students and families,
8we can and must be doing more to get more low-income students prepared for college, enrolled in
quality institutions, and graduating.” 33 To support these efforts, the Department of Education has
worked to expand access by launching a dual enrollment experiment that will provide low-income high
school students with new opportunities to access college programs before graduating; holding career
colleges accountable for their students’ outcomes through the Gainful Employment regulations; and
promoting greater affordability through expanded access to income-driven student loan repayment
plans.
Community engagement and partnerships to advance the work to close equity and opportunity gaps,
and ensure students have an opportunity to reach their full potential, have also been key features of the
Administration’s work. The Obama Administration has launched efforts like the My Brother’s Keeper
Task Force, a coordinated federal initiative to address opportunity gaps, including gaps that boys and
young men of color face, and ensure that all young people can reach their full potential. Communities
across the country have accepted the My Brother’s Keeper Community Challenge and have also
committed to creating their own independent plans to expand opportunity for our nation’s young
people. And a number of initiatives, housed in the Department of Education, are also focused on
ensuring that all young people can reach their full potential. These initiatives include the White House
Initiative on Educational Excellence for African Americans, the White House Initiative on Educational
Excellence for Hispanics, the White House Initiative on Asian Americans and Pacific Islanders, the White
House Initiative on Historically Black Colleges and Universities, and the White House Initiative on
American Indian and Alaska Native Education. The White House initiatives have played a key role in
announcing new resources, convening stakeholders, and engaging in direct outreach with the field to
help both students and their institutions support expanding opportunity.
9II. Setting the Context: A Snapshot of Opportunity Gaps in Postsecondary
Education
This section reviews trends related to educational outcomes and socioeconomic status disaggregated by
race and ethnicity. After highlighting the persistence of gaps in educational attainment, it discusses the
interplay between gaps in college opportunity and social mobility; and lays out the influence that factors
such as family resources and childhood experiences can have on college access and opportunity for
students of color, which provides some backdrop for understanding the related challenges.
A note about the presentation of race and ethnicity data: U.S. Department of Education data are limited
for smaller racial and ethnic groups of students, including American Indian/Alaska Native, and Native
Hawaiian/Other Pacific Islander students. In addition, there is limited data for students reported as two
or more races. This limits the statistics that can be analyzed because, in many cases, trend data are not
available or sample sizes are too small to yield reliable or reportable estimates. The Department
continues work to improve data collection so a more complete picture of educational outcomes for these
populations can be made available in the future (See pages 29-31 and exhibit A.23 in appendix A for data
on smaller populations of students of color.)
A. Trends in Educational Degree Attainment and Social Mobility
Key Findings: The U.S. population has steadily become more racially and ethnically diverse
over time. Data in exhibits in this section and in appendix A reflect the rise in young, diverse
Americans, and show the following educational trends disaggregated by student race and
ethnicity:
• The percentage of Hispanic, black, white, and Asian adults who have earned a high
school diploma or higher has increased since the 1960s.
• Gaps in degree attainment are more pronounced at the postsecondary level.
Bachelor’s degree attainment for Hispanic, black, white, and Asian adults has risen
over time — yet the attainment gap has more than doubled between whites and
blacks, as well as between whites and Hispanics.
• Racial and ethnic disparities in postsecondary degree attainment continue into the
working world. Earnings are strongly correlated with both college completion and
race and ethnicity. Increased demand for skilled workers only further disadvantages
adults without college degrees.
The United States population has steadily become more diverse over time.
The U.S. population has steadily become more diverse over time. In 1960, 89 percent of United States
residents were white, 11 percent were black, and less than 1 percent was either Asian/Other Pacific
Islander or American Indian/Alaska Native. For the 1980 Census, 6 percent were Hispanic. In
10comparison, 64 percent of residents were non-Hispanic white, 13 percent were black, 17 percent were
Hispanic, 5 percent were Asian, 1 percent were American Indian/Alaska Native, and 3 percent were two
or more races in 2010 (see exhibit A.1 in appendix A).
The racial and ethnic breakdown of young Americans indicates that the diversity of the population will
continue to increase. In 2014, almost half of children under the age of 18 were people of color. Among
residents between the ages of 18 and 24, 55 percent were white, 15 percent were black, 21 percent
were Hispanic, 5 percent were Asian, 1 percent was American Indian/Alaska Native, and 3 percent were
two or more races (exhibit A.2). Because of the large share of people of color among young Americans,
the Census Bureau projects that the majority of Americans will be people of color by 2050. 34
The earning of high school diplomas has increased over time.
The share of students earning a high school diploma has risen over time for Hispanic, black, white, and
Asian adult U.S. residents. For example, in 1964, the percentage of people 25 and older who at least
graduated from high school was 50 percent for white and 26 percent for blacks, compared with 93
percent for whites and 86 percent for blacks in 2014 (exhibit A.3). Similar increases also occurred for
young adults between the ages of 25 and 29 (exhibit A.4).
For people 25 years and older, from 1974 to 1994, the gap between Hispanic and white high school
attainment increased from 27 percent to 32 percent — but then declined to 27 percent by 2014.
However, the gap between black and white high school attainment steadily dropped from 25 percent in
1964 to 7 percent in 2014 (exhibit A.3). Moreover, the total college enrollment rate (percent of 18- to
24-year-olds enrolled at two- and four-year colleges and universities) increased from 32 percent in 1990
to 40 percent in 2013. 35 Students of color also benefited from increases in enrollment. For instance, the
gap in the college enrollment rate between white and Hispanic students narrowed between 2003 and
2013 (from 18 to 8 percent). 36
Bachelor’s degree attainment has risen over time for Hispanic, black, white, and Asian adults.
Exhibit 1.1 shows that bachelor’s degree attainment has risen over time for Hispanic, black, white, and
Asian adult U.S. residents. For example, in 1974, the percentage of people 25 and older who had
completed college was 6 percent for both Hispanic and black residents, compared with 15 percent for
Hispanics and 22 percent for blacks in 2014. In 2014, Asians had the highest rate of attainment with 52
percent having completed college. Similar trends also occurred for young adults between the ages of 25
and 29 (exhibit A.5).
The gap in bachelor’s degree attainment has risen for both black and Hispanic adults.
While the high school attainment gap has closed and overall attainment for black and Hispanic students
has grown, the gap in bachelor’s degree attainment has steadily widened between Hispanic and whites
as well as black and white U.S. residents. From 1974 to 2014, the gap between Hispanic and white
bachelor’s degree attainment more than doubled from 9 percent to 20 percent (exhibit A.6). The gap
between black and white bachelor’s degree attainments also more than doubled, from 6 percent in
1964 to 13 percent in 2014. Similar increases in gaps occurred for young adults between the ages of 25
and 29 (exhibit A.5). As discussed later in this report, part of this increase in attainment gaps is due to a
11relatively smaller share of students of color enrolling in four-year colleges, while to some extent it is also
due to lower completion rates among those who do enroll.
Exhibit 1.1: Percentage of U.S. residents 25 years and older attaining a bachelor’s degree or higher,
by race and ethnicity: From 1964 through 2014
100%
Percent Attained Bachelor's Degree or Higher
52%
49%
50%
36%
31%
24%
22%
20%
18%
14% 13%
10% 10%
15%
6% 12%
4% 8% 9%
6%
0%
1964 1974 1984 1994 2004 2014
Hispanic Black White Asian
NOTE: Due to limitations in Census methodology, attainment among Asians is not available before 2002 and attainment among Hispanics is not
available before 1974. Asian category excludes Native Hawaiian/Other Pacific Islander students.
SOURCES: U.S. Census Bureau, March Current Population Survey, 1947 and 1952 to 2002; U.S. Census Bureau, Annual Social and Economic
Supplement to the Current Population Survey, 2003 to 2015 (noninstitutionalized population, excluding members of the Armed Forces living in
barracks); U.S. Census Bureau, Census of Population, 1940 and 1950.
Available at http://www.census.gov/hhes/socdemo/education/data/cps/historical/index.html.
Annual earnings are strongly correlated with educational attainment and race and ethnicity.
Exhibit 1.2 suggests gaps in bachelor’s degree attainment could contribute to income disparities among
Hispanic, black, white, and Asian adults. In 2014, the average annual earnings were $33,944 for
Hispanics and $37,012 for blacks, compared with $52,171 for whites and $57,351 for Asians. Among
Hispanics, adults who had only completed a high school diploma earned $30,329, compared with
$58,493 for those who had completed four-year college (or higher). Among blacks, adults with a high
school diploma earned $28,439 compared with $59,027 for those who held a bachelor’s degree.
12Exhibit 1.2: Total money earnings for U.S. residents 18 years and older, by race and ethnicity and
educational attainment: 2014
$100,000
$78,037
$73,682
$75,000
Total Money Earnings
$57,351 $58,493 $59,027
$52,171
$50,000
$44,984
$37,012 $39,130 $40,382
$33,944 $36,826 $35,399
$30,329 $29,809
$28,439
$25,000
$0
Total High school Associate degree Bachelor's degree or
more
Hispanic Black White Asian
NOTE: Total money earnings includes earnings received for work performed as an employee during the income year, such as wages, salary,
Armed Forces pay, commissions, tips, piece-rate payments, and cash bonuses earned, before deductions are made for taxes, bonds, pensions,
union dues, etc. Asian category excludes Native Hawaiian/Other Pacific Islander.
SOURCE: U.S. Census Bureau, Current Population Survey, 2015 Annual Social and Economic Supplement.
Available at https://www.census.gov/hhes/www/cpstables/032015/perinc/pinc04_000.htm.
Research also indicates that the attainment of a postsecondary degree has become increasingly
important due to technological changes and increasing demand for skilled workers. At roughly 2.5
percent, the unemployment rate for college graduates is about half of the national average. 37 According
to the Center on Education and the Workforce, more than 95 percent of jobs created during the
economic recovery have gone to workers with at least some college education, while those with a high
school diploma or less have not seen a return of their jobs. As a result, workers with at least some
postsecondary education now make up 65 percent of the total employment, and bachelor’s degree
holders now earn 57 percent of all wages. 38 In addition to economic outcomes, educational attainment
is associated with important nonpecuniary benefits that impact communities of color. For African
American males, those with only a high school diploma are three times more likely to be incarcerated by
age 34 as their counterparts with a four-year college degree. 39 These trends suggest gaps in
13postsecondary attainment will continue to contribute to socioeconomic disparities among Hispanics,
blacks, whites, and Asians.
B. Gaps in College Opportunity
Key Findings: Gaps in college access and opportunity to complete a degree have contributed to
diminished social mobility across generations within the United States, particularly for people of
color. These gaps in college opportunity are influenced by disparities in students’ experiences
before graduating from high school; and these experiences for students of color, in turn,
intersect with the experiences of low-income and first-generation college students.
Overview of the Higher Education Pipeline
This section analyzes data on the higher education pipeline to and through college, which represents the
different pathways students can take to complete a postsecondary degree. Taking a national lens of
nationally representative data, this report examines the following points in the pipeline:
• Applications: Student engages in precollegiate activities, such as researching colleges or taking
entrance exams, and applies or attempts to enroll at a postsecondary institution;
• Admissions: College offers admission to student and student has adequate financial aid to make
attendance and costs of living affordable;
• Enrollment: Student enrolls and starts attending college;
• Persistence: Student remains enrolled in college and successfully accumulates credits needed to
graduate; and
• Completion: Student meets graduation requirements and college confers the student with a
postsecondary credential.
As depicted in exhibit 2.1, college opportunity diminishes for students of color at multiple points in the
pipeline. These gaps in college opportunity diminish social mobility and play a role in perpetuating
intergenerational disparities by race and ethnicity, and also socioeconomic status. Moreover, because of
the impact parental education has on family resources, childhood experiences, and educational
opportunity of future generations, such disparities in college completion are a major factor in reducing
opportunities for both children and adults of color. Stated another way, institutions and the policy
community face critical challenges in reducing these gaps in access and success to improve the
socioeconomic and educational opportunities for people of color. This section highlights some key
evidence supporting this linkage between college opportunity and racial and long-term outcomes for
people of color.
College Completion and Social Mobility
While institutions of higher education serve as gateways to educational and economic mobility, too few
students are able to benefit from these opportunities. The previous section demonstrated that
persistent disparities in educational attainment contribute to disparities in socioeconomic outcomes
14You can also read