Grassland Monitoring in Estonia - A Case Study European Association of Remote Sensing Companies - EARSC
←
→
Page content transcription
If your browser does not render page correctly, please read the page content below
European Association of Remote Sensing Companies

                         Sentinels Benefits Study (SeBS)

                            A Case Study
              Grassland Monitoring in Estonia

SeBS-CR-010                            Page 1                    May 2021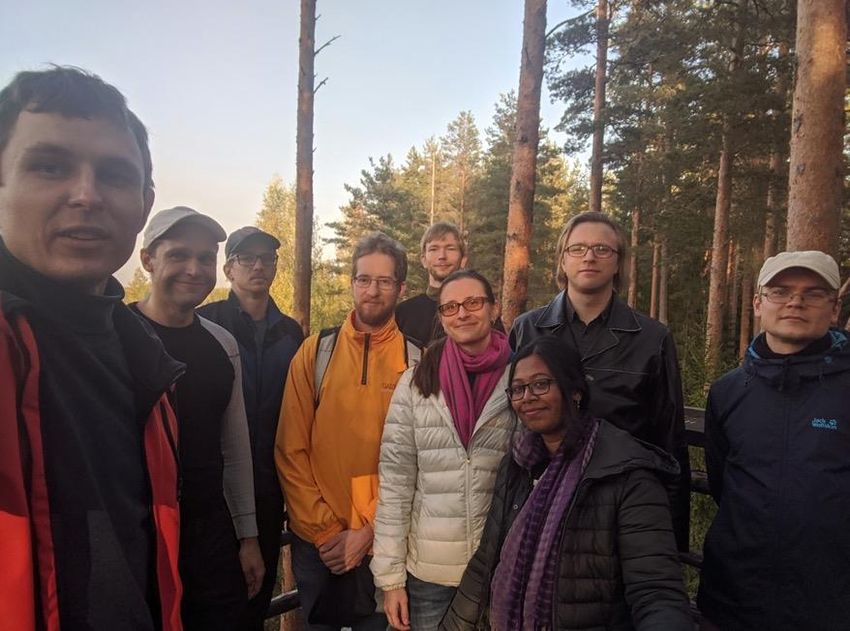
Client:                  ESA

 Client Representative:   Alessandra Tassa
 Date of Delivery:        03/05/2021
 Version:                 Draft
                          Daire Boyle (EARSC)
 Author(s):               Lefteris Mamais (EARSC)
                          Nikolay Khabarov (IIASA)
 Reviewer                 Alessandra Tassa (ESA)

 Version                       Date                              Comment

 1st Issue                     03/05/2021

 Second Draft                  28/04/2021

or more information contact:
   •   EARSC: info@earsc.org

   •   ESA: Alessandra.Tassa@esa.int

Funded by the EU and ESA – ESA Contract Number: 4000119743/17/I-SBo.
The views expressed herein can in no way be taken to reflect the official opinion of the European
Space Agency or the European Union.

SeBS-CR-010                                     Page 2                                  May 2021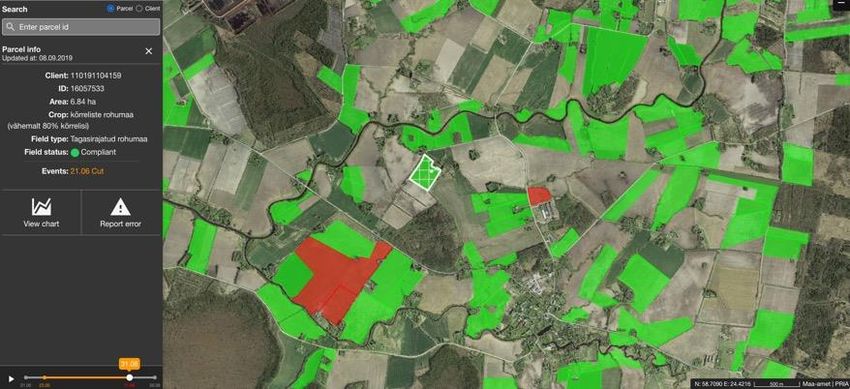
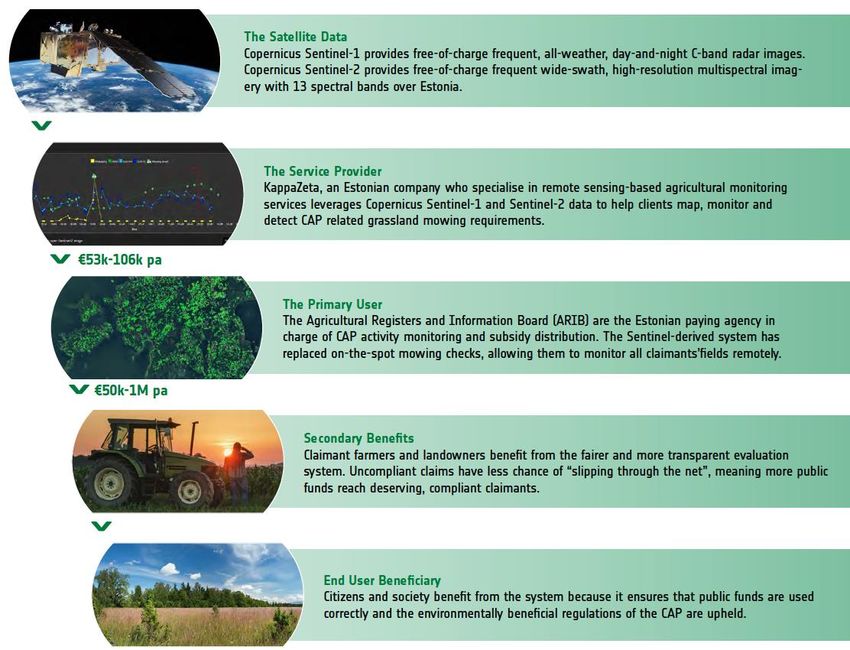
Table of Contents
Setting the Scene ........................................................................................................................................ 6

Executive Summary .................................................................................................................................... 7

1   Introduction & Scope .......................................................................................................................... 9
1.1    The Context of this study....................................................................................................................... 9
1.2    What is the case all about?.................................................................................................................... 9
1.3    How does this case relate to others? .................................................................................................... 9
1.4    More About the Study ......................................................................................................................... 10
1.5    Acknowledgements ............................................................................................................................. 11
2   Grasslands in Estonia ........................................................................................................................ 12
2.1   The importance of grasslands ............................................................................................................. 12
2.2   Grassland in Estonia ............................................................................................................................ 14
2.3   The relevance of the CAP in the regulation of grasslands ................................................................... 17
2.3.1         The EU’s Common Agricultural Policy .............................................................................................................. 17
2.3.2         The CAP in practice ........................................................................................................................................... 18
2.3.3         Common monitoring and evaluation framework ............................................................................................. 20
2.3.4         Income support and “Greening” ...................................................................................................................... 22
2.3.5         Estonian subsidy payments for the maintenance of grassland ........................................................................ 24
2.3.6         Compliance checks ........................................................................................................................................... 27
2.4       Informed decisions, coordinated actions and effective interventions ................................................ 27
2.4.1         Collecting the necessary data ........................................................................................................................... 28
2.4.2         Limitations of conventional methods ............................................................................................................... 28

3   The Use of Sentinel Data ................................................................................................................... 29
3.1   General introduction on the use of satellite data for agriculture ....................................................... 29
3.1.1         How can satellites enhance agricultural monitoring ........................................................................................ 29
3.1.2         Advantages ....................................................................................................................................................... 31
3.1.3         Limitations ........................................................................................................................................................ 32
3.2       Copernicus and the Sentinels .............................................................................................................. 33
3.3       The KappaZeta Service ........................................................................................................................ 35
3.3.1         Future Evolution of the Service ........................................................................................................................ 38

4   Understanding the Value Chain ......................................................................................................... 40
4.1   Description of the Value-Chain............................................................................................................ 40
4.2   The Actors ............................................................................................................................................ 41
4.2.1         Tier 1: Service Provider – KappaZeta ................................................................................................................ 41
4.2.2         Tier 2: Primary User – Estonian Agricultural Registers and Information Board (ARIB) ..................................... 42
4.2.3         Tier 3: Farmers / Landowners ........................................................................................................................... 43
4.2.4         Tier 4: Citizens & Society .................................................................................................................................. 43

5   Assessing the Benefits ....................................................................................................................... 45
5.1   Overview.............................................................................................................................................. 45
5.2   Benefits along the Value-Chain ........................................................................................................... 46
5.2.1         Tier 1: Service Provider – KappaZeta ................................................................................................................ 46
5.2.2         Tier 2: Primary User – The Estonian Agricultural Registers and Information Board (ARIB) .............................. 49
5.2.3         Tier 3: Farmers / Landowners ........................................................................................................................... 50
5.2.4         Tier 4: Citizens & Society .................................................................................................................................. 52

SeBS-CR-010                                                                            Page 3                                                                        May 2021
5.2.5         Other beneficiaries ........................................................................................................................................... 53
5.3       Summary of Benefits ........................................................................................................................... 54
5.3.1         Economic .......................................................................................................................................................... 54
5.3.2         Environmental .................................................................................................................................................. 55
5.3.3         Regulatory ........................................................................................................................................................ 55
5.3.4         Entrepreneurship & Innovation ........................................................................................................................ 56
5.3.5         Science and Technology ................................................................................................................................... 56
5.3.6         Societal ............................................................................................................................................................. 56
5.4       Synoptic Overview ............................................................................................................................... 57

6   Conclusions ....................................................................................................................................... 58
6.1   Summary of Findings ........................................................................................................................... 58
6.2   The Impact of Sentinel Data ................................................................................................................ 58
6.3   Widening the Perspective.................................................................................................................... 58
6.4   Final Thoughts ..................................................................................................................................... 63

Annex 1: References and Sources ............................................................................................................. 65

Annex 2: General Approach and Methodology ......................................................................................... 66

Annex 3: Winners… and losers? ................................................................................................................ 69

Annex 4: About the Authors ..................................................................................................................... 71

List of Figures
Figure 2-1: Comparison of species richness across terrestrial biomes ............................................ 12
Figure 2-2: Distribution of grasslands in Europe .............................................................................. 14
Figure 2-3: Alvar grassland in Northwest Estonia ............................................................................ 15
Figure 2-4: Map of the LIFE to Alvars project sites on Estonia's western coast .............................. 16
Figure 2-5: The 9 CAP objectives for 2021-2027 .............................................................................. 18
Figure 2-6: Some of the CAP context indicators 2019 ..................................................................... 21
Figure 2-7: Percentage of holdings subject to one or more greening measure per member state 23
Figure 3-1: Illustration of passive versus active remote sensing ..................................................... 30
Figure 3-2: Active and passive sensors used for remote sensing .................................................... 30
Figure 3-3: Current Sentinel satellites .............................................................................................. 33
Figure 3-4: Sentinel-1 and Sentinel-2 satellites ............................................................................... 34
Figure 3-5: KappaZeta's EU Subsidy-Check, interactive map ........................................................... 36
Figure 3-6: The Mowing Chart of a randomly selected, compliant field.......................................... 37
Figure 3-7: True colour Sentinel-2 image of a randomly selected field ........................................... 38
Figure 3-8: NDVI Sentinel-2 image of a randomly selected field ..................................................... 38
Figure 4-1: The value chain for Grassland Monitoring in Estonia .................................................... 40
Figure 4-2: The KappaZeta team ...................................................................................................... 41
Figure 4-3: KappaZeta’s mowing detection map showing compliant and non-compliant fields..... 42
Figure 5-1: Benefits along the value chain ....................................................................................... 45
Figure 5-2: Labour cost components................................................................................................ 48

SeBS-CR-010                                                                             Page 4                                                                         May 2021
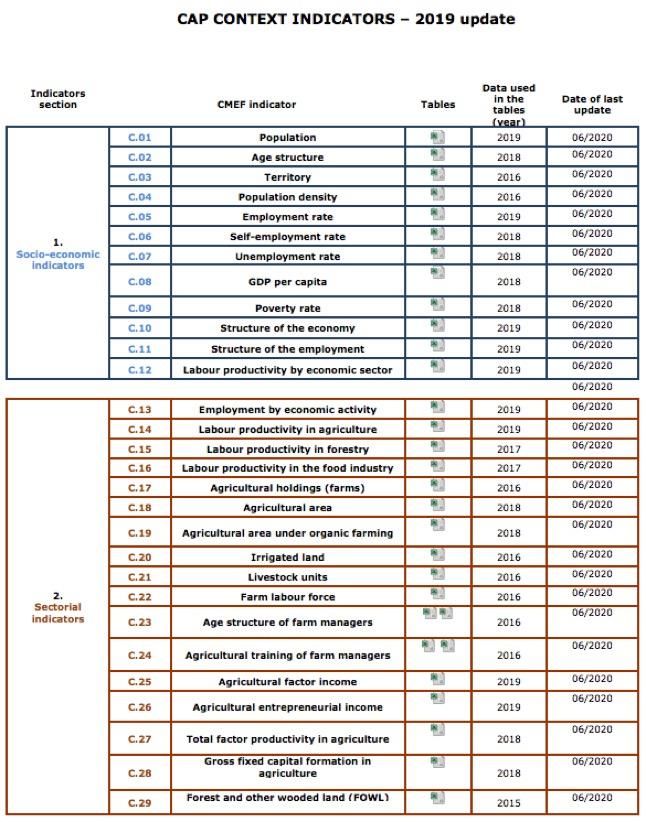
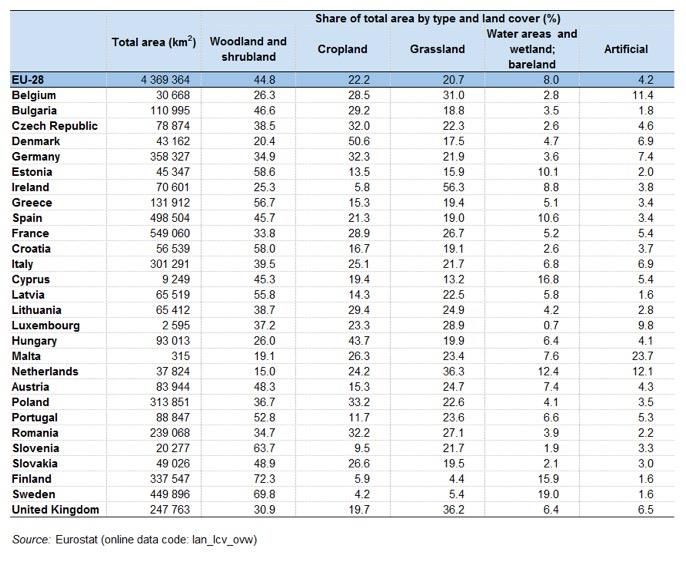
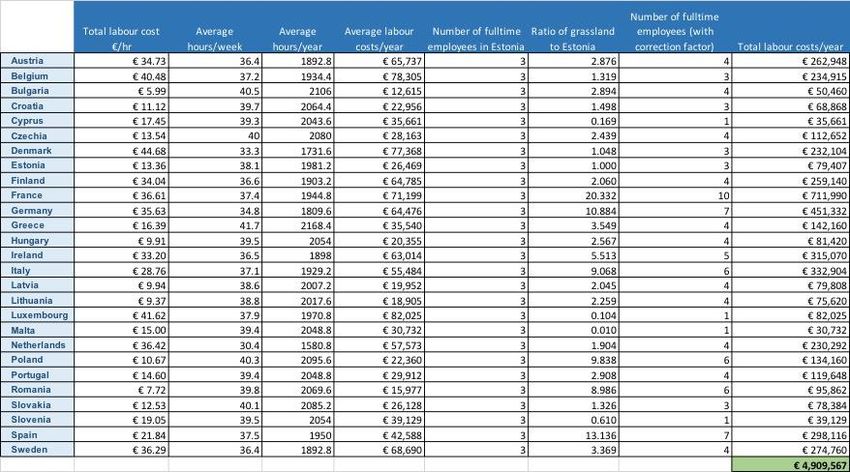
Figure 6-1: Estimated hourly labour costs in each EU member state ............................................ 60
Figure 6-2: Average weekly working hours in each EU member state .......................................... 60

List of Tables
Table 5-1: Summary of economic benefits                                                                       54
Table 5-2: Overview of the benefits from using Sentinel data                                                  57
Table 6-1: Tier 1 economic benefits extrapolation                                                             61
Table 6-2: EU member state land cover by type                                                                 62

SeBS-CR-010                                            Page 5                                          May 2021
Setting the Scene
Viktoria woke from her nap to the sound of her father’s mobile phone buzzing on the coffee table.
He was outside tending to their cows in the field behind the milking parlour and must have left it
behind. Usually she wouldn’t care to check who was texting her father, but she couldn’t help but
notice that the partial piece of text on the screen didn’t look like a regular message. From what
she could gather, whoever was texting her father seemed to be telling him to do something, but
the language seemed very formal, like it was coming from an important source. Maybe the
Estonian Government was trying to warn its citizens of some sort of flash flooding? Maybe he was
an undercover agent, and this was his top-secret mission briefing? Maybe they were in danger?
Her curiosity got the better of her, so she called out her father’s name.
Her father, Kaspar, came in from the July heat and slowly opened the fridge, poured himself a
glass of milk, stretched his legs and turned on the television. Viktoria thought he seemed very
relaxed for a person who could be about to discover that his life may never be the same again.
She passed him his phone and he casually unlocked it, maintaining one eye on the television at all
times. She waited for his reaction… “Oh yeah, yeah, I should actually do that this evening….” he
mumbled to himself as he put the phone back down and finished his milk. Viktoria was confused.
“Do what?!”, she asked. “Mow the grass” he replied. Viktoria was even more confused.
“Have I never shown you this? It’s pretty cool, I get a text from the Estonian Agricultural Registers
and Information Board every year to remind me to mow our grass meadows” Kaspar explained. “I
had actually forgotten this year, so it’s good they reminded me. If I don’t do it before a certain
date, I don’t get my subsidy payment”. Viktoria’s worry subsided.
That evening, Viktoria bumped into her father as he was returning from mowing the fields. “So
that’s it?” she asked, “That’s it!” he quickly replied. “So you text them back to tell them you’ve
done it?” Now Kaspar was confused, but he quickly realised why. “Ah I forgot to mention an
important part. I don’t have to do anything now. I just wait. They use satellites to see if I’ve actually
done it or not”. “Really?!” Viktoria replied, “They can do that?!” “Sure! Satellites help them
monitor a lot of things actually, checking if I comply with environmental regulation is just the tip
of the iceberg” Kaspar explained. “Wow, I hadn’t realised that… I wonder if they can tell that you
missed a patch in the corner of the bigger field?” Viktoria asked. Kaspar’s head dropped in
realisation… “Satellites are great, but your attention to detail never fails to amaze me…”

This story is entirely imaginary, although realistic based on our knowledge gained through the case
interviews. The places are real, although the characters, the conversation and the situation are
entirely fictional. It also depicts how the service in question is intended to work in the future.

SeBS-CR-010                                         Page 6                                       May 2021
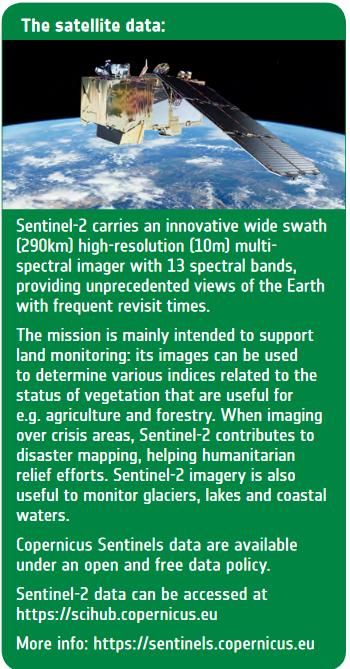
Executive Summary
This case deals with the monitoring and enforcement of one of the EU’s Common Agricultural Policy
(CAP) initiatives, specifically, the maintenance of permanent grasslands. The CAP is regarded as one
of the most economically and politically important policies the EU maintains. A core role of the CAP
is to provide farmers with income support, through both direct payments and through
remunerations for maintaining environmentally friendly practices. One such remuneration
supports farmers who maintain permanent grassland in good agricultural condition.
For farmers to receive subsidy payments, they must comply with certain rules and regulations. The
standard way in which CAP compliance checks are conducted involves inspections being carried out
on-the-spot (at the farm) by inspectors. The obvious issue with this is that it is hugely impractical,
if not impossible, to conduct on-the-spot checks for every single beneficiary each year. As a result,
member states generally can only check a sample of farms each year and rely on the honesty of all
other farmers on the unchecked farms. A much broader, continuous and transparent monitoring
system is clearly required, which is where Sentinel data comes into the picture. The Estonian
Agricultural Registers and Information Board (ARIB), along with the help of KappaZeta, Tartu
Observatory and CGI Estonia developed a service to address this clear inefficiency.
The introduction of EU Regulation No 2018/746 in 2018 encouraged EU member states to use
satellite data in their CAP monitoring and verification activities. The algorithms developed by
KappaZeta use both Sentinel-1 and Sentinel-2 data (SAR and optical imagery) to constantly and
automatically monitor around 101,000 fields of grassland all across Estonia. There is a requirement
to mow these fields at least once per year (within a certain time window) with the intentions of
keeping them in good order. Farmers and landowners who apply for direct CAP payments for the
preservation of these fields receive money for complying with this requirement. The service
developed can automatically detect when a mowing event has taken place on each of the
monitored fields. This in turn allows ARIB to issue direct payments to compliant claimants. The
automatic nature of the software helps to reduce the need for in-person spot checks of mowing
events of fields to take place.
The benefits associated with this Sentinel enabled service are significant. In Estonia, economic
benefits amount to between €103,000 and €1.1 million annually; stemming from the employment
of full-time workers and the avoidance of in-person compliance checks across the country.
Substantial non-economic benefits are also found in this case. The synergy between KappaZeta’s
service and ARIB’s operations helps to ensure the biodiversity of Estonia’s ecosystems and the
protection of its beautiful landscapes. It also contributes to the supranational environmental
sustainability goals of the CAP’s initiatives i.e. keeping EU agricultural practices sustainable,
protecting natural habitats and aiding the sequestration of CO2. The environmental benefits in this
case are experienced right along the value chain, at both micro and macro levels, making it a prime
example of how Sentinels can add huge value to our environmental sustainability efforts.
Society benefits from the transparency and open nature of KappaZeta’s software. The fact that the
interactive map and compliance data is completely free for anyone to interrogate online aids in the

SeBS-CR-010                                      Page 7                                      May 2021
manifestation of a transparent check and balance dynamic between ARIB, the claimants (farmers
and landowners) and the general public. This helps the creation of societal trust in ARIB’s operations
and their distribution of taxpayers’ money. It also helps solidify public trust in the various EU CAP
initiatives as people can see for themselves exactly where public money is going.
But perhaps the strongest benefit of all is the contribution that the Sentinel data can make to
regulatory compliance. The motive behind the service is to monitor and verify CAP regulations in a
more efficient and accurate manner. Utilisation of the new sentinel-enabled monitoring system
allows ARIB to monitor all registered fields, automatically and continually, compared to the 5%
sample previously taken. As a result, they can fulfil their operational mandate in a more complete
manner and help to distribute taxpayers’ money more fairly. The EU themselves incentivise the
development of valuable and innovative methods of monitoring and enforcing regulation through
the likes of satellite data. KappaZeta and ARIB both contribute hugely to upholding and driving
forward how CAP regulation can be managed. Not only that, but the valuable lessons and rich data
all parties have gained throughout the development and implementation of this service can help in
moulding new regulation in the future. The lessons learned and innovative “know-how” discussed
in this case provide valuable insights which can be used to inform the design of new regulations -
particularly when it comes to the capabilities and limitations of the service.
The benefits within each tier of the value chain are shown in the graphic below.

SeBS-CR-010                                      Page 8                                      May 2021
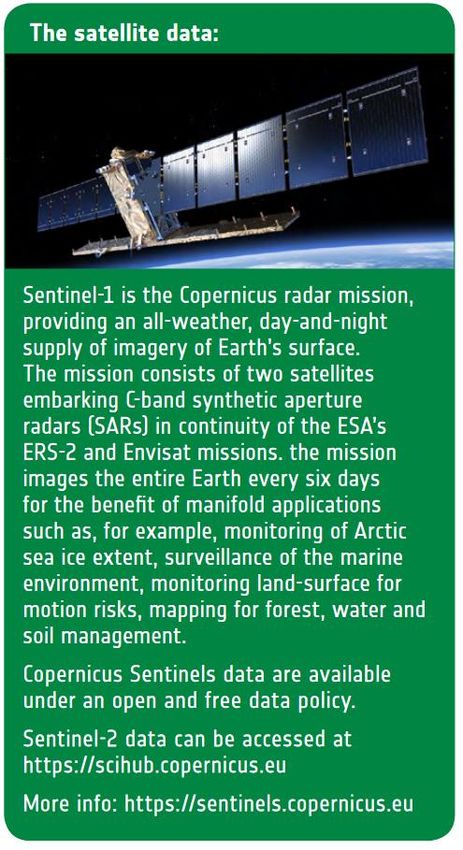
1 Introduction & Scope
1.1 The Context of this study
The analysis of the case study ‘Grassland Monitoring in Estonia” is carried out in the context of the
‘The Sentinel Economic Benefits Study’ (SeBS). This 4-year study is looking to develop cases showing
how EO-derived products based on data generated by one or more Sentinel satellites deliver value
to society and citizens. The Sentinel satellites form a crucial part of EU’s Copernicus Programme,
providing space-based observations on a full, free and open basis. Data coming from the Sentinels
– together with other data collected by contributing missions and ground, sea or airborne
instruments – is used to support key economic or societal areas such as agriculture, insurance,
disaster management, climate change monitoring, etc. Sentinel data are thus a key component of
the Copernicus Services, and a crucial source used by companies to deliver products and services
helping different users across the Globe.

1.2 What is the case all about?
The Common Agricultural Policy (often referred to simply as the CAP) is the EU’s largest, most well-
known and arguably most important policy. It dominates the European agricultural landscape and
helps the EU to maintain its food production requirements as well as support the livelihoods of
hundreds of thousands of people. A significant part of the CAP involves financially rewarding
farmers for maintaining sustainable agricultural practices. In this case we study an innovative
system, empowered by Sentinel data, which is used to ensure farmers in Estonia are abiding by CAP
regulation and maintaining permanent grassland in the interest of biodiversity.
We investigate how the unique software KappaZeta has developed helps the Estonian Agricultural
Registers and Information Board (ARIB) to replace the on-the-spot checks of compliance to CAP
grassland mowing requirements with automated, remote mowing detection. The benefits
emanating from this working relationship help to save both time and money in identifying and
paying CAP compliant farmers, while protecting the natural resources, habitats and landscapes of
Estonia for its farmers to thrive in and citizens to enjoy for years to come.
In this report, you will discover both the story and the rigorous analysis around the benefits
experienced by different value chain actors in this case. The analysis relies on clear and openly
presented assumptions which have been shaped with the help of the stakeholders we interviewed
(see 1.5 below). However, we encourage any reader to contact us if they think the assumptions are
unreasonable for any reason by emailing us at info@earsc.org with any questions or observations.
Also, the authors can be contacted directly (contact details in Annex 4).

1.3 How does this case relate to others?
This is our 4th SeBS long case linked to agriculture, however, it differs slightly from the previous
agricultural cases. The others dealt with the growing of potatoes in Belgium and the growing of
cereals in both Denmark and Poland, whereas this case deals primarily with the mowing of
grasslands and regulatory compliance. This implies that the dynamics of this case are somewhat

SeBS-CR-010                                      Page 9                                     May 2021
different to anything we have previously studied. As this case does not deal with increasing the
efficiency by which produce can be grown and ultimately sold, it deviates from the benefits which
are “traditionally” associated with the application of remote sensing in agriculture. The incentives
behind actions taken within this value chain primarily revolve around the improvement of
regulatory compliance as well as achieving environmental sustainability. This deviation from the
typical dynamic of an agricultural case makes it a unique and interesting study into the application
of remote sensing in the management of public agricultural funds.
We have a short case titled Assessing Geese Damage in The Netherlands which has some parallels
with this case given it involves the monitoring of grasslands in The Netherlands for wild geese
activity.

1.4 More About the Study
Each case study analysed in SEBS, focuses on products and services which use data coming from
Sentinel satellites, measuring the impact of that product or service throughout the value chain. The
starting point is the primary user of the satellite data, followed by a step-by-step analysis whereby
the operations of beneficiaries in each subsequent link of the value chain are analysed, all the way
down to citizens and society.
In this process, the main aim is to understand and demonstrate the value which is generated using
satellite-based Earth Observations (EO) and particularly the data coming from the Copernicus
Sentinel satellites. Each case study thus underlines the causal relationship between the use of
Copernicus Sentinel satellite data and benefits resulting from their use, including increased
productivity, more efficient and environmentally friendly operations, economic gains and improved
quality of life, among others. The evaluated and demonstrated benefits can be used by:

   ▪   Decision makers: Having access to a portfolio of concrete cases where the benefits from the
       operational use of Sentinel data in decision making are clearly articulated, helps decision
       makers not only to justify future investments but also to direct them towards areas that
       most matter in their country or organisation.
   ▪   Users: Moving beyond a vague idea of how EO services can support more effective
       operations requires a concrete understanding of the benefits they can actually bring in
       similar cases. In this regard, it is both numbers and stories that can resonate with users and
       attract them to explore further or deeper uses of EO in their operational activities.
   ▪   Service providers: Solid argumentation around the economic and environmental benefits
       stemming from the use of EO, coupled with powerful storytelling, can become an effective
       marketing tool for service providers seeking to promote their solutions and for EARSC to
       promote the sector.
   ▪   Citizens: The analysis conducted within SeBS is presented in an accessible language for the
       wider public. In particular, the powerful storytelling and the explanation of how the data is
       used help citizens to understand how public investments (in Copernicus Sentinels) return
       significant benefits to their everyday lives and to multiple neuralgic sectors for economy and
       society.

SeBS-CR-010                                     Page 10                                     May 2021
In the framework of this project, 20 case studies will be developed with reports to be published on each one. The study has started in March 2017 and will end in mid-2021. 1.5 Acknowledgements We wish to thank the following persons for their time spent talking with us to develop the case. In particular: Kaupo Voormansik – KappaZeta Jürgen Lina - KappaZeta Kai Raudvere – Estonian Agricultural Registers and Information Board Roman Belov – Estonian Agricultural Registers and Information Board Ahti Bleive – Estonian Agricultural Registers and Information Board Due to COVID-19 travel restrictions all interaction with KappaZeta and ARIB was conducted remotely. SeBS-CR-010 Page 11 May 2021
2 Grasslands in Estonia
2.1 The importance of grasslands
Grassland is of high importance for the maintenance of biodiversity all around the world. In the EU,
grassland makes up over 20% of all land cover1, providing beautiful landscapes and habitats for
multiple species while simultaneously acting as a giant carbon “sink”, helping to reduce the CO 2
levels in our atmosphere.2
In simple terms “grassland” can be defined as ground covered by vegetation dominated by grasses,
with little or no tree cover.3 In the EU, a distinction can be made between production grasslands,
which have a primary fodder production function, and semi-natural grasslands that provide a large
range of ecosystem services including biodiversity.4
Grasslands act as key habitats for many species including various plants, butterflies, reptiles, many
birds and numerous mammals such as deer and rodent species. They also provide intrinsic
ecosystem services such as watershed protection and grazing. In general, grasslands are particularly
species-rich, with the table below showing the richness of species and variability of endemic species
groups across various types of terrestrial biomes.

                        Figure 2-1: Comparison of species richness across terrestrial biomes5

1 https://ec.europa.eu/eurostat/statistics-explained/index.php/Land_cover_statistics#:~:text=artificial%20land%20cover-
,Land%20cover%20in%20the%20EU,%25)%20was%20covered%20by%20grassland.
2   https://climatechange.ucdavis.edu/news/grasslands-more-reliable-carbon-sink-than-trees/
3   https://ec.europa.eu/environment/archives/life/publications/lifepublications/lifefocus/documents/grassland.pdf
4 https://ec.europa.eu/eurostat/documents/2393397/8259002/Grassland_2014_Task+1.pdf/8b27c17b-b250-4692-9a58-
f38a2ed59edb
5   https://www.greenfacts.org/en/biodiversity/figtableboxes/1012-richness.htm

SeBS-CR-010                                                  Page 12                                                 May 2021
As already stated, grasslands also act as valuable carbon sinks. The worldwide carbon sequestration
potential of grasslands is estimated to be between 0.01 and 0.3 giga-tonnes annually. In fact, soils
under grassland and forestry act as much better carbon sinks compared to soils under arable land,
so much so, that when grasslands are converted to arable lands it is estimated that their soil carbon
stocks tend to decline by an average of 60%.6
There are multiple types of grasslands in Europe, ranging from almost desert types dry grasslands
in Spain to humid meadows which dominate Northern Europe. Since almost all European grasslands
are more or less modified by human activity and have to a major extent been created and
maintained by agricultural activities, they are classed as the aforementioned “semi-natural
grasslands”, although their plant communities are natural. These grasslands are maintained
through farmers’ grazing and/or cutting regimes. There are also some more natural ‘permanent
grasslands’ that occur in Europe. The distribution of these is determined by natural conditions
including climate, topography and soil structure.3
Semi-natural grasslands include self-seeded herbaceous and shrub vegetation that can be used for
livestock grazing or simply left untouched by agricultural practices. Semi-natural grasslands include
the following:
• Lowland meadows and pastures including floodplain meadows, upland and alpine hay
meadows, limestone grasslands, lowland acid grassland and heathland, steppe grassland;
• Alpine and other mountainous rangelands;
• Mediterranean scrub/grassland;
• Boreal grasslands and wooded grasslands such as Baltic wooded meadows;
• Maritime grasslands of dune, cliff and machair.4
6 https://ec.europa.eu/eip/agriculture/sites/agri-eip/files/fg9_permanent_grassland_profitability_starting_paper_2014_en.pdf
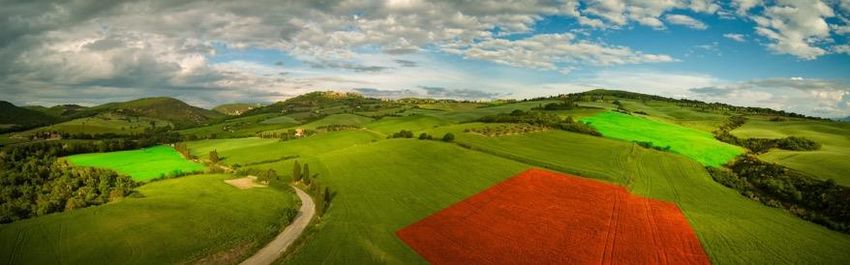
SeBS-CR-010 Page 13 May 2021Figure 2-2: Distribution of grasslands in Europe7 Semi-natural pastures and meadows are typified by extensive farming using traditional breeds of livestock and have a relatively low productivity compared with intensively managed grasslands. They are profoundly valuable for the large range of ecosystem services they provide. For example, they support the majority of EU farmland biodiversity, the majority of EU farmland carbon, and provide the majority of water catchment services on farmland. Such grasslands cover approximately one quarter of all EU farmland, but most are in poor condition.4 2.2 Grassland in Estonia As a small Baltic state situated towards the northern part of the world’s temperate climate zone, Estonia has a geographically and biologically diverse landscape, boasting 2,222 islands along its Baltic Sea coast, over 1,400 inland lakes and due to its geographical location, almost 50% of its land area is covered by dense Scandinavian forest, consisting primarily of pine, spruce and birch. In addition to this, Estonia has around 1.3 million hectares of agricultural land, nearly 1 million hectares of which are arable. During the Soviet era, arable land decreased by nearly 405,000 hectares, with much of it being converted to forest.8 Just a few generations ago agriculture was the 7 https://www.eea.europa.eu/data-and-maps/figures/grasslands 8 http://countrystudies.us/estonia/17.htm SeBS-CR-010 Page 14 May 2021
primary occupation of most Estonians, whereas nowadays only about 3% of the workforce is
engaged in agriculture. Cattle, pigs and poultry are the main farm animals raised in Estonia with the
primary field crops being cereals, potatoes and vegetables. Plant products are mostly for internal
use, however, a considerable amount of meat is imported.
Of Estonia’s 45,347km2 total land area (4.5 million hectares), 15.9% (7,210km2 or 721,000 hectares)
is classified as grassland.9 Large efforts have been made in recent years to restore parts of Estonia’s
grasslands, particularly alvar grassland along its Baltic Sea coast. An alvar is a biological environment
based on top of a limestone plain, with a layer of very thin soil (or sometimes no soil) that produces
sparse grassland vegetation. Alvars are found predominately in Northern Europe, with one third of
all alvar grasslands being situated in Estonia.
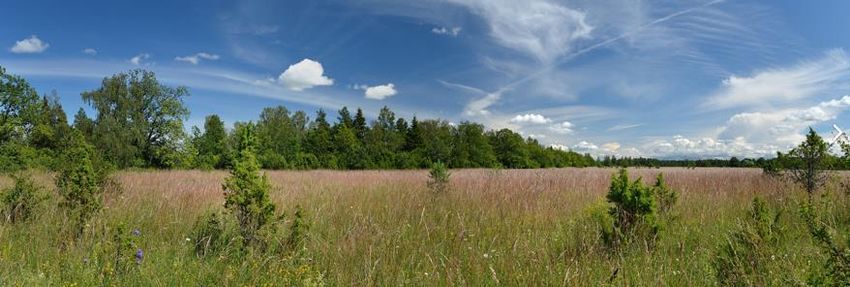
Figure 2-3: Alvar grassland in Northwest Estonia
LIFE to Alvars was a 5 year project, beginning in 2014 and ending in 2019 which aimed to restore
2500 hectares of alvar grassland in Estonia and create the necessary infrastructure to allow local
farmers to manage these areas after restoration10. The project was funded by the European
Commission’s LIFE programme and won the 2018 Natura 2000 award in the socio-economic
benefits category11. The project was carried out on 25 sites: 12 project sites on Saaremaal island, 6
on Hiiumaa island, 5 on Muhu island, 1 in Pärnumaa and 1 in Läänemaa in the west of the
country. See map below.
9 https://ec.europa.eu/eurostat/statistics-explained/index.php?title=File:Land_cover,_2015.png
10 https://life.envir.ee/english-project-life-alvars
11https://ec.europa.eu/environment/nature/natura2000/awards/application-2018/winners/socio-economic-
benefit/index_en.htm
SeBS-CR-010 Page 15 May 2021Figure 2-4: Map of the LIFE to Alvars project sites on Estonia's western coast The project was a success and reached its goal of increasing the amount of managed alvar grasslands in Estonia by over 2,500 hectares, in total bringing this number to 4,300 hectares as of 2019. The project also built the necessary infrastructure for grazing animals on restored plains, such as pasture gardens, collection gardens, shelters and ensured access for animals to water and access for people to the shoreline and pastures.12 The LIFE to Alvars project is a testament to the importance and reverence with which natural landscapes and grasslands are held in Estonia. Managing and maintaining all natural grasslands in Estonia is crucial to the flourishing flora and fauna that thrive amongst them, but also extremely valuable to the Estonian citizens who enjoy spending time in these beautiful parts of their country. 12 https://life.envir.ee/projekti-tulemused-results SeBS-CR-010 Page 16 May 2021
2.3 The relevance of the CAP in the regulation of grasslands

2.3.1 The EU’s Common Agricultural Policy
With a population of almost 450 million and a land area of 4.5 million km2, the EU has a lot of
mouths to feed and ecosystems to protect. The management of the food supply must remain
reliable, healthy and affordable while the natural balance of sensitive biomes must be carefully
controlled. The European Union’s agricultural sector has the enormous responsibility of ensuring
these requirements are met, day in, day out without fail. The vital role the agricultural sector plays
in all of our lives cements the sector’s standing as a perpetual economic powerhouse, meeting our
daily needs while also supporting the livelihoods of millions of people. Given its positioning, the
never-ending pressures and challenges the agricultural sector faces are immense and the economic
environment it currently faces is set to remain uncertain for some time to come. Globalisation,
financial crises, climate change and the volatile costs of farming inputs are only a few of the many
threats it must grapple with on a constant basis. In that context, we must rely on the European
Union’s Common Agricultural Policy, (often referred to as the “CAP”) to dictate how we meet all
of our food production needs, support our economies and remain sustainable while simultaneously
navigating the constant threats and challenges that present themselves.13
The CAP is one of the most overarching, ever-present and sometimes controversial EU policies in
operation. Since its adoption in 1962, it has moulded how agriculture in the EU is managed, from
keeping food production competitive and secure to ensuring farmers are supported and
compensated fairly. The CAP is therefore regarded as one of the most economically and politically
important policies the EU maintains. Due to the vital importance of its success, it’s no wonder that
we regard the missions of the CAP with such reverence while also holding its design and
implementation up to such detailed scrutiny.
The new CAP, which will be in force for the period between 2021-2027, is driven by nine key
objectives14:
                 •    to ensure a fair income to farmers;
                 •    to increase competitiveness;
                 •    to rebalance the power in the food chain;
                 •    climate change action;
                 •    environmental care;
                 •    to preserve landscapes and biodiversity;
                 •    to support generational renewal;
                 •    to maintain vibrant rural areas;
                 •    to protect food and health quality.

13   https://ec.europa.eu/info/food-farming-fisheries/key-policies/common-agricultural-policy_en
14   https://ec.europa.eu/info/food-farming-fisheries/key-policies/common-agricultural-policy/future-cap_en

SeBS-CR-010                                                  Page 17                                          May 2021
Figure 2-5: The 9 CAP objectives for 2021-2027 As the name suggests, it is a common policy applied equally across all EU countries to ensure fairness in the EU’s internal agri-food market. With around 10 million farms in the EU, and 22 million people working in the sector, the CAP must try its best to work for everyone, which is no small task. The following sections will discuss how the CAP works in practice and where it intersects with this case. 2.3.2 The CAP in practice Farming is not like other businesses as there are certain considerations that position it in a uniquely fragile operational environment. For instance, the average farmer’s income is around 40% lower than the average non-agricultural income. Farming also relies much more on weather conditions and the climate compared to other industries with its operability being much more uncertain due to the constant threats of extreme weather events and changing climates.15 A further important distinction between farming and other “production” businesses is the inevitable time lag in farming. Crops and animals require more time to replenish their stocks and mature, often with crops this is in an annual or semi-annual cycle, whereas with livestock it can take years. Compare this to a factory producing components for the automotive industry; production can quickly and dynamically be increased or decreased depending on market demands. All of this means that farmers often require support to maintain a stable and sustainable business. There are three primary ways in which the CAP helps: 15 https://ec.europa.eu/info/food-farming-fisheries/key-policies/common-agricultural-policy/cap-glance_en SeBS-CR-010 Page 18 May 2021
•    The CAP provides farmers with income support, through both direct payments and through
            remunerations for maintaining environmentally friendly practices which would typically not
            be rewarded by the market.
       •    Interventions are made in the market to boost demand or prevent crises from escalating
            or becoming unmanageable. For example, certain products (such as wheat, barley or rice)
            are bought, stored and sold back into the market at a later date by EU countries to help
            maintain price stability.
       •    Rural development measures are put in place via national and regional programmes to
            help address region specific challenges. The European Agricultural Fund for Rural
            Development (EAFRD) is a funding instrument of the CAP which supports rural
            development projects and strategies which help maintain the prosperity of rural regions
            across Europe.
In 2020, the CAP budget was €58.12 billion, of which the vast majority (€40.6 billion) went to income
support. To put the CAP budget into perspective, it makes up over one third of the entire EU budget
(the entire EU budget was €168.68 billion in 2020). This fact alone emphasises the importance and
prominent role of the CAP within the EU’s framework.16
The laws and policies within the CAP are regularly reviewed and updated by the European
Commission in consultation with agricultural committees and civil dialogue groups with the
intention of shaping the CAP to best serve the agricultural sector. When planning to introduce new
legislation for approval, the Commission will also conduct impact assessments to understand how
the new legislation could affect agricultural practices in order to allow the decision makers (the
European Parliament and Council) to make better informed decisions on such important topics.
The CAP is revised or “reformed” cyclically, following the setting of the EU’s long-term budget, the
Multiannual Financial Framework Package, or MFF for short. The last CAP was agreed upon in 2013
and came into operation for the period between 2014-2020. In 2018 the Commission proposed new
legislative changes to the CAP for the period lasting between 2021-2027. These proposals hope to
improve the CAP and allow it to contribute greatly to the European Green Deal, the Farm-to-Fork
strategy and the biodiversity strategy. In October 2020 agricultural ministers from EU member
states reached an agreement on reforming the CAP for the 2021-2027 period which places a strong
emphasis on reaching climate and environmental commitments.17
The European Commission also regularly undertakes public opinion surveys to understand such
metrics as the general public perception of the CAP, how the public understand the inner workings
of the CAP and how much it matters to them.18

16   https://www.europarl.europa.eu/factsheets/en/sheet/106/la-financiacion-de-la-pac
17   https://www.dw.com/en/eu-states-agree-on-agricultural-policy-reform/a-55343279
18   https://ec.europa.eu/info/food-farming-fisheries/key-policies/common-agricultural-policy/cap-glance/eurobarometer_en

SeBS-CR-010                                                 Page 19                                              May 2021
2.3.3 Common monitoring and evaluation framework
In order to understand the effectiveness of the CAP and how to improve its efficiency, the European
Commission has set up what is known as the common monitoring and evaluation framework
(CMEF). Through this initiative, they can closely evaluate how the CAP is working in order to help
design better policies in the future, help set programme objectives and allow for better
transparency in accounting for public expenditure. This framework foresees that the CAP
implementation is monitored via a large number of key performance indicators, which are grouped
into the following indicator types19:
• Context indicators describing general information relevant to the policy (such as the
amount of agricultural land available or information on the average age of farm managers);
• Income support and market measure output indicators, which provide information on, for
example, the number of beneficiaries of CAP income support;
• Output indicators monitoring EU policies on rural development, for example, on the public
expenditure for investment;
• Results indicators for the income support elements of the CAP measuring the direct and
immediate effects of interventions (for example the percentage of farmers income which
came from income support);
• Rural development results indicators assessing the effect of rural development policy,
such as preventing soil erosion and improving soil management. Most of these indicators
are also target indicators. In addition, rural development complementary result
indicators aim to assess the net effect of CAP intervention;
• Target indicators used to set quantified objectives at the beginning of the programming
period for the rural development policy (some of which correspond to result indicators);
• Impact indicators measuring the impact of policy interventions for the longer term and
when there are effects beyond the immediate period (of which some are also included in
the context indicator set).
Based on the groupings above, the Commission provides annual updates of key data indicators
which reflect the current situation within which the CAP is operating. An excerpt of just some of
the parameters which are monitored is shown in the figure below. Each indicator has an associated
spreadsheet which provides further detailed information at both member state and regional level.
19https://ec.europa.eu/info/food-farming-fisheries/key-policies/common-agricultural-policy/cmef_en
SeBS-CR-010 Page 20 May 2021Figure 2-6: Some of the CAP context indicators 201920 Since 1993, The European Commission’s Joint Research Centre (JRC) has used remote sensing and space technologies to contribute to agricultural monitoring. The JRC operate the Monitoring Agricultural Resources (MARS)21 initiative, which uses satellite data to produce regular bulletins on crop yield forecasts and is a key part of the Integrated Agricultural Control System (IACS), which is at the core of CAP implementation in Europe. Within the CAP, the Good Agricultural and Environmental Conditions (GAEC) standard deals with issues regarding soil (erosion, organic matter and structure), minimum levels of maintenance, the protection and management of water resources, and the maintenance of permanent pasture areas. The JRC promotes the use of remote sensing and GIS in the implementation, management, and monitoring/control of the GAEC. It also works toward the optimisation of the definition and control of GAECs through the exchange of best 20 https://ec.europa.eu/info/sites/info/files/food-farming-fisheries/farming/documents/cap-context-indicators- table_2019_en.pdf 21 https://ec.europa.eu/jrc/en/mars SeBS-CR-010 Page 21 May 2021
practices and supports the development and promotion of methods using traceability, quality,
certification and record-keeping at farm/parcel level.22

2.3.4 Income support and “Greening”
As already discussed, farmers receive income support to reward them for maintaining
environmentally sustainable practices which typically would not be rewarded by the market itself.
One such initiative within the CAP is known as “greening”. The “green direct payment” (also simply
referred to as greening) supports farmers who adopt environmentally friendly practices with direct
payments and is covered under EU Regulation No. 1307/2013.23 Ensuring farmers maintain
environmentally friendly practices is of huge importance to the EU in terms of meeting its climate
and environmental commitments, but also to the farmers themselves. Farmers’ livelihoods depend
on natural resources, such as soil and water, and their practices are greatly affected by the state of
the environment in which they work, climatic conditions and the biodiversity of the ecosystems
which provide them with both farming inputs and outputs. Therefore, the continuation and
maintenance of so called “green” practices bring value to farmers in supporting the longevity of
their operations.
What is often overlooked is the fact that the general public also benefit from greening. Almost half
of the EU’s land area is classified as farmed land, therefore a huge responsibility lies with EU farmers
in the management and maintenance of European land for all citizens living amongst it. The careful
preservation of natural resources, beautiful landscapes and water sources is what is known in
economics as a “public good”, meaning it is a commodity that is made available to all members of
society for “free”, albeit paid through public taxation. The monetary compensation paid to farmers
by the EU for the sustainable management of farmland is a prime example of a public good payment
scheme in action.
EU member states must allocate around 30% of their income support to greening24, with farmers
receiving direct payments if they comply with three mandatory environmentally beneficial
practices:
       •    Crop diversification: Maintaining a diverse range of crops on land helps ensure soils remain
            resilient and don’t get drained of nutrients, which can happen when monocultural practices
            are followed. There are some high-level requirements to ensure diversification is
            maintained:
                 o Farms with more than 10 hectares of arable land must grow at least two crop types.
                 o Farms with more than 30 hectares of arable land must grow at least three crop
                     types.
                 o The primary crop on these lands must not take up more than 75% of the total land
                     area.

22   https://ec.europa.eu/jrc/en/research-topic/agricultural-monitoring
23   https://eur-lex.europa.eu/legal-content/EN/TXT/PDF/?uri=CELEX:32013R1307&from=EN
24   https://ec.europa.eu/info/food-farming-fisheries/key-policies/common-agricultural-policy/income-support/greening_en

SeBS-CR-010                                                   Page 22                                            May 2021
o Some exemptions are also in place to these rules which are dependent on the
circumstances, for example, maintaining large areas of grassland rather than the
maintenance of multiple crop types can also be a viable alternative as grassland
itself helps ensure biodiversity.
• Ecological Focus Areas (EFAs): Farmers with more than 15 hectares of arable land must
dedicate at least 5% of this to what is called an Ecological Focus Area, these include
hedgerows, trees and fallow land. This in turn helps ensure biodiversity in the area.
• Permanent grassland: Grassland helps maintain biodiversity, protect the habitats of
multiple species and even sequester CO2 from the atmosphere. Grassland is therefore seen
as an extremely beneficial commodity when it comes to greening. A careful balance must
be maintained between farmed land and grassland (or permanent pasture) within a
country, with this ratio being set by EU member states themselves at either national or
regional level.
Greening payments are also automatically paid to farmers who qualify as “organic farmers” as the
nature of their work alone is seen as environmentally sustainable. Farmers who do not respect the
greening rules do not receive greening payments and since 2017 national governments are also
able to impose penalties (on top of the loss of greening payments) on uncompliant farmers.
In 2016, holdings subject to at least one greening measure covered 78% of all EU agricultural land
area. The table below gives a breakdown of this at Member State level.
Figure 2-7: Percentage of holdings subject to one or more greening measure per member state 25
The greening measures, however, are not without their criticisms. Numerous environmental NGOs
have made their dissatisfaction over the CAP’s impact on habitats, landscapes and biodiversity
clear. They accused the EU of “greenwashing”26 and selectively choosing only positive messages to
25 https://ec.europa.eu/info/sites/info/files/food-farming-fisheries/key_policies/documents/ext-eval-payment-practices-
climate-leaflet_2017_en.pdf
26 https://www.euractiv.com/section/agriculture-food/news/ngos-criticise-commission-over-cap-impact-on-biodiversity/
SeBS-CR-010 Page 23 May 2021communicate from an EU funded but independently carried-out study entitled “Evaluation of the
CAP on habitats, landscapes and biodiversity”.
Amongst the numerous conclusions of this study27, the following key conclusions were emphasised:
• The presence of the CAP has raised Member States’ ambition towards addressing
biodiversity objectives as well as the level of funding, although more could be done by
Member States to ensure that their biodiversity priorities are reflected in their decisions
concerning national agricultural policy;
• Member States have not made sufficient use of the available CAP instruments and
measures to protect semi-natural features, in particular grassland, or ensured that all semi-
natural habitats that have the potential to be farmed are eligible for direct payments;
• Member States could have used a wider range of CAP instruments and measures to support
the co-existence of agriculture with biodiversity.
In addition to these conclusions, the following key recommendations were made:
• To maximise the benefits which can be achieved for biodiversity from available CAP
funding, a higher priority should be given to focusing CAP instruments and measures that
have biodiversity objectives on maintaining the extent and quality of semi-natural habitats
that depend on agricultural or forest management (in particular habitats protected by the
Birds and Habitats Directives and semi-natural habitats used by species protected under
that legislation), where these are at risk, and especially within Natura 2000 areas;
• Member States should be required to ban ploughing/conversion of all permanent grassland
in all Natura 2000 sites (unless it has been mapped as grassland of a type which does not
require protection under the Habitats Directive) and on all permanent grassland outside
the Natura 2000 sites which requires such protection;
• Member States should make CAP support available on all semi-natural grassland, heathland
and wood pasture habitats which require agricultural management, by adopting a wider
definition of “permanent grassland”.
It is clear from this report and its findings that in future CAPs, the maintenance of biodiversity,
landscapes and habitats will play a hugely important role.
2.3.5 Estonian subsidy payments for the maintenance of grassland
The management and distribution of CAP subsidies is handled at national level, with each Member
State having at least one paying agency and the larger states often having multiple agencies
covering different regions (or sometimes different commodities) within the country.28 The Estonian
Agricultural Registers and Information Board (ARIB) are the sole agency in charge of CAP payments
27https://ec.europa.eu/info/sites/info/files/food-farming-fisheries/key_policies/documents/ext-eval-biodiversity-final-
report_2020_en.pdf
28 https://ec.europa.eu/sfc/en/system/files/ged/Paying%20Agencies%20List.pdf
SeBS-CR-010 Page 24 May 2021You can also read