Maritime industry processes in the Baltic Sea Region - Synthesis of eco-inefficiencies and the potential of digital technologies for solving them
←
→
Page content transcription
If your browser does not render page correctly, please read the page content below
Maritime
industry
processes in
the Baltic Sea
Region
  Synthesis of eco-inefficiencies and
  the potential of digital technologies
  for solving them

                                               ECOPRODIGI
                                  RESEARCH REPORT 2020
                           Elisa Aro, Niels Gorm Malý Rytter,
                                              Teemu Itälinna

                     1
PUBLISHED BY:
ECOPRODIGI Project
Pan-European Institute, Turku School of Economics
University of Turku
Rehtorinpellonkatu 3
FI- 20014 University of Turku, Finland

Project website: www.ecoprodigi.eu

We wish to thank Interreg Baltic Sea Region Programme
and national funders for financing the ECOPRODIGI
project as well as all the project partners and associated
partners involved for their contributions.

The content of this publication reflects the views of the
authors, which do not necessarily reflect the views of
the funding organisations.

                                                             2
CONTENTS
EXECUTIVE SUMMARY                                                              4

1. INTRODUCTION                                                                5
     ECOPRODIGI project                                                        6
     Aim and content of the synthesis                                          9

2. MONITORING DIGITAL PERFORMANCE OF VESSELS                                  10
 2.1. Case Island Ferries                                                     10
     Description of the case and methods                                      10
     Current state and the most critical eco-inefficiencies                   11
     Potential of digital technologies for solving the eco-inefficiencies     14
 2.2. Case J. Lauritzen                                                       17
     Description of the case                                                  17
     Current state and the most critical eco-inefficiencies                   17
     Potential of digital technologies for solving the eco-inefficiencies     19
 2.3. Challenges and requirements related to digital performance monitoring   22

3. OPTIMISING CARGO STOWAGE PROCESSES                                         24
     Description of the case and methods                                      24
     Current state and the most critical eco-inefficiencies                   25
     Potential of digital technologies for solving the eco-inefficiencies     26
     Challenges and requirements                                              30

4. OPTIMISING SHIPYARD PROCESSES                                              31
     Description of the case and methods                                      31
     Current state and the most critical eco-inefficiencies                   33
     Potential of digital technologies for solving the eco-inefficiencies     37
     Challenges and requirements                                              38

5. FUTURE DEVELOPMENTS OF MARITIME INDUSTRY DIGITALISATION                    41

6. CONCLUSIONS                                                                44

REFERENCES                                                                    47

                                           3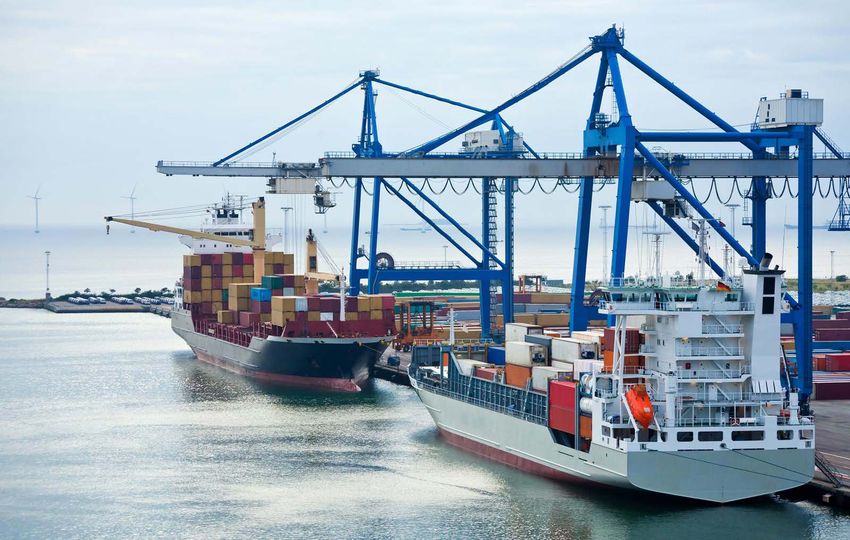
EXECUTIVE SUMMARY
ECOPRODIGI (2017-2020) is an Interreg Baltic Sea Re-              segments, routes and their baseline situations. The re-
gion flagship project, which links research organisations,        ductions are possible to achieve by taking such actions
enterprises, associations and business support organisa-          as capitalising on the latest digital technologies, utilising
tions. Altogether, 21 partners jointly investigate the most       and analysing real-time operational data and vessel per-
critical eco-inefficiencies in maritime processes in the          formance, anticipating operating conditions and mainte-
Baltic Sea Region as well as develop and pilot digital            nance of the ship and its components, changing working
solutions for improving the eco-efficiency by focusing            methods and improving practices as well as placing a
on three specific cases:                                          focus on the training of personnel.
                                                                    2) In the second case, ‘cargo stowage optimisation’ the
  1) digital performance monitoring of vessels,                   project partners identified a set of eco-efficiency bottle-
  2) cargo stowage optimisation at ports and                      necks in the cargo stowage processes at ports that can
  3) process optimisation at shipyards.                           be subject to improvement. The use of advanced digital
                                                                  technologies can contribute to more efficient utilisation
Furthermore, looking towards the future, the project              of vessels and terminal operations. The port stays can
partners, on one hand, create a digitalisation roadmap            be reduced, and, thereby, vessels can sail more slowly
and training modules for future decision makers in the            and reduce fuel consumption and emissions. Moreo-
maritime industry but also reach out to policymakers              ver, when stability calculations improve due to further
to engage them in discussion regarding how they can               digitalisation of cargo unit data, the ship can be loaded
support the digital change.                                       more optimally and the amount of ballast water can
  This report provides an overview of the project and             potentially be decreased without compromising safety,
main findings achieved to date, describes the main                which again reduces fuel consumption on the sea leg. It
eco-inefficiencies identified and presents the potential          is estimated that fuel consumption and emissions can
of digital technologies and new concepts for improving            potentially be reduced by 2-10% per route and ship and
them. Also, as the current digital transformation relates         that additional benefits can be gained on the landside
to the way how changes are managed in organisations,              due to future digital decision support tools applied for
this report presents the main challenges and require-             the end-to-end stowage process. In addition, improved
ments identified in the process of moving towards more            cargo unit pick up time estimates can be provided to
digitalised business operations. Finally, the last section        customers waiting for the cargo to be handled at port,
looks at the maritime sector from a broader perspective           whereby the service improves.
and provides some ideas about the most likely future                3) In the third case, ‘process optimisation at shipyards’,
developments.                                                     improved situational awareness and process manage-
  The main findings of the project so far indicate that           ment, including the use of new technologies, such as 3D
major improvements in eco-efficiency can be carried               and solutions for managing the complex supply chain,
out in the maritime industry. They can be summarised              have potential for improving the shipyard processes
as follows:                                                       aimed at increased eco-efficiency. For example, in block
  1) In the first case, ‘digital performance monitoring’,         building phase 3D technology reduces lead-time and
the project partners estimate, for instance, that fuel con-       potentially saves hundreds of man-hours in rework due
sumption and emissions can potentially be reduced by              to the fact that more efficient processes and proactive
2-20% based on data and analysis from distinct ship               actions are enabled.

                                                              4
1. INTRODUCTION
Shipping remains the dominant transportation mode as                (see e.g. Eyring et al. 2010; Madjidian et al. 2013; Schippl et
80-90% of international trade in goods is carried on sea. It        al. 2013; Cogliolo 2015; Lister 2015; Shi et al. 2018).
is relatively cheap and efficient compared to other trans-            The need to reduce emissions not only concerns the
port modes, and its significance is not expected to de-             shipping companies and cargo transporters, but also the
crease. As 15% of the global cargo traffic is handled in the        shipyards that build the vessels. The ships need to be
Baltic Sea, it is one of the busiest intersections of marine        designed and built in a manner that complies with envi-
traffic in the world. There are some 2,000 ships operat-            ronmental standards and contributes to reduced emis-
ing in the Baltic Sea at the same time, and the maritime            sions when ready to sail on the sea; similarly, the ship-
traffic, as well as the size of the ships, continues to grow.       building process needs to be planned and carried out
Considering the emissions per tonnes of cargo, shipping             in a way that attains environmentally sustainable goals.
is a rather ecological mode of transport, but the mari-             Shipyards are large and complex operating environments
time sector is responsible for a significant amount of total        with thousands of employees working on different man-
emissions globally. As a result of fuel consumption, ships          ufacturing processes at the yard. Moreover, the number
generate sulphur oxides, nitrogen oxides, particulate mat-          of companies operating at a shipyard is high since many
ter and carbon dioxide. The maritime industry also has              subcontracted enterprises operate in the same environ-
other negative ecological impacts, notably the transfer             ment. Therefore, the way in which the ships are built has
of aquatic species through ballast water, the discharge of          a significant impact on the environment. In addition, the
oil, garbage and sewage, anti-fouling pollution and vessel          management of this large operational environment, in-
scrapping. As the transport volumes are expected to grow            cluding implementation of new ecologically sustainable
in the future, there is a clear need for reducing emissions         and digital solutions, requires specific know-how.

                                                                5
ECOPRODIGI project
The Interreg Baltic Sea Region flagship project ‘Eco-effi-           21 project partners and six associated partners from
ciency1 to maritime industry processes in the Baltic Sea             around the BSR are involved in the project (see Table 1).
Region through digitalisation’ (ECOPRODIGI) was initi-               ECOPRODIGI is a unique initiative in the sense that ap-
ated to respond to several arising challenges maritime               proximately half of the 21 project partners represent pri-
enterprises currently face, as the project plan states. One          vate companies operating in the maritime industry. The
of the challenges relates to the aforementioned state of             great number of industrial partners means that all the
the environment. Environmental requirements increas-                 challenges identified and solutions created for solving
ingly add pressure to organisations to find new solutions            the challenges derive from real industry needs.
that contribute to reaching environmental targets. This                As drafted at the application phase, the project en-
is something that both regulators and end-customers                  compasses several work packages (WP) and technology
call for. Additionally, global competition is fierce, and            application cases (see Figure 1). In sum, the project maps
maritime organisations need to find efficient means in               out the most critical eco-inefficiencies in the maritime
order to compete in productivity and at attractive price             industry, and based on the work, develops and pilots
levels, simultaneously adding value to customers. Digi-              eco-efficient digital solutions and concepts to respond
talisation offers enterprises novel solutions to improve             to the identified needs. The eco-inefficiencies are iden-
the situation. The benefits of digitalisation have been              tified and solutions and concepts are developed within
widely discussed during recent years, and several in-                three different technology application cases taking into
dustries are making great efforts to capitalise on them.             account almost the whole life cycle of the vessel with
Yet, for a long time, maritime industry enterprises were             a special focus on 1) digital performance monitoring, 2)
reputed to follow a slower pace in this development.                 cargo stowage optimisation and 3) process optimisation
More initiatives from the industry were called for, and              at shipyards. Moreover, based on the work carried out in
this encouraged a group of Baltic Sea Region (BSR) or-               the technology cases, the project will look into the future
ganisations to initiate this new collaborative project, and          in several ways. First, the project produces a digitalisa-
take action in this respect. The implementation period               tion roadmap for the maritime industry so that maritime
for ECOPRODIGI is set for the years 2017-2020.                       actors can compare their actions with it and further de-
    ECOPRODIGI seeks to increase eco-efficiency in the               velop their work in a pragmatic manner towards a more
BSR maritime industry by creating and piloting digital               eco-efficient direction. Second, the project creates and
solutions, as well as providing guidelines for future de-            pilots training modules in order to support the learn-
velopment. The effort is carried out through the intensive           ing of future maritime industry leaders and employees.
collaboration of industry end-users and research organ-              Third, the project involves policymakers by promoting
isations, as well as associations and business support or-           discussion with them and by producing policy briefings
ganisations. As defined in the project plan, ECOPRODIGI              and recommendations for how to support the digital
supports the BSR in becoming a forerunner in maritime                transformation that ultimately leads the BSR towards
industry digitalisation and clean shipping. Altogether,              improved eco-efficiency.

Eco-efficiency can be described as a combination of economic and environmental efficiency, or simply the process of creating more
1

value with less ecological impact (see e.g. Lehni 2000).

                                                                 6
TABLE 1. PROJECT PARTNERS

 PROJECT PARTNER                                    COUNTRY

 University of Turku (UTU), Lead Partner            Finland

 Aalborg University (AAU)                           Denmark

 Chalmers University of Technology                  Sweden

 University of South-Eastern Norway (HSU)           Norway

 University of Southern Denmark (SDU)               Denmark

 Carina Solutions Oy (Carinafour)                   Finland

 Centrum Balticum Foundation                        Finland

 Danish Maritime                                    Denmark

 DFDS A/S                                           Denmark

 Island Ferry Secretariat                           Denmark

 Klaipeda Science and Technology Park               Lithuania

 Machine Technology Center Turku Ltd                Finland

 Meyer Turku Ltd                                    Finland

 OSK-ShipTech A/S                                   Denmark

 Kockum Sonics AB                                   Sweden

 Logimatic Solutions A/S                            Denmark

 Sininen Polku Oy                                   Finland

 RISE Research Institutes of Sweden                 Sweden

 JSC “Western Baltic Engineering”                   Lithuania

 Vessel Performance Solutions Aps                   Denmark

 J. Lauritzen                                       Denmark

 ASSOCIATED PARTNER                                 COUNTRY

 ATS AB                                             Sweden

 Svendborg International Maritime Academy (SIMAC)   Denmark

 Polish Maritime Cluster                            Poland

 Seismo-Shelf LTD                                   Russia

 AS Tallink Group                                   Estonia

 Tallinn University of Technology                   Estonia

                                            7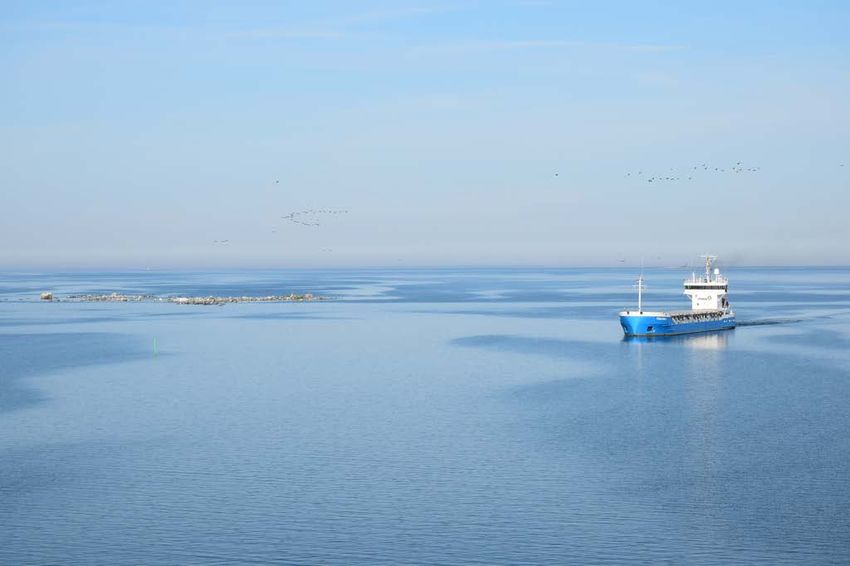
FIGURE 1. STRUCTURE OF THE PROJECT

              CASE 1:                      CASE 2:                       CASE 2:
      DIGITAL PERFORMANCE                OPTIMISING                   OPTIMISING
           MONITORING                  CARGO STOWAGE              SHIPYARD PROCESSES

                    WP1 PROJECT MANAGEMENT AND ADMINISTRATION

 WP2 EVALUATING MARITIME INDUSTRY PROCESSES AND TECHNOLOGY OUTLOOK
 • Technology outlook and horizon scan
 • Identifying the most critical eco-inefficiencies
 • Evaluating the potential for digital solutions in solving these challenges
 • Analysing the preconditions for applying them

 WP3 SOLVING ECO - EFFIENCY BOTTLENECKS THROUGH DIGITAL SOLUTIONS
 • Enrolling international expert teams to develop and pilot concepts of the digital case
   technologies
 • Piloting the technologies with the end-users and developing them further in collaboration
 • Collecting and sharing discovered best practices

 WP4 IMPROVING SEEDBED FOR ECO - EFFICIENT DIGITAL SOLUTIONS
 • Development of a digitalisation and eco-efficiency implementation roadmap
 • Creating and piloting a training programme for end-users based on best practices regarding
   eco-efficiency through digitalisation (incl. specific courses, games, workshops, seminars)

 WP5 STRENGTHENING PUBLIC SUPPORT FOR MARITIME INDUSTRY DIGITALISATION
 • Arranging policy workshops and seminars to discuss the outlook of digitalisation
 • Producing policy briefings and recommendations to support digitalisation and
   eco-efficiency in the Baltic Sea Region

                                              8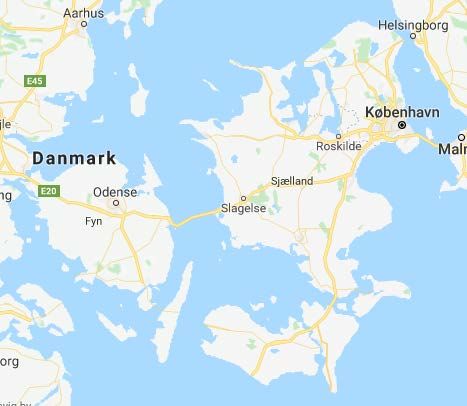
Aim and content
of the synthesis
This synthesis was developed under Work Package 2                       and business support organisations. More information on
‘Evaluating maritime industry processes and technology                  the collaboration and activities can be found under the
outlook’ (See Figure 1) of the ECOPRODIGI project, and                  description of each specific case in the following sections.
it represents the first publicly distributed report of the              The description of the project outcomes was mainly pro-
project and serves as a working document for further                    duced by the following authors based on contributions
project activities. This synthesis offers an overview of                from the participating project partners:
the results achieved so far in the aforementioned three
technology cases. The report summarises the eco-in-                     • Introduction: Elisa Aro and Teemu Itälinna,
efficiencies identified in the processes of the involved                   Pan-European Institute, University of Turku
end-users, and it introduces the digital technologies that
                                                                        • Sections 2 and 3: Niels Gorm Malý Rytter,
are currently in use and the most promising digital tech-
                                                                           Aalborg University
nologies and concepts for improving eco-efficiency. The
report also addresses challenges and requirements that                  • Section 4: Elisa Aro, Pan-European Institute,
the implementation of new technologies and concepts                        University of Turku
involves. On that basis, the report provides an outlook
for the future in regard to capitalising the benefits of                • Section 5: Teemu Itälinna, Pan-European
digitalisation. The focus is on the BSR, but the scope is                  Institute, University of Turku
global, as the solutions may be utilised anywhere.
                                                                        • Conclusions: all three authors contributed
  The work in the three technology cases was carried out
                                                                           to the content.
as a joint effort of different research institutions, enterprises

                                                                    9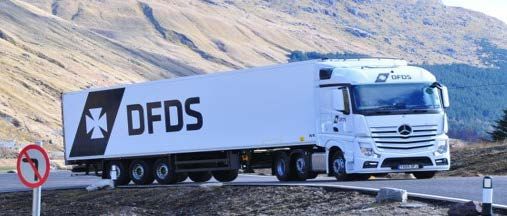
2. MONITORING DIGITAL
PERFORMANCE OF VESSELS
2.1. CASE ISLAND FERRIES                                              The visits immediately revealed that none of the ferries
                                                                    in 2018 had a set-up for permanent logging, storage or
                                                                    analysis of voyage performance data, which could sup-
Description of                                                      port daily and operational or tactical/strategic decisions
the case and methods                                                either onboard or onshore. Initially, this hampered the
                                                                    team of researchers, students and experts in gathering
The first technology case of ECOPRODIGI concerns the
                                                                    larger sets of baseline data for vessel performance as a
digital performance monitoring of different types of ves-
                                                                    basis for evaluating the current eco-efficiency potential
sels. Two different industry end-users are involved in this
                                                                    of the ferries. It was therefore decided to set up some
specific technology case. The first one is the Island Ferry
                                                                    intermediate solution logging data for a limited set of
Secretariat/Association, which is formed by 18 munici-
                                                                    days, voyages and operational parameters for the four
palities owning and operating approximately 25 ferries
                                                                    routes where this was possible. Based on data gathered
to small Danish Islands.
                                                                    from these sample voyages, the researchers were able
  The Island Ferries connect the Danish mainland to
                                                                    to obtain a rough indication of the following:
small islands of strategic importance, and their oper-
ations are supported financially by municipalities and
                                                                    • Typical routes, operational modes and profile
government in contrast to other Danish ferry companies,
                                                                       of vessel operations for voyages sailed
which are mainly privately owned and operated on a
commercial basis (with government incentive), such as,              • Time (min) and energy (kWh) spent across
Mols Linien, Ærø ferry, and Scandlines. The project in-                different modes of operations (harbour,
volves four out of the 25 ferries. An overview of the routes           manoeuvring, sea passage)
and ships in focus is presented in Figure 2.
  The Island Ferry routes for the four sample ferries are           • Energy production and consumption for each
generally short in duration, for example, from 25 to 65                specific operational characteristic, such as
minutes, which means that the ferries spend a significant              machinery, equipment and sailing/service
amount of their time in ports even though port opera-                  purposes.
tions are executed quickly.
                                                                    The gathering of additional data from sample voyages
  From the summer of 2018 to the spring of 2019, a
                                                                    was guided by a methodological framework originally
team of researchers and students from Aalborg Uni-
                                                                    developed by a team of researchers and included the
versity (AAU), University of Southern Denmark (SDU)
                                                                    following elements:
and experts from Danish Maritime, completed visits
and case studies of the four ferry routes to investigate
                                                                    • Definition of operational modes of the ferry
the current state of operational modes, processes, sys-
tems and eco-efficiency performance and to estimate                 • Identification of machinery for energy
the improvement potential from implementing digital                    provision/production on the ferry
performance solutions for the ferries.

                                                               10
FIGURE 2. FERRIES AND ROUTES IN THE PROJECT
FOUR ROUTES
r routes
Sejerø (1998)
SEJERØ (1998)
Length 48.5 m
• Length 48.5 m
Passengers 245 / Cars
• Passengers 36 36
245 / Cars
• Voyage time 65 min.
Voyage time 65 min.
Orø (2003)
ORØ (2003)
Length 41.9 m 41.9 m
• Length
Passengers 98 / Cars
• Passengers 19 19
98 / Cars
• Voyage time 25 min.
Voyage time 25 minutes
Skarø – Drejø (1996)
SKARØ – DREJØ (1996)
Length 35 m 35 m
• Length
• Passengers 98 / Cars 10
Passengers 98 / Cars 10
• Voyage time 70-80 min.
Voyage time 70-80 min.
Femø (1997)
FEMØ (1997)
Length 36.2 m 36.2 m
• Length
• Passengers 98 / Cars 18
Passengers 98 time
• Voyage / Cars 18
50 min.
Voyage time 50 minutes
• Identification of machinery and equipment state of digitalisation and eco-efficiency varies from route
for energy consumption to route, but generally there is significant potential for
further reducing fuel consumption and emissions across
• Estimation of time and energy consumption
all routes.
and production per operational mode. Type,
The four ferries which were included in the study
amount and load of machinery and energy
are between 15 and 22 years of age and are either sin-
consuming equipment in use.
gle- or double-ended ferries with diesel engines run-
See Figures 3-5 for a further introduction to the meth- ning mainly on marine gas oil (MGO) due to Sulphur
odology. Emission Control Area’s (SECA) regulation for sulphur
content of fuel (most of the ferries also have auxilia-
Current state and the most ry engines; however, one ferry had a shaft generator
instead). The ferries operate with limited vehicle and
critical eco-inefficiencies passenger carrying capacity (the largest ferry can carry
The Island Ferry Association decided to join this project up to 136 tons, 245 passengers or 36 cars). The ferries
as different municipal ferry companies have made lit- generally have instruments and monitors at the bridge
tle investment in technologies and processes for digital and/or in the engine room, enabling the crew to operate
performance monitoring over the recent years, but they the ferry safely in line with regulations. The monitors/
increasingly aim to operate their ferries in a more modern instruments on the bridge allow the navigators to have
and eco-efficient manner with less CO2 emissions. The a real-time overview of critical operational parameters,
investigations of researchers revealed that the current such as:
11• Vessel position (global positioning system, GPS) • A typical picture is that the operational modes
of manoeuvring and sea passage account for the
• Speed over ground (SOG), (GPS)
largest share of the energy consumption. Harbour
• Main engine revolutions per minute (rpm), power mode consumption will depend on the length of
(not always similar for auxiliary engines) and other the harbour stay or overnight consumption, which
measures in many cases will be a shore power connection
(where crew sometimes sleep on the ferry).2
• Fuel consumption of the main engine (three out
of the four ferries also had flowmeters installed); • During sea passage, the main engine produces
however, the crew did not trust current readings the energy, which is consumed as vessel propulsion.
due to lack of calibration of measurement The auxiliary engine typically generates power for
equipment (Femø, Orø), and for the last route, consumers as bow thrusters, other equipment (for
there was no flowmeter installed (Skarø/Drejø) example, pumps) onboard and the accommodation
(hotel load). On one ferry, an oil-fired boiler was
• Water depth (Electronic Chart Display and also used for other purposes, such as, heating the
Information System, ECDIS) accommodations and ventilating the kitchen.
On one of the ferries, a shaft generator was applied
• Wind direction and speed
instead of auxiliary engines for these purposes.
• Depth/under keel clearance (Eco-sounder,
• Main engine revolutions per minute (rpm), power
not present on all ferries).
(not always similar for auxiliary engines) and other
measures
However, few or none of the ferries were able to display
a real-time picture of other parameters, such as speed • During harbour stays, most of the energy for
through water (STW), trim, auxiliary engine/shaft gen- machinery and onboard systems, inclusive of, for
erator rpm and power, shore power, accommodation example, heating and lightning, is provided by the
consumption, exhaust gas temperature and engine room auxiliary engine (sometimes the main engine
temperature, among others. Bunker fuel consumption is might also remain running) but if duration of the
typically monitored through manual tank readings or by port stay is, for example, more than 15 minutes, as
summing up bills from weekly bunker purchases form- it is for overnight, then shore or no power is used
ing basis for calculating the ratio of fuel consumed to and the auxiliary engine is shut down.
nautical miles sailed, for example, per week and month.
• Several ferries appear over-dimensioned in
Based on sample voyages, particularly those of the
capacity, but also machinery and equipment size
Sejerø, Orø and Femø ferries, and applying the before
compared to the needs for most of the year or
mentioned model/framework on the gathered data, the
during voyages in general (for example, oversized
following was observed/concluded with the study:
auxiliary engines), and by commissioning smaller
and newer ferries to the routes in the future, there
might be a significant potential for saving energy
on some of the routes.
2
As an example, for the Sejerø ferry, energy consumption was approx. 100 L MGO for the sea passage and 3-5 L for port manoeuvring, and
for the port stay, it was approx. 10-40 L MGO (depending on if shore power was connected or if the auxiliary engine was running). The
distribution/pattern across the operational modes is, however, very route dependent, and it is different for some of the other routes.
12FIGURES 3–4. NORMAL FERRY OPERATION AND THE VOYAGE SEPARATED INTO MODES
‘HARBOUR, MANOEUVRE AND PASSAGE’, BASED ON OPERATIONAL DATA
Harbor Manoeuvring Passage Manoeuvring Harbor
Y2
2018-10-10 10:18 - 11:12
Y1
15.00
Langeland - Track speed (Knots)
80.00
Harbor Manoeuvring Manoeuvring Harbor
60.00 10.00
40.00
Passage
5.00
20.00
0.00 0.00
:10
:15
0
5
0
5
0
5
0
5
00
05
10
:4
:2
:5
:3
:2
:4
:3
:5
11:
10
11:
10
10
10
10
10
11:
10
10
10
10
Y1: Lever thrusters (100%)
Y2: Tracked speed (knots)
FIGURE 5. TIME AND FUEL SPENT IN DIFFERENT MODES
– IN PERCENTAGE OF TOTAL VOYAGE TIME AND TOTAL FUEL CONSUMPTION
TIME SPENT FUEL SPENT
Passage
Passage
Harbour
Harbour
Manoeuvre
Manoeuvre
Harbour Manoeuvre Passage
13Potential of digital • A sea trial for one of the routes under study
revealed that main engine fuel consumption,
technologies for solving for example, can be reduced by 5% by simply
the eco-inefficiencies planning and executing a slightly longer route on
There appears to be a visible potential for saving fuel deeper waters, even with increased speed, so
by operating the ferries differently. As an example, the desired transit time still can be met.
following tactics/practices can be applied:
• Several sea trials for a double-ender ferry revealed
that fuel consumption can be reduced by up to 15%
• Replan sailing routes to avoid shallow waters
by operating with an optimal push/pull distribution
• Adjust vessel speed depending on water depth of workload for the aft/fore thrusters compared
during routes with the less optimal settings for the ferry (current
daily operations are however not that far from
• Equivalently adjust vessel speed depending on optimal distribution of propeller workload).
wind and wave direction and speed
Based on the data collection and subsequent analysis
• Eliminate permanent (over)use of ballast water
of sea trial results from three of the four ferry routes,
and operate with more optimal draft/trim without
the research team estimated that there might be a sig-
compromising passenger comfort
nificant potential for reducing fuel consumption and
• Make smoother turns with vessels during sea emissions of Island Ferries in Denmark by up to 10-20%
passage and port manoeuvring per route compared with the 2018/2019 baseline totals.
Such results can be obtained in a relatively short time
• Execute port manoeuvring without the use of bow
based on further implementation of digital technol-
thrusters but still not compromising safety/
ogies for vessel performance monitoring, change of
collision avoidance
work and continuous improvement practices. Digital
• Shut down of equipment not in use solutions will enable ferry operators and land-based
staff to make future operational, tactical and strategic
• Optimal distribution of workload between fore and decisions, and to adjust, for instance, operational work
aft propeller for double-ender ferries practices based on robust evidence/data going forward
compared with what they are able to do at present.
• Data-driven hull/propeller cleaning
Without robust data sets and artificial intelligence (AI)
• Adjusting temperatures in engine room to increase models providing decision support, which is the case
ventilation for turbo charger today, it is difficult for ferry operators and leaders to
know the precise eco-efficiency impact of alternative
• Redesign sailing schedules and transit time to be
work and sailing schedule practices, as well as the ef-
more eco-efficient without compromising service
forts needed to retrofit and upgrade ships, machinery
frequency, or quality for citizens/clients
and equipment for the ferry routes.
• Increase use of shore power in port to reduce The ferry routes of the Island Ferry Association are
emissions and noise onboard for the crew and for owned and operated by local municipalities. The ferry
people living or working in the port zone. routes do not operate in competitive markets per se;
instead, they receive both municipal and government
Two examples of the potential of the above-listed support to remain economically and financially sustain-
tactics/practices are explained further: able non-profit entities. As a guiding principle, the ferry
routes generate a third of the revenue from tickets sales,
another third from municipality support and the last
14third from government funding. The ferries’ main ob- It was found that a digital end-to-end solution must
jective is politically determined: to deliver regular trans- perform for smaller ferries operating in coastal zones
portation services to islanders situated on small islands where it should enable high-frequency digital perfor-
around Denmark, which would likely be uninhabited if mance monitoring of ships, engines and systems. The
such services were not provided. For the Island Ferry solution concept should allow auto logging of up to
routes, the main goal of the digitalisation efforts is to 50-100 channels of data with high-frequency onboard
achieve a more green and sustainable ferry operation, sensors, as well as local storage, connectivity, onshore
which is part of the national and local government sus- cloud-based storage and subsequent data cleaning,
tainability and decarbonising strategy, before trying to modelling and analysis via state-of-the-art AI models/
realise cost savings from more fuel efficient operations scripts. Finally, results and decision support recommen-
which is considered as an added benefit. dations should ideally be visualised and user-friendly at
For the Island Ferries, the ECOPRODIGI project is an the same level as the most advanced engines, equipment
opportunity to raise digitalisation and eco-efficiency and vessel performance monitoring platforms typical-
to higher levels in close collaboration with academic ly applied for equivalent ships at the moment (see, for
partners (for example, AAU and SDU), Danish Maritime example, www.blueflow.se). The following elements of
and vendors; additionally, the improved branding val- the solution have been selected for further development
ue for local politicians of operating a state-of-the-art and testing within the scope of ECOPRODIGI:
eco-efficient fleet should not be underestimated. With
the ECOPRODIGI project, the Island Ferry Association • High-frequency, low-cost, scalable, flexible and
aims at achieving a long-term vision for digitalising and technically robust end-to-end digital Internet
decarbonising vessel operations. This implies getting a of Things (IOT) solutions for logging of bridge
real-time high-frequency end-to-end solution for digital and engine/systems data, local storage,
performance monitoring and decision support tested connectivity via 4G network in coastal zones
and demonstrated for the ferry routes. Additional in- and onshore cloud-based storage of data in a data
vestments in new ships and emission-free propulsion warehouse. Use of complementary national
technologies are likely to happen in the longer term to Automatic Identification System (AIS), ocean and
reap significant eco-efficiency benefits for the fleet and weather data sources to cross-validate data quality
remain on the politicians’ agendas for the future. when possible.
15• Display/visualisations of vessel and engine Regarding the benefit case for the listed initiatives, a
performance under various navigational and business case and set of visionary/stretch targets have
operational conditions based on high-frequency been set for ships, engines and crew/staff within test
data which can support crew onboard and scope during the project’s implementation period:
technical managers in executing their daily
vessel operations in a more eco-efficient manner, • Reduction in fuel consumption and emissions for
as well as enable condition-based, predictive vessels by 10-20% across ferry routes compared
maintenance of hull, propeller, machinery and with the 2017/2018 baseline due to improved
equipment. models for vessel operations and hull, propeller
and engine performance, as well as excess fuel
• AI models providing decision support for
consumption.
operational/tactical/strategic decisions to be made
by crew onboard and land-based staff and service • Prevention of rare but business- and safety-
personnel. critical and expensive engine breakdowns, seriously
impacting service levels for islanders and
• Dashboard/visual reports which quickly and
generating additional costs for replacement ferries
intuitively provide updated (real-time) feedback
(+2,000 EUR/day).
to vessels and crew on sensor data quality
and vessel performance for selected metrics/key After testing and implementing new digital solutions and
performance indicators (KPIs) and enable staff to work processes, a formal evaluation is planned of how
make ongoing improvements in energy efficiency. the initiatives meet the targets set for fuel consumption,
emissions and cost savings/return of investment. As a
• All of the above elements integrated into an
follow-up to the results, a range of smaller and medi-
existing open source software solution developed
um-size Danish ferry operators, representing both public
by one of the academic partners, SDU.
and private businesses, will receive a questionnaire from
• Training modules, as for example E-learning the research team with the purpose of creating a broader
applications, which can train crew onboard in overview of the current state and progress regarding the
‘theoretical and/or methodological’ aspects of application of digital performance monitoring solutions
operational data gathering and digital performance and eco-efficient work practices for vessel operations.
monitoring, as well as ensure that they acquire
continuous improvement, i.e.’kaizen’, skills to work
with ongoing energy efficiency improvements as
part of their daily work. Development and testing
of such modules might however become part of
future work to be done in the project.
162.2. CASE J. LAURITZEN monitoring which is Lauritzen’s own developed solution
(see Figure 6).
An additional input into the Vesper platform tested
Description of the case as part of the ECOPRODIGI project are datasets from
The second industry end-user in the technology case, sources such as AIS and weather forecast/hindcast pro-
‘digital performance monitoring’, is the shipping company viders which enable cross-validation of noon report data
J. Lauritzen (from now on Lauritzen), which operates a mod- and improved reliability/validity of performance models
ern, diversified fleet of bulk carriers and gas carriers. The and results.
company is owned by the Lauritzen Foundation, a commer- In the first digital solution, instruments, for example,
cial foundation with the objective of supporting shipping, flow meter values are read on a daily basis, and a dataset
culture, social humanitarian work and education. The com- is entered into a HTML form and submitted as mail files
pany employs a staff of approximately 1,000 employees of to onshore staff via satellite connection where the data
many different nationalities both at sea and onshore. The are stored in Lauritzen’s proprietary MS SQL Server da-
headquarters are in Copenhagen, and there are also offices tabase. From the data warehouse, data are then upload-
in the Philippines, Singapore and the USA. At the end of ed as XML files into the Vessel Performance SolutionsTM
year 2018, the company operated/controlled 109 vessels Vesper (cloud-based) platform, where performance
and employed 167 employees onshore and 638 seafarers monitoring and analysis are enabled. The Vesper soft-
onboard either on their own or bareboat chartered vessels. ware platform consists of a set of modules enabling
Revenue was 565 million USD, but came out with a loss of users to track individual ship or fleet performance for
–24 million USD. KPIs, such as hull and propeller (fouling) performance,
The project focuses on the gas carrier business, which specific fuel oil consumption (SFOC) of engine, base
per yearend 2018 consisted of 34 vessels of which 14 load consumption, charter party, boiler performance,
were the company’s own vessels. The particular focus bunkering and excess fuel consumption. The platform
is on six ethylene (E-class) gas carriers and options for also allows users to conduct ad hoc extensive analysis of
digitalising data capture, performance monitoring and operational data quality from the vessels, and produce
decision support for these ships. updated fuel tables, extract charter party statistics for
commercial purposes, consolidate monitoring, reporting
and verification (MRV) reports for the authorities and
Current state and the most perform other necessary actions. The performance de-
critical eco-inefficiencies partment, as well as the technical managers, are the main
users of the platform on a daily basis, and they are able
Over the last years, Lauritzen has invested significantly in
to track vessel performance and take required actions to
digital performance monitoring for their fleet with the ob-
improve energy and fuel efficiency in collaboration with
jective of achieving operational excellence and improving
crew onboard the vessels. The core part of the Vesper
on KPIs for safety, operational costs and customer service.
platform consists of a number of physical, mathematical
They embarked on their journey of digitalising their vessel
and statistical models called the ‘Vessel Performance
operations and performance monitoring almost a decade
Analysis engine’ (VPAe) which convert input data into
ago in order to become more fuel-efficient and increase
a robust overview of the energy efficiency of the ships
reliability of operations. Today, performance monitoring of
catering/normalising for factors such as wind, weather
the fleet is enabled via two complementary digital solu-
and the operational profile (for example, cargo, draft
tions: (1) noon report-based3 performance monitoring us-
and trim) of the vessels. The VPAe also provides a set
ing the Vesper platform (Vessel Performance SolutionsTM,
of recommendations for how to further reduce excess
Lyngby, Denmark) and (2) autolog-based performance
fuel consumption.
Noon reports are completed either when the sea state is changed (sea, port manoeuvring, port state) or approximately once per day (at noon).
3
17FIGURE 6. ILLUSTRATION OF LAURITZEN DATA VALUE CHAINS
AND VESSEL PERFORMANCE MONITORING SYSTEMS
Applications
Engine Performance
Vessel Performance Charter Contracting Regulatory Reporting
Analysis (VESPER /
(VESPER, MS Power BI) (VESPER, IMOS etc.) /MRV (VESPER)
Tekomar, MS Power BI
(VESPER etc.)
Validation
Data Quality Control
Data Storage
Onshore
Vessel Operations
Database (MSIS / Azure)
Acquisition
Noon-report Auto-log
Collection
Data
External data suppliers Human observation Sensors
Weather and AIS Bridge and Ship Machinery and Equipment (AMS) Energy Efficiency (LAN / WAN)
Catagory
Data
Wind, current, wave, Beaufort, Position, SOG, STW, draft, trim, ME, AUX equipment, cargo plant, Flow meter, Torsion meter
AIS position data (WNI etc.) heave, rotation data (NMEA) ballast water data (RS485, Yokogawa) (power) data (IP)
Lauritzen and another shipping company, Torm, re- tional Marine Electronics Association] standards). The
cently reported that the development and implementa- data loggers are currently being used in combination
tion of the Vesper platform to match their needs, which for logging average (or accumulated) values from more
was part of a Danish government-supported research than 200 sensors/data channels onboard the vessels
and innovation project called BlueInnoship, over a four every 2 minutes, and size and scale of the data sets
year period (2015-2019), saved the companies 4-7% in captured are very different to noon report data (ap-
fuel consumption (see Vpoglobal 2019). prox. 720 logs vs 1 per day). Results from data loggers
In the second solution, more than 10 of Lauritzen’s are written into a binary file with time stamps (time
ships have had data loggers (MW100 acquisition unit series data), and every 24 hours the file is closed, and
loggers [Yokogawa, Tokyo, Japan]) installed onboard an email is sent via mail gateway and 3G/4G or satel-
to enable high-frequency, two-minute interval log- lite connection onshore with the result. In the office,
ging from bridge systems and engine equipment. Data data are imported into Lauritzen’s MS SQL Server (a
sources include power meters (energy production), sort of data warehouse), and deployed and analysed
flowmeters (fuel consumption) and torsion meters on a more ad hoc basis using MS SQL Server Reporting
(power), as well as parameters such as position (GPS), Services (SSRS), MS SQL Server Analysis Services (SSAS)
speed, wind direction, and under keel clearance which (data are structured into cubes for fast access) and MS
are typically displayed at the bridge (via NMEA [Na- Power BI functionalities.
18Lauritzen has developed several modules and scripts for digital performance monitoring up running for the
which support a more ‘refined/detailed’ monitoring and whole fleet in the coming years.
analysis of sensor data quality, vessel operations and Such a digital end-to-end solution must perform for
performance based on the autologged data sets. How- ocean-going vessels operating and trading all over the
ever, at the current stage, these modules and scripts world on a 24/7 basis, where it should enable high-fre-
have not progressed to the extent and quality of the quency digital performance monitoring of ships, engines
Vesper platform. See Figure 7 for further information and systems. The solution concept should allow autolog-
about the current autolog performance monitoring set- ging of 200-500 channels of data with high-frequency
up of Lauritzen. onboard, as well as local storage, connectivity, onshore
cloud-based storage and subsequent data cleaning,
modelling, analysis via state-of-the-art AI models and
Potential of digital scripts. Finally, results and decision support recommen-
technologies for solving dations should be visualised and be user-friendly at
the eco-inefficiencies the same level as the currently most advanced engine,
equipment and vessel performance monitoring plat-
For Lauritzen, there is a continuing effort to enhance their
forms (such as the interfaces in Vesper). The following
digital set-up for digital performance monitoring as an es-
elements of the solution are the focus of development
sential element in making their fleet more cost competi-
and testing within the scope of ECOPRODIGI:
tive, green and fuel efficient in the future. The company’s
fleet operates in very competitive markets for either dry
• High-frequency, low-cost, scalable, flexible and
bulk cargo or LPG/ethylene products where freight and
technically robust end-to-end digital IOT solutions
vessel charter rates are generally on a low level and are
for logging of bridge and engine and systems
more volatile compared with what they were a decade
data, local storage, connectivity via satellite/4G
ago (see e.g. Danish Ship Finance 2018).
network, onshore cloud-based storage of data in
In addition, bunker prices have over the last decade
data warehouses.
been high and volatile, and they are likely to increase in
the near future, particularly for MGO and VLSFO, which • AI model/script for prediction of engine
in the future will be used by all Lauritzen vessels (of performance problems and/or faults based on
smaller size), and competitor fleets which are unlikely to high-frequency data (1 Hz) which can support crew
get scrubbers installed in the attempt to comply with the onboard and technical managers with condition-
International Maritime Organization (IMO) 2020 sulphur based and predictive maintenance, and thereby
cap regulation. improving engine and equipment uptime
To remain competitive and profitable, it is thus critical (preventing breakdowns) and performance in due
for Lauritzen to improve its fuel efficiency and reduce time, as well as reducing maintenance and repair
its operational expenses (OPEX) on an ongoing basis. costs, for example.
For Lauritzen, the ECOPRODIGI project is an opportu-
• AI models performing better (with less scatter,
nity to raise digitalisation to higher levels in close col-
improved accuracy and confidence) than current
laboration with academic partners (for example, AAU
VPAe models for estimating hull and propeller
and SDU) and vendors (Vesper and other enterprises),
performance (added resistance) and excess fuel
and reap additional eco-efficiency benefits from years
consumption of vessels due to such problems as
of investment and successful implementations. With
fouling, hull and propeller wear. Enhanced models
the ECOPRODIGI project, Lauritzen particularly aims
are developed not only relying on noon reports,
at achieving their long-term vision for digitalising and
but also hindcast weather and AIS position data
decarbonising vessel operations, which implies getting
and optionally high frequency autolog data.
a real-time high-frequency (1 Hz) end-to-end solution
19FIGURE 7. ILLUSTRATION OF LAURITZEN DATA VALUE CHAIN AND VESSEL PERFORMANCE
MONITORING SET - UP FOR AUTOLOG DATA
MS SSRS /
Bridge NMEA PowerBI for data
systems Insatech display to visualize and performance
performance and alarms analysis
MS Data
warehouse
(SSIS, SQL
server)
Log of mean Satellite or 4G
Sensors on
values every connection
systems
2 mins
@
Daily mail
Yokogava MW100 with autolog
data logger(s) dataset
With RS485
connection (slave) AAU Python
AUX Engine script(s) for engine
Control System via fault detection
Modbus RS485 (to be developed)
• ‘Vesper Performance Onboard Solution’, which will Regarding the benefit case for the listed initiatives, a
be a visual report/dashboard based on Vesper business case and set of visionary/stretch targets have
which quickly and intuitively provides real-time been set for the following factors within test scope dur-
feedback to vessels and crew on sensor/noon ing the project’s implementation period:
report data quality and vessel or engine
performance for selected metrics and KPIs and • Reduction in fuel consumption and emissions for
enables staff to make ongoing improvements of vessels of 2-4% compared with the 2017/2018
energy efficiency. baseline due to improved models for hull and
propeller performance.
• Training modules, for example E-learning
applications which can be used for training crew • Improvement of SFOC for main/auxiliary engines
onboard in ‘theoretical/methodological’ aspects of and emission reductions of 1-3% due to improved
operational data gathering and digital performance diagnosis of poor engine performance and fault
monitoring, as well as ensure that they acquire detection and proactive and/or timely
kaizen skills to work with ongoing energy efficiency maintenance.
improvements as part of daily work. Development
• Prevention of rare but business- and safety-wise
and testing of such modules might come later in
critical engine breakdowns.
the project.
20• It is also expected that ‘Vesper on Board’/ In this case, as well, after testing and implementing new
Dashboards solutions and related training digital solutions and work processes, a formal evaluation
programmes on the topic of digital performance is planned of to what degree the initiatives are either
monitoring for the crew will contribute to accomplished or are about to accomplish the visionary
additional reductions in fuel and energy targets set for fuel consumption, emissions and cost
consumption and vessel OPEX when implemented savings/return of investment.
during/after the project period. These initiatives
will enable crew to quickly detect and mitigate
data quality issues (errors in sensor/noon report
data) for the performance monitoring models.
Also, they will provide valid and real-time
information about energy performance for selected
KPIs and provide decision support on how to close
gaps to targets, thereby enabling crews to engage
in kaizen and to operate vessels and engines in
a more eco-efficient manner (in line with the Ship
Energy Efficiency Management Plan [SEEMP] and
MRV Scheme intentions).
212.3. CHALLENGES AND for reasonable costs to decision makers onboard and
onshore both in coastal zones and independently of
REQUIREMENTS RELATED where vessels of the shipping company are trading in the
TO DIGITAL PERFORMANCE world. It is relatively easy to acquire and purchase indi-
vidual technology components from different vendors,
MONITORING but it is a much more resource-demanding and difficult
challenge to integrate these components and ensure
In order to be able to implement the new digital technol- that they perform robustly in combination. Also, this is
ogies successfully and achieve target eco-efficiency ben- made even more complex when there is an overall lack
efits several factors are required and challenges need to of standards for, for example, operational data capture,
be solved. Several of the requirements and challenges storage and performance monitoring in the industry.
are similar between the two cases, Island Ferries and In both cases, domain expertise in shipping and engine
Lauritzen, but also some differences appear. operations combined with sufficient data availability and
Digitalisation and eco-efficiency must remain an es- quality of high-frequency data is required for researchers
sential part of the Danish national and local political and technology vendors to develop AI models which
agenda as well as part of the business and operations really can perform with high accuracy and quality. AI
strategy of Lauritzen in the years to come if digital im- models of good quality can thus guide decision makers
plementations are to proceed and eco-efficiency results in practice when they have to optimise vessel and engine
achieved. In terms of the individual Island Ferry routes, and/or equipment operations, maintenance and repair
they will thereby remain focused on digitalising the as well as deliver eco-efficiency benefits.
fleets and reducing fuel consumption, emissions and As far as both cases are concerned, researchers and
operational costs. Increased pressure to minimise public industry professionals must succeed in building AI mod-
spending in rural areas might also put increased pressure els and scripts, which perform well on set criteria for
on local municipality and ferry route budgets, which not only one or a few ferries or for sample vessels in a
could further indirectly incentivise a reduction in fuel short sample period, but also for larger group of ferries
consumption, maintenance and repair costs, among oth- and vessels, on voyages with variable data sets and for
er things. As regards Lauritzen and also most other ship- longer time periods.
ping companies, including their competitors, the focus Also, it is essential in the longer term that the Island
on digitalising the fleets and reducing fuel consumption, Ferries and academic or industrial software/AI model
emissions and operational costs is likely to continue. This vendors form a business partnership in order for vendors
will also be further promoted by industry market and to maintain knowledge on data capture technologies,
regulatory requirements currently being developed by models and software visualisations on an ongoing basis.
the European Union (EU) and IMO. As reported in various Similarly, shipping companies and software/AI model
studies, ownership structures and commercial models vendors need to enter into a business partnership ena-
of the industry might however still act as a hindrance bling them to adjust and fine-tune their knowledge on
for further investments in digitalisation or might imply data, models and software on a constant basis.
a slower adoption of eco-efficient execution of vessel For the project to succeed in the Island Ferries case,
operations for the industry (see the following publica- it is essential to demonstrate that AI models can be in-
tions: Poulsen & Johnson 2015; Poulsen & Sampson 2019). tegrated and converted into production-ready (tested)
With regard to both cases, from a technical perspec- (open source) software, including visual tools, which are
tive, the solutions being piloted for data capture, logging quick and user-friendly for both the crew on-board and
and data warehouse/cloud-based storage must meet the staff onshore to apply. The shipping companies and
requirements for performance (uptime, flexibility, scal- vendors, on the other hand, need to get AI models inte-
ability) and be sufficiently robust so they can provide grated to the production-ready software and develop
high-frequency data of good quality on a daily basis and visual tools, which should not only be quickly applied by
22Photo: Tapio Karvonen
but should be more user-friendly for the staff and crew. Furthermore, in the Island Ferries case, the fuel typical-
As regards the case of Island Ferries onshore staff and ly used for these ferries is MGO due to SECA regulations,
crew are ultimately accountable for meeting eco-effi- and as it remains untaxed in Denmark, the cost of fuel
ciency and budget targets set by the municipality and in is approximately 50% lower than standard diesel fuel,
the case of the shipping company, they are accountable which in principle gives the ship owners and operators
for reaching business- and eco-efficiency targets set by less incentive to save fuel despite political intentions.
the company for the short and long term. If data and However, it enables the municipalities to offer an im-
recommendations are not transparent and trustworthy, proved service for the islanders.
staff in both cases are likely to rely more on their gut Let it be mentioned also that in Island Ferries case
feeling and years of working experience when taking electricity delivered to ships for use in port has a tax
actions to solve problems. exemption. The exemption is given to the supplier of the
As far as both cases are concerned, training users such power in port holding the ‘consumer number’ (in Danish:
as onshore staff and onboard crew in the discipline (the- ‘aftagenummer’). Transferring this tax exemption to the
ory/methods) of digital vessel performance monitoring, shipowner will encourage the ship owners/operators to
as well as in the developed applications and modules, is use an onshore power supply, as the electricity price
critical for later implementation successes. As much as becomes competitive with the already tax-exempted
possible, training efforts should be tailored to individual marine fuel. Thus, a level playing field should be ensured
availability (in time and space) and requirements and in the long-term.
emphasise building job-related skills.
233. OPTIMISING CARGO
STOWAGE PROCESSES
Description of The logistics division provides European door-to-door
transport solutions to manufacturers of consumer and
the case and methods industrial goods. The main activity is providing full- and
The second technology case in ECOPRODIGI includes the part-load solutions that are ambient and tempera-
loading, stowage and discharge processes of ships at ports. ture-controlled. Logistics solutions are developed in
The industry end-user in this specific case is DFDS, which partnership with retailers and producers, including ware-
was founded in 1866, as a merger of three independent housing services and just-in-time concepts. Solutions
shipping companies, and is today one of Europe’s largest are supported by a European network of road, rail and
shipping companies. DFDS operates one of the largest container carriers and DFDS’s ferry routes. The logistics
networks of roll-on/roll-off passenger (RoPax) and roll-on/ division had the following key figures in 2018:
roll-off (RoRo) ferry routes in and around Europe, including
• Revenue: 5.3 billion DKK
their own terminals in key locations. All routes operate on
fixed schedules and are strategically located to provide • Sales offices/warehouses: 31/18
freight services to forwarders, haulers and manufacturers • Units transported: 56
of heavy goods. Passenger services include overnight and • Tonnes transported: 417,000.
day crossings. In 2018, the revenue of DFDS was 15.7 bil-
For the ECOPRODIGI project, the focus has been on
lion DKK/2.109 billion EUR, and EBITDA4 was 3 billion
the ferry division, and particularly cargo and not pas-
DKK/401 billion EUR. Its total number of employees is
senger transport. A team of researchers and industry
approximately 7,200.
experts from AAU, SDU, University of South-Eastern
DFDS is organised into two divisions: the ferry division
Norway (HSU), Kockum Sonics and Logimatic, together
and the logistics division. The ferry division operates (mostly
with DFDS staff, conducted a set of visits to and stud-
owned vessels) 53 ferries of up to 6,700 lane meters in capac-
ies of several ferry routes and terminals from autumn
ity sailing on 22 routes in geographical areas of:
2017 to spring 2019 to investigate the current state of
• North Sea the end-to-end stowage process, systems and baseline
• Baltic Sea eco-efficiency performance.
• English Channel The scope of the visits/studies covered the following
• Mediterranean Sea routes:
• Karlshamn–Klaipeda
The ferry division had the following key figures in 2018:
• Gotherburg–Gent/Immingham
• Revenue: 11.1 billion DKK
• Esbjerg–Immingham
• Routes: 24
• Vlaardingen–Immingham/Felixstowe.
• Freight lane meters: 40.1 million
• Passengers: 5.4 million
EBITDA = Earnings Before Interests, Taxes, Depreciation and Amortisation
4
24You can also read