GRAZIERS WITH BETTER PROFITABILITY, BIODIVERSITY AND WELLBEING
←
→
Page content transcription
If your browser does not render page correctly, please read the page content below

GRAZIERS WITH BETTER
                     PROFITABILITY,
                  BIODIVERSITY AND
                        WELLBEING
              Exploring the potential for improving
    environmental, social and economic outcomes in
                                         agriculture

                                                                            Abstract
  There is significant potential to simultaneously increase environmental health and
     biodiversity in grassy woodlands biome and improve financial and wellbeing for
graziers. However, traditional methods of landholder engagement and education on
   their own may be insufficient to realise the opportunity. We describe some areas
  where further investigation should be undertaken with a view to identifying policy
                                                                          directions.

     Sue Ogilvy, Mark Gardner, Dr Thilak Mallawaarachchi, Dr Jacki
                  Schirmer, Kimberly Brown, Dr Elizabeth Heagney.
                                               Corresponding author: sueogilvy@gmail.com
Report: Graziers with better profitability, biodiversity and wellbeing

Copyright

This work may be reproduced in whole or in part for study or training purposes subject to the
inclusion of an acknowledgement of the source. It is not intended for commercial sale or use.
Reproduction for other purposes requires the written permission from the authors.

Enquiries

General enquiries about the project should be directed to the Project Lead: Sue Ogilvy via
sueogilvy@gmail.com. Enquiries related to regenerative grazing practice should be directed to Mark
Gardner of Vanguard Business Services via mark.gardner@vbs.net.au.

Purpose of report

The report: Graziers with better profitability, biodiversity and wellbeing is provided to parties
interested parties in exploring the relative profitability of grazing entities that have either
maintained or are regenerating significant ecological functions and biodiversity in the grassy
woodland biome of Eastern Australia.

Citation

Please cite the report as: Ogilvy, S., Gardner, M., Mallawaarachichi, T., Schirmer, J., Brown, K.,
Heagney, E. (2018) Report: Graziers with better profitability, biodiversity and wellbeing. Canberra
Australia

Additional material and resources

Project summaries and further materials are available via Vanguard Business Services Dubbo:
www.vbs.net.au.

Acknowledgements

This project was supported through funding from the Australian Government’s National
Environmental Science Program. It included significant contributions from NSW OEH and ABARES for
econometric analysis, from and benefited from considerable in-kind support from Dr Thilak
Mallawaarachchi (University of Queensland) and Emeritus Professor Stephen Dovers (ANU). Assoc.
Prof. Jacki Schirmer and Ms Kimberly Brown (University of Canberra) led the wellbeing component.
The team is also grateful for the substantial assistance generously provided by Dr Sue McIntyre
(CSIRO) to adapt the principles for managing and conserving grassy woodlands (McIntyre et al.,
2002) for use as an ecological condition classification. The project team acknowledges the influence
of ABS in the metadata driven spreadsheet design used in the project for classification and
compilation of financial data. We are grateful for the assistance of Mike Digby, Niilo Gobius and Phil
Tickle in the use of FarmMap4D for the remote-sensing component, and Dr. Ivan Hanigan for the
exploration of season quality. We thank Stuart Whitten of CSIRO, Fiona Dickson and Paula Perrett of
the Department of the Environment and Energy for the opportunity to discuss the strategies and
tactics of the project and benefit from their experience. Finally, the project acknowledges the
insights and leadership and generosity of the regenerative graziers that have participated in this
study. Their commitment to grazing practices that balance environmental and economic
performance is a significant contribution to agriculture in Australia.

NSW grassy woodland biome            Project methods and findings                               Page | 1
Report: Graziers with better profitability, biodiversity and wellbeing

Disclaimer

This report has been prepared for the purpose of communicating the methods and findings of an
exploratory research project. It is a working paper prepared for discussion purposes only. Whilst the
authors have exercised due care, skill and diligence in preparing this report they do not warrant the
accuracy of data provided to it, or the accuracy of any conclusions drawn in reliance on the data. This
report does not constitute financial or investment advice and should not be relied upon for this
purpose. To the extent permitted by law the authors accept no responsibility for any loss, claim or
liability incurred by any party in connection with this report.

NSW grassy woodland biome            Project methods and findings                             Page | 2
Report: Graziers with better profitability, biodiversity and wellbeing

Graziers with better profitability,
biodiversity and wellbeing
1 ABSTRACT
The box gum grassy woodlands, an iconic Australian ecological community, have declined by
approximately ninety-two percent from their natural extent, largely due to decades of clearing and
nutrient enrichment associated with efforts to improve productivity and profitability of agriculture.
However, a community of practice of producers (self-styled regenerative graziers) has persistently
claimed that they have very good environmental performance and biodiversity on their properties
and that they are no less profitable than other producers in their regions. Individual case studies
have supported these claims. This project aimed to discover the differences in profitability between
graziers whose farms exhibit healthy functional traits and biodiversity of grassy woodlands and all
other sheep, sheep-beef and mixed cropping-grazing businesses in their regions. Financial
performance of farm businesses was compared with industry benchmarks and the ABARES Farm
Survey participants. For additional social context, the project assessed the wellbeing of the graziers
and compared this to NSW producers that have contributed to the University of Canberra regional
wellbeing survey. The study found that the regenerative graziers that contributed to this project are
often more profitable than comparable contributors to the ABARES Farm Survey, especially in dry
years, that the levels of farm profit were similar to published industry benchmarks of ‘elite’
producers and they experience significantly higher than average wellbeing when compared to other
NSW farmers. Taken together, these findings verify the claim that some graziers are able to be
profitable whilst maintaining and enhancing the biodiversity on their properties and suggests that
they have a set of management capabilities, different to other producers that creates these
outcomes. These findings indicate that there is the potential to increase both public and private
benefits by investing to develop additional regenerative grazing capacity.

NSW grassy woodland biome            Project methods and findings                             Page | 3
Report: Graziers with better profitability, biodiversity and wellbeing

2 EXECUTIVE SUMMARY
This independent research project focused on grazing properties in regions where box gum grassy
woodlands are found. The box gum grassy woodlands are an iconic Australian ecological community
that was listed under the Environmental Protection and Biodiversity Act (EPBC) as endangered in
2010 (TSSC, 2010). The endangerment of this community is a result of decades of clearing and
nutrient enrichment for agriculture that has resulted in their decline by approximately 92% from
their pre-1750 extent. Clearing and nutrient enrichment to improve profitability and productivity of
agriculture remains the dominant approach to production within these landscapes. However, a
community of practice of producers (self-styled regenerative graziers) has persistently claimed that
that they generate higher or more dependable profitability than other producers in their regions and
that their grazing practices help to conserve valuable ecological functions of box gum grassy
woodland communities. If verified, the information gained has the potential to reveal opportunities
for improving environmental performances in the landscapes where these iconic and threatened
ecological communities are distributed. It should be noted that this study has not specifically
measured whether regenerative grazing regimes are maintaining or improving the condition of box
gum remnants to the criteria set out in the EPBC Act (i.e. to high conservation values). Nonetheless,
a number of key features of this endangered community have been assessed as present within these
regenerative grazing production systems.

 Supported by funding from the Australian Government’s National Environmental Science Program
(NESP-EP), this project investigated the profitability of commercial-scale producers in NSW who are
using and sustaining healthy grassy woodlands as inputs to production. This report presents findings
for the financial, ecological and wellbeing characteristics of fifteen regenerative graziers from three
regions of NSW grassy woodland biome; Armidale – Uralla (North), Wellington – Gulgong (Central)
and Holbrook – Young (South). Participants were selected on the basis that:

    •   they were of commercial scale and deriving their livelihood from their farm business,
    •   they had been applying a low or no input operations policy and using sensitive management
        of grazing and
    •   the property demonstrated characteristics consistent with established principles for
        managing and conserving features of healthy grassy woodlands.

Participants were asked to provide at long-term detailed financial information, describe the history
of the property, their business and personal goals and current management policy and complete
several questions that were identical to some of those included in the University of Canberra’s
annual Regional Wellbeing Survey. The characteristics of the properties relevant to grassy woodland
condition and sustainability were assessed for to evaluate the adherence to published principles for
the conservation and management of grassy woodlands (McIntyre et al., 2002) and describe the
condition of the property as sustaining or regenerating functional and species characteristics of
grassy woodlands and native pastures. Key financial performance indicators and driver variables
were derived so that their profitability could be compared to industry benchmarks and to
participants in the ABARES Farm Survey. Wellbeing was compared to wellbeing of other NSW
graziers of similar age and gender, using standard measures of health and wellbeing.

The regenerative graziers that contributed to this study were found to be more profitable when
compared to all sheep, sheep-beef and mixed industry farms in a similar geographic region especially
in the dry years between 2005-06 and 2008-09. Similar mean profitability between the NESP-EP and

NSW grassy woodland biome            Project methods and findings                              Page | 4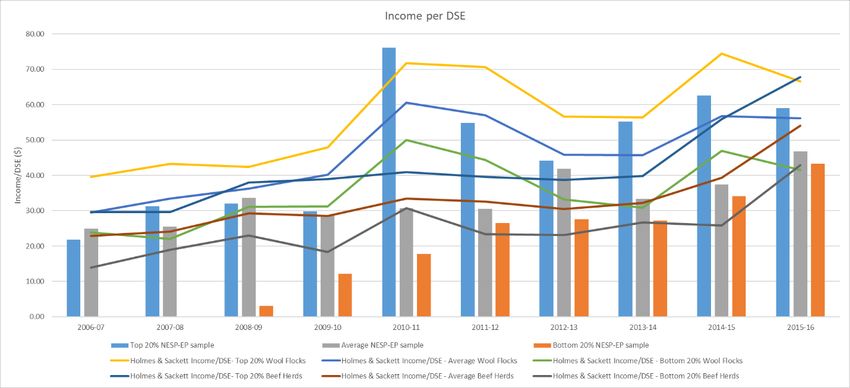
Report: Graziers with better profitability, biodiversity and wellbeing

the other farm businesses was seen in 2014-15, 2015-16 and 2016-17. In these years, the NESP-EP
sample exhibited lower variance (Ogilvy et al., in preparation). Regenerative farms also displayed
more stable incomes through time compared to other farms in the ABARES Farm Survey.

Although this study was not configured to identify a causal link between ecological condition and
farm profitability, our observation of significant differences in the cost and profit profiles of the
regenerative graziers compared to other farms establishes a strong link between different modes of
management and farm profitability. We conclude that regenerative grazing can be at least as
profitable, and at times more profitable, than other methods whilst maintaining and enhancing
grassy woodland biodiversity on their properties.

Analysis of the wellbeing data indicates that the regenerative producers experience a meaningful
and significant wellbeing advantage compared to NSW farmers matched for gender and age.
Regenerative graziers also reported higher ‘farming self-efficacy’ – confidence in being able to
successfully manage different aspects of their farm. Self-efficacy is an important ‘wellbeing
determinant’ known to influence wellbeing levels, and this finding suggests regenerative grazing may
be associated with improved self-efficacy, which in turn has a positive influence on farmer wellbeing.

Taken together, these findings are suggestive of a previously unrecognised but potentially significant
set of benefits being experienced by the regenerative graziers, possibly as a result of their approach
to management of their natural resource base. However, while the private benefits to producers
may be enough on their own to induce individual investment in skills associated with improvements
environmental condition and biodiversity, experiences in other agricultural sectors (e.g. sugarcane
(Queensland CANEGROWERS Organisation, 2018)) indicate that there may be other barriers to
change. This suggests a path forward to improve our understanding of factors that contribute to
farm business profitability, environmental health and rural wellbeing and should enable
governments to design and develop programs that build these capabilities throughout the sector.

This study is unique in that it sampled a set of livestock producers based on the environmental
health and biodiversity of their properties (regenerative graziers) and compared their profitability
and wellbeing to a representative sample of other producers. This gives the study its strength and
reveals the opportunity for future studies.

The sample of graziers was small and the lack of data about the ecological characteristics of the
broader population of graziers in the grassy woodlands biome means that it is not possible to
confirm any causality between the condition of the ecosystem and profitability or with higher
wellbeing. Further studies examining the ecological characteristics of a larger sample of livestock
producers in the grassy woodlands and other biomes are needed to identify whether the results
amongst the group examined in this study apply more broadly and to identify if, when and how
improvement of biodiversity is related to positive impacts on farm profitability and producer
wellbeing.

We suggest the following areas are investigated with a view to identifying policy directions:

    1. Identifying the most effective strategies for raising awareness and understanding of the
       opportunities to improve profitability, environmental performance and wellbeing, in a whole
       of farm context, including:
            a. How to increase graziers’ access to high quality regenerative grazing education and
                consulting that allows them to emulate, adapt or innovate upon leading

NSW grassy woodland biome            Project methods and findings                               Page | 5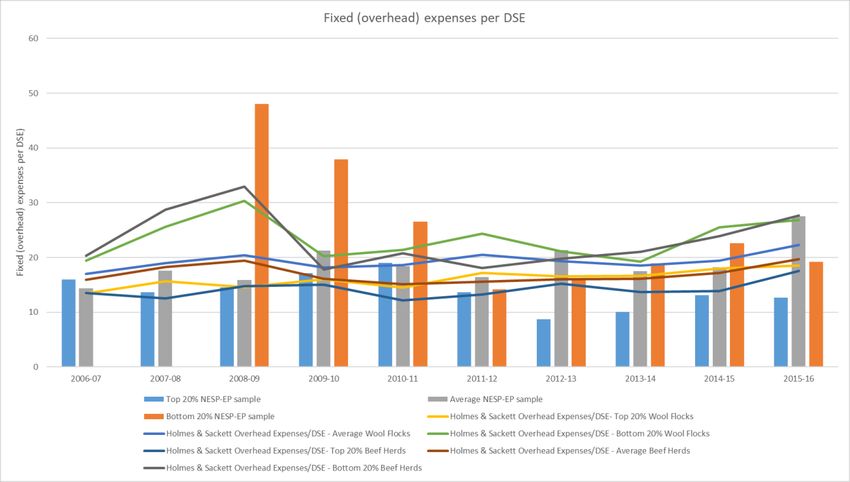
Report: Graziers with better profitability, biodiversity and wellbeing

                regenerative graziers’ management skills. This may include support for educators
                and consultants as well as mentoring and access to field days on farms managed by
                the leading regenerative graziers.
           b. How to increase understanding and acceptance of the environmental, economic
                benefits of regenerative grazing amongst government agencies, agronomists and
                government extension officers
    2. Describing the market and cultural mechanisms that would ensure that financial and-or
       social rewards exist (and no barriers are perceived) for increasing biodiversity and landscape
       function. For example:
           a. The emerging efforts of the private sector to use sourcing and capital allocation
                decisions to increase environmental protection and biodiversity on the properties
                they purchase from or lend to. (This would include support for development of
                methods by which they can assess these attributes and recognise farm businesses
                that generate them.)
           b. Land valuation approaches to develop strategic pathways for ‘environmentally
                friendly’ land valuation practices.
           c. Related to b above, expansion of existing markets for biodiversity and mechanisms
                for financial services providers to generate returns from biodiversity investment.
                This may encourage biodiversity-sympathetic land valuations.
           d. Correcting misperceptions that increases in native vegetation and biodiversity may
                negatively impact property rights for agricultural producers and increasing
                understanding of obligations and restrictions under the Environment Protection and
                Biodiversity Conservation Act 1999 and state and territory native
                vegetation/biodiversity legislation.

NSW grassy woodland biome            Project methods and findings                            Page | 6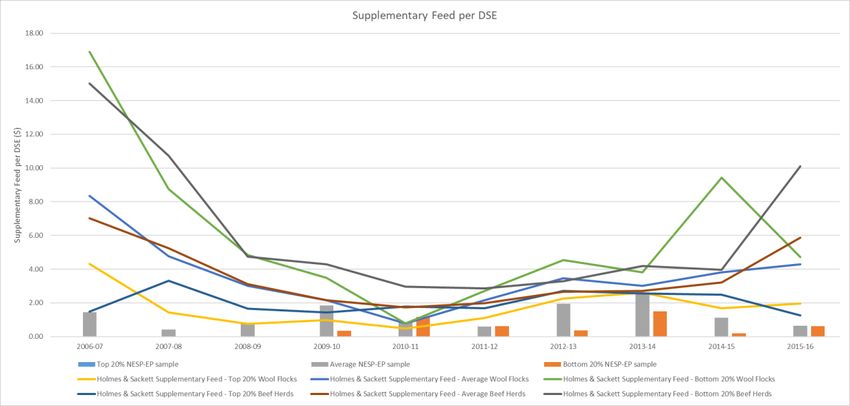
Report: Graziers with better profitability, biodiversity and wellbeing

3 CONTENTS
1     Abstract ..................................................................................................................................... 3
2     Executive summary.................................................................................................................... 4
4     List of figures ............................................................................................................................. 9
5     List of tables ............................................................................................................................ 11
6     Project outline ......................................................................................................................... 12
    6.1       Foundational concepts ..................................................................................................... 12
    6.2       Region.............................................................................................................................. 14
    6.3       Project organisation ......................................................................................................... 15
    6.4       Summary of activities, progress and outputs .................................................................... 16
    6.5       Methods overview ........................................................................................................... 16
7     Findings ................................................................................................................................... 19
    7.1       Ecological characteristics .................................................................................................. 19
    7.2       Profitability ...................................................................................................................... 22
      7.2.1          Comparison to industry benchmark – Holmes & Sackett AgInsights .......................... 22
      7.3.2          Comparison to ABARES Farm Survey contributors..................................................... 31
    7.4       Wellbeing......................................................................................................................... 32
      7.4.1          What is wellbeing? ................................................................................................... 33
      7.4.2          Methods ................................................................................................................... 35
      7.4.3          Understanding the goals of Regenerative Farmers: ................................................... 35
      7.4.4          Producer goals.......................................................................................................... 37
      7.4.5          Producer wellbeing................................................................................................... 38
    7.5       Season Quality ................................................................................................................. 48
8     Limitations and opportunities .................................................................................................. 50
    8.1       Understanding environmental factors of farm profitability ............................................... 50
    8.2       Grassy woodland condition classification ......................................................................... 51
    8.3       Related to this project’s approach to wellbeing research .................................................. 53
    8.4       Pathways to regenerative grazing..................................................................................... 54
    8.5       Season quality .................................................................................................................. 54
9     Discussion................................................................................................................................ 55
10         Recommendations ............................................................................................................... 56
    10.1      Increasing motivation to learn more about regenerative practices ................................... 56
      10.1.1 Raising awareness and understanding of the opportunities to improve profitability,
      environmental performance and wellbeing.............................................................................. 56
      10.1.2         Ensure financial and social rewards exist for increasing biodiversity ......................... 57

NSW grassy woodland biome                           Project methods and findings                                                         Page | 7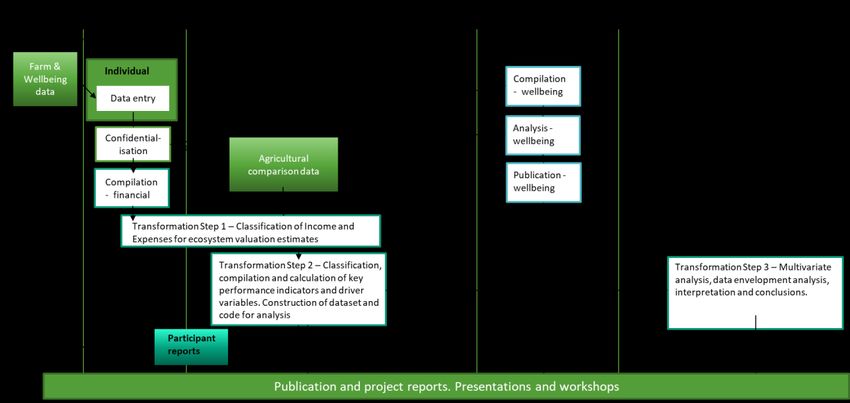
Report: Graziers with better profitability, biodiversity and wellbeing

  10.2      Improving the effectiveness of engagement and education .............................................. 57
  10.3 Demonstrating the overall economic viability of regenerative and conventional farm
  management practices ................................................................................................................ 58
  10.4      Reducing drought-related distress.................................................................................... 58
11       Conclusion ........................................................................................................................... 60
12       Appendix A – detailed financial and ecological data ............................................................. 61
  12.1      Income per DSE ................................................................................................................ 61
  12.2      Supplementary feed per DSE ............................................................................................ 62
  12.3      Pasture costs per DSE ....................................................................................................... 63
  12.4      Animal health and breeding expenses .............................................................................. 64
  12.5      Variable costs per DSE ...................................................................................................... 65
  12.6      Fixed costs per DSE .......................................................................................................... 66
  12.7      Ground-cover ................................................................................................................... 67
  12.8      Ground layer quality......................................................................................................... 69
13       Appendix B - methods .......................................................................................................... 71
  13.1      Financial data ................................................................................................................... 71
     13.1.1        Collection and management of participant data ....................................................... 71
     13.1.2        Comparison to industry benchmarks ........................................................................ 72
     13.1.3        Comparison to ABARES farm survey ......................................................................... 74
     13.1.4        Basic and econometric analysis................................................................................. 75
  13.2      Ecological classification .................................................................................................... 76
     13.2.1        Classification method for sustainable, regenerating or reducing grassy woodlands... 76
     13.2.2        Classifications ........................................................................................................... 81
     13.2.3        Methods for estimating ground-cover proportion..................................................... 85
     13.2.4        Methods for assessing the quality of forage for grazing ............................................ 86
14       References ........................................................................................................................... 87

NSW grassy woodland biome                         Project methods and findings                                                       Page | 8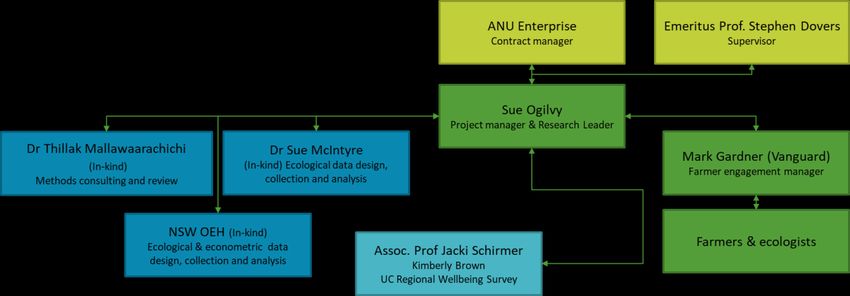
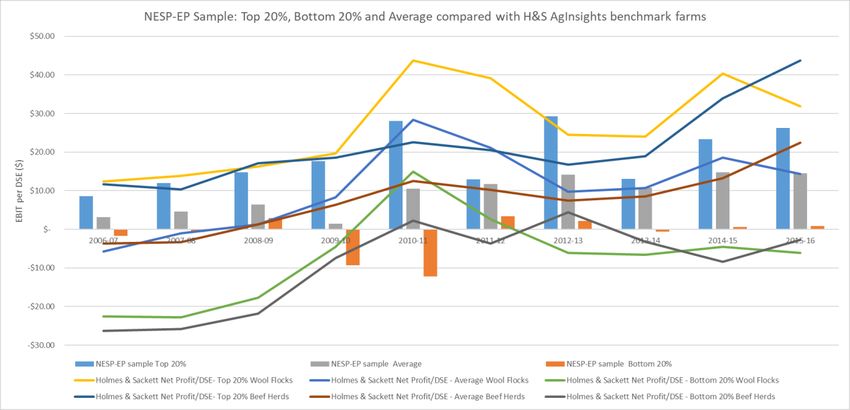
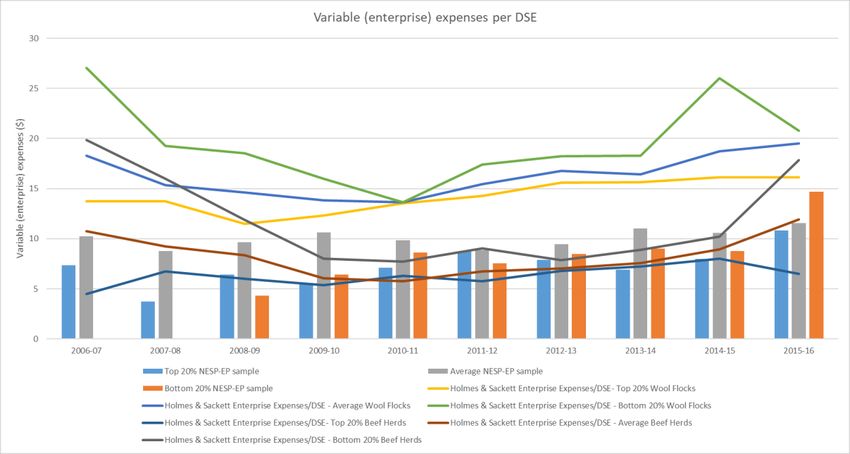
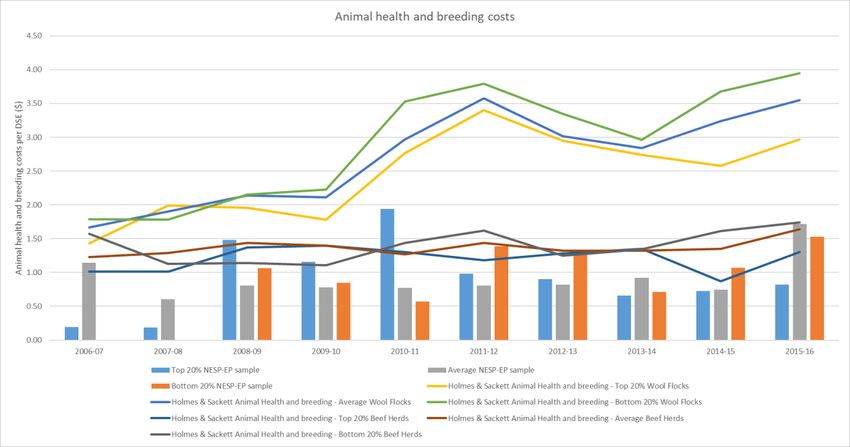
Report: Graziers with better profitability, biodiversity and wellbeing

4 LIST OF FIGURES
Figure 1: Grassy woodland biome (green). Image created by Greg Patterson. .................................. 14
Figure 2: NESP-EP Farm profitability and biodiversity project organisation ...................................... 15
Figure 3: property condition classifications. Each property was classified as using all or some the
principles and being above or below the thresholds described as being associated with management
and conservation of grassy woodlands ............................................................................................ 21
Figure 4: Chart of comparative EBIT/DSE for the NESP-EP sample (columns) and the Holmes &
Sackett AgInsights database (lines). The Top 20% of the NESP-EP sample is the average of the two
farms in the top 20% (percentile.inc(array,0.8)) of EBIT/DSE. The Bottom 20% is the average of the
two farms in the bottom 20% (percentile.inc(array,0.2)) of EBIT/DSE. The average is the average of
the remainder. This may not exactly match the method used in AgInsights and so the results should
be used with caution. ...................................................................................................................... 23
Figure 5: Chart of EBIT/DSE ten-year average (2006-07 to 2015-16) of top 20%, average and bottom
20% of producers. ........................................................................................................................... 24
Figure 6: Chart of Income/DSE ten-year average (2006-07 to 2015-16) of top 20%, average and
bottom 20% of producers ................................................................................................................ 25
Figure 7: Chart of supplementary feed per DSE ten-year average (2006-07 to 2015-16) of top 20%,
average and bottom 20% of producers ............................................................................................ 26
Figure 8: Chart of pasture costs (fertiliser) per DSE ten-year average (2006-07 to 2015-16) of top
20%, average and bottom 20% of producers.................................................................................... 27
Figure 9: Chart of animal health and breeding expenses per DSE ten-year average (2006-07 to 2015-
16) of top 20%, average and bottom 20% of producers ................................................................... 28
Figure 10: Chart of variable costs per DSE ten-year average (2006-07 to 2015-16) of top 20%, average
and bottom 20% of producers ......................................................................................................... 29
Figure 11: Chart of fixed costs per DSE ten-year average (2006-07 to 2015-16) of top 20%, average
and bottom 20% of producers ......................................................................................................... 30
Figure 12: Return on assets managed - EBIT divided by the value of all assets under management
(including land and livestock) .......................................................................................................... 31
Figure 13: EBIT per sheep equivalent ............................................................................................... 32
Figure 14: aggregated responses to questions about goals .............................................................. 37
Figure 15 Subjective wellbeing of best practice regenerative graziers compared to other graziers ... 40
Figure 16 Personal Wellbeing Index – individual measures, comparison of best practice regenerative
graziers and other graziers .............................................................................................................. 41
Figure 17 General health of best practice regenerative graziers compared to other graziers ............ 42
Figure 18 Psychological distress of best practice regenerative graziers compared to other graziers . 42
Figure 19 Farming self-efficacy – Part 1 ........................................................................................... 43
Figure 20 Farming self-efficacy – Part 2 ........................................................................................... 44
Figure 21 Average farm business performance in last three years, self-reported ............................. 45
Figure 22 Farm financial stress and satisfaction with farm business performance ............................ 45
Figure 23 Self-reported farm cash flow status in last 12 months ...................................................... 46
Figure 24: SOI for the period of interest for the NESP-EP farm profitability and biodiversity project.
Source: Australian Bureau of Meteorology, Canberra Australia accessed July 13, 2018. ................... 49
Figure 25: Classification of financial years as being favourable or unfavourable seasons based on the
Hutchinson Drought Index. .............................................................................................................. 49
Figure 26: Chart of income per DSE. NESP-EP producers (columns), Holmes & Sackett benchmark
participants (lines) ........................................................................................................................... 61

NSW grassy woodland biome                           Project methods and findings                                                       Page | 9
Report: Graziers with better profitability, biodiversity and wellbeing

Figure 27: Chart of supplementary feed per DSE. NESP-EP producers (columns), Holmes & Sackett
benchmark participants (lines) ........................................................................................................ 62
Figure 28:Chart of pasture costs per DSE. NESP-EP producers (columns), Holmes & Sackett
benchmark participants (lines) ........................................................................................................ 63
Figure 29: Chart of animal health and breeding expenses per DSE. NESP-EP producers (columns),
Holmes & Sackett benchmark participants (lines) ............................................................................ 64
Figure 30: Chart of variable costs per DSE. NESP-EP producers (columns), Holmes & Sackett
benchmark participants (lines) ........................................................................................................ 65
Figure 31: Chart of fixed costs per DSE. NESP-EP producers (columns), Holmes & Sackett benchmark
participants (lines) ........................................................................................................................... 66
Figure 32: Average difference in ground-cover between the participants and properties within 10km
radius. (Statistical output of FarmMap4D. Average from 2006-07 to 2015-16.) ................................ 67
Figure 33: Average difference in ground-cover between the participants and properties within 10km
radius for each year of the study. (Statistical output of FarmMap4D.) ............................................. 68
Figure 34: frequency of observations of non-grass species in grassy woodlands. ............................. 69
Figure 35: frequency of observations of Appendix 1 species in cleared pastures .............................. 70
Figure 36: Process, roles and responsibilities for collection and processing of financial (and wellbeing
data). .............................................................................................................................................. 72
Figure 37: metadata model - classifications for analysis ................................................................... 74
Figure 38: illustration of different types of agro-ecological communities comprising the natural
resource base of a grazing business. ................................................................................................ 76
Figure 39: illustration of methods used in combination for property condition assessment ............. 78
Figure 40: process, roles and responsibilities for collection of data for classification of grassy
woodland status of properties ......................................................................................................... 79

NSW grassy woodland biome                             Project methods and findings                                                       Page | 10
Report: Graziers with better profitability, biodiversity and wellbeing

5 LIST OF TABLES
Table 1: descriptions of different condition classifications of properties in the grassy woodlands .... 19
Table 2: EBIT/DSE data table. ........................................................................................................... 23
Table 3: Data table for EBIT/DSE ten-year average chart (Figure 5.) ................................................. 24
Table 4: Data table for Income/DSE ten-year average chart (Figure 6.) ............................................ 25
Table 5: Data table for supplementary feed per DSE ten-year average (2006-07 to 2015-16) of top
20%, average and bottom 20% of producers (Figure 7) .................................................................... 26
Table 6: Data table for pasture costs (fertiliser) per DSE ten-year average (2006-07 to 2015-16) of top
20%, average and bottom 20% of producers (Figure 8) .................................................................... 27
Table 7: Data table for animal health and breeding expenses per DSE ten-year average (2006-07 to
2015-16) of top 20%, average and bottom 20% of producers (Figure 9) ........................................... 28
Table 8: Data table for animal health and breeding expenses per DSE ten-year average (2006-07 to
2015-16) of top 20%, average and bottom 20% of producers (Figure 10) ......................................... 29
Table 9: Data table for fixed costs per DSE ten-year average (2006-07 to 2015-16) of top 20%,
average and bottom 20% of producers (Figure 11) .......................................................................... 30
Table 10: Possible goals for farm businesses .................................................................................... 36
Table 11: Data table for Income per DSE chart ................................................................................. 61
Table 12: Data table for supplementary feed per DSE chart ............................................................. 62
Table 13:Data table for pasture expenses per DSE chart .................................................................. 63
Table 14: Data table for animal health and breeding expenses per DSE ........................................... 64
Table 15: Data table for variable costs per DSE ................................................................................ 65
Table 16: Data table for fixed costs per DSE ..................................................................................... 66
Table 17: non-grass species observations (total across properties) .................................................. 69
Table 18: grass and sedge species observed on subject properties .................................................. 70
Table 19: Principles, subprinciples, example assessment and data sources for classification (rating) of
property grassy woodland condition................................................................................................ 82

NSW grassy woodland biome                        Project methods and findings                                                 Page | 11
Report: Graziers with better profitability, biodiversity and wellbeing

6 PROJECT OUTLINE
This project sought to investigate potential opportunities for landholders in the iconic box gum
grassy woodland biome of eastern Australia to improve both biodiversity and economic
performance. We sought to inform farmers who may wish to incorporate more environmentally
sound practices into their commercial operations of the potential for financial benefits or
disadvantages. We aimed to inform government of the magnitude and nature of private benefits of
better environmental management to assist with increased private generation of public
environmental benefits.

We investigated cases where commercial-scale farmers in the grassy woodland biome have, over the
long term, maintained or regenerated healthy ecosystems and utilised this as the natural resource
base that sustains their businesses. We collected data related to key ecological attributes, subjective
wellbeing and long-term financial data of these farms and compared farm financial profitability and
farmer wellbeing with outcomes in closely located farm businesses to investigate whether we could
find differences in profitability and wellbeing between the two populations.

The research was undertaken in three stages (a) collection and collation of on-farm financial data as
well as formal survey data relating to farmer wellbeing, and industry benchmarks against which
these can be compared (b) independent assessment of grassy woodland and native pasture
characteristics, and (c) formal comparative analysis of economic outcomes associated with
regenerative versus conventional farming systems. Examples are provided in Mallawaarachchi and
Green (2012).

This report is structured in five sections. This section (Section 6) outlines the project; the
foundational concepts, the region studied, the project organisation, activities and outputs. It
describes the methods to select participants and protect their privacy. Section 7 describes the
findings of the project in relation to farm business profit, farmer wellbeing and environmental health
of the properties. Section 8 describes the limitations of this study and outlines the opportunities it
exposed. Section 9 discusses the implications of the findings as context for the recommendations
(section 10). A short conclusion section closes the report. The detailed driver variables for profit are
outlined in Appendix A. Appendix B provides the methods for financial data collection and
transformation and ecological assessment and property condition classification.

6.1 FOUNDATIONAL CONCEPTS
Farmers manage their properties, primarily to gain a profit and support their way of life. Ongoing
profitability in agricultural systems requires ongoing inputs of human, financial and natural or
environmental capital. But inputs to farming from environmental capital (like forage for livestock,
nutrients and moisture from soil, pollination by insects) are widely accepted to vary in response to
the extent and condition of the contributing ecosystems. These in turn may be degraded,
maintained, or improved, depending on the farm management practices employed at a given site.

In commercial farm management, positive ecological outcomes are produced as a ‘joint product’, or
a ‘complementary good’, meaning that their production is not the farmers’ primary motive. But, as
the farmers’ understanding of how ecological condition contributes to improving or sustaining
production benefits, observations suggest that more farmers consciously invest in ecological

NSW grassy woodland biome            Project methods and findings                             Page | 12
Report: Graziers with better profitability, biodiversity and wellbeing

improvements, such as maintaining and improving biodiversity on farms1 (Mallawaarachchi and
Szakiel, 2007). Therefore, a better understanding of how farmers gain these benefits from
investment in biodiversity is an important consideration in designing public policies. For instance,
public policies, such as cost sharing arrangements may be designed to encourage farmers to provide
a greater proportion of these public environmental goods on farm. In designing such cost-sharing
arrangements, the extent to which biodiversity assists production can be an important guide.
Previous research argues that such benefits are measurable and can be positive (Mallawaarachchi
and Green, 2012).

In addition to contributing to agricultural productivity, ecosystems can confer a range of additional
services. Benefits from these services often accrue at a broader (local, regional or landscape) scale,
and, as such, ecosystems and their attendant services are considered public goods (even where they
occur on private land). Again, this has important policy implications. The balance between public and
private benefits from biodiversity (or ecosystems or farm management more generally) is considered
a key factor influencing the appropriateness and outcomes of alternative management options such
as engagement, and positive or negative incentives2 (Pannell 2008).

If we consider ‘economics’ in its broadest sense, to encompass all facets of an individual’s welfare,
then farmer wellbeing can also be considered an important economic outcome from farming
operations. It follows that a full understanding of the economic outcomes of regenerative farming
requires an investigation of the implications (if any) of regenerative farming for wellbeing. If benefits
such as reduced stresses associated with land management arise from regenerative farming, then
they would be considered to contribute to the overall private economic benefit arising from
regenerative farming practice.

There is a need to identify, describe and statistically calibrate the functionality of the land
management mode with functional analysis of the ecological and economic variables to identify the
factors that maximise benefits for livestock producers while achieving conservation of iconic and
endangered ecosystems. This project makes a significant contribution toward that aim.

1
    Mallawaarachichi, T. and Szakiel, S. 2007, Nonbroadscale land clearing in southern Australia: economic issues in managing native
        vegetation on farm land, ABARE Research Report 07.2. Prepared for the Natural Resource Management Division, Australian
        Government Department of Agriculture, Fisheries and Forestry, Canberra, January.
2
    Pannell, D. J. (2008) Public Benefits, Private Benefits, and Policy Mechanism Choice for Land-Use Change for Environmental Benefits.
        Land Economics, 84, 225-240

NSW grassy woodland biome                          Project methods and findings                                                Page | 13
Report: Graziers with better profitability, biodiversity and wellbeing
6.2 REGION
This study focused on the grassy woodlands biome of Eastern Australia. Many grassy box woodlands
are iconic ecological communities of conservation interest to Commonwealth and State
governments (DotEE, 2016). They occur west of the Great Dividing Range on an arc from Southern
Queensland through NSW to central Victoria (Figure 1.) in areas where rainfall is between 400 and
1200mm per annum, on moderate to highly fertile soils (TSSC, 2010). As a result of clearing and
nutrient enrichment for agriculture and subsequent grazing pressure, ‘tidying up’ and weed invasion
(Dorrough et al., Dorrough and Moxham, 2005, Dorrough et al., 2006, McIntyre et al., 2002, Prober
et al., 2002a, Prober and Thiele, 2005, Prober et al., 2002b) they have declined by approximately
92% from their pre-1750 extent of 5,011,655 (NSW Department of Environment, 2010) and were
listed as critically endangered under the Commonwealth EPBC Act in 2006 (DotEE, 2018). An
objective of the national recovery plan for these ecosystems is to increase grassy woodland and
native pasture characteristics between remnants to preserve the extent, integrity and function of
Box Gum Grassy Woodlands and to bring about enduring changes in land manager attitudes and
behaviours towards environmental protection and sustainable management practices (NSW
Department of Environment, 2010).
A community of practice of
‘regenerative’ graziers in the grassy
woodlands have claimed for years that it
is possible to regenerate and conserve
these ecosystems whilst achieving
satisfactory economic results (Ampt and
Doornbos, 2011, Seis and Seis, 2003,
Wright et al., 2005). These claims align
well with more general research into the
contribution of ecosystem inputs to
extensive livestock production systems
(see for example Ash et al., 2015, Lavorel
et al., 2015, Walsh and Cowley, 2016)
and with animal behaviour and nutrition Figure 1: Grassy woodland biome (green). Image created by
Greg Patterson.
research (Provenza et al., 2007, Villalba and
Landau, 2012, Villalba and Provenza, 2009).
Such studies consistently predict that improved ecosystem function and condition (especially
biodiversity) can improve the resilience of the natural resource base (Lavorel et al., 2015). These
claims have largely remained untested because traditional evaluations of agricultural productivity
that are routinely undertaken by government agencies (in Australia by ABARES and ABS) rarely
collect data on the ecological qualities of a farm property (ABARES, 2014) and other research has not
incorporated long-term financial data of leading regenerative graziers alongside characterisation of
the ecological functions and biodiversity of the property. Some aspects of the methods used for this
project may be insightful for future development of empirical methods that may identify any causal
links between economic performance and biodiversity on farms.
NSW grassy woodland biome Project methods and findings Page | 14Report: Graziers with better profitability, biodiversity and wellbeing 6.3 PROJECT ORGANISATION This project was directed by Sue Ogilvy at the Fenner School of Environment & Society Australian National University (ANU) who had overall responsibility for management of strategies and resources to achieve delivery of the project outputs. The ANU Enterprise provided liaison with the Department for all matters pertaining to administration, auditing, and reporting of the project. Prof. Stephen Dovers provided academic supervision and oversight of Human Research Ethics. Dr Thilak Mallawaarachchi, School of Economics, University of Queensland, provided economic methods supervision and oversight of data collection specification, methods, and analysis techniques. Dr Mallawaarachichi also contributed to the reporting of the project and development of publications. NSW OEH provided econometric expertise for definition, collection and analysis of ecological and economic data, project communications and is a key user of the project outputs. ABARES enabled the financial performance of the regenerative graziers to be compared to other comparable producers that have contributed to the ABARES Farm Survey. Vanguard Business Services managed farmer recruitment and farmer engagement with the project and operationalised the collection, confidentialisation and security of farm financial data in line with the protocols approved by ANU Human Ethics Committee (protocol 2017/011). Vanguard also participated in the economic and ecological data specification and analysis and continues to collaborate with the development of project communications outputs. The project benefited from the incorporation of the experience and expertise of producers considered leaders in ‘regenerative’ grazing and whose involvement in design and use of project communications will improve the impact of the project. Dr Sue McIntyre assisted the project team to adapt the principles of conservation and management of grassy woodlands (McIntyre et al., 2002) to assess the condition of the participating properties in terms of grassy woodland health and sustainability. Associate Professor Jacki Schirmer and Ms Kimberly Brown adapted the University of Canberra Regional Wellbeing Survey to compare the subjective wellbeing of the participants with other NSW farmers. The project organisation is illustrated below. Figure 2: NESP-EP Farm profitability and biodiversity project organisation NSW grassy woodland biome Project methods and findings Page | 15
Report: Graziers with better profitability, biodiversity and wellbeing

6.4 SUMMARY OF ACTIVITIES, PROGRESS AND OUTPUTS
The project established an interdisciplinary working group comprising the producers, farm
consultants, ecologists, and economists to appropriately inform elements of the project. Methods to
identify a relevant sample of regenerative producers and sources of comparative data were
designed and executed to produce a database of ecological, economic, and financial data relating to
regenerative farmers.

Ethics approval for the research was obtained from ANU (protocol number 2017/011) and sixteen
producers were successfully recruited. Under this protocol, financial data comprising profit & loss
and balance sheets was obtained from accounting statements, livestock records, bank valuations
and landholder valuations of assets. Eleven participants supplied more than ten years of financial
data, one producer supplied 9 years of data. The remaining four participants supplied between four
and eight years of data. All participants completed a section of the University of Canberra Regional
Wellbeing survey and a semi-structured interview that elicited information about producer goals and
their attribution of the strategies that help them to achieve their goals.

Financial performance benchmarks from leading benchmarking organisations (AgInsights and MLA)
were obtained to allow comparison of financial performance of the participating producers and the
industry leaders. Comparison to representative performance of closely located farms is being
conducted by ABARES in collaboration with NSW OEH.

6.5 METHODS OVERVIEW
The project used a case study approach. The NESP-EP sample of participating graziers were drawn
from a community who have consciously invested in ecological functions to improve the productive
capacity and biodiversity of their natural resource base. They were selected on the basis that they
have ceased the practices thought to be threatening to grassy woodlands and native pastures and
are using grazing3 and other practices thought to assist with their conservation and regeneration.
Accordingly, this project describes the population of regenerative graziers (in the grassy woodlands
biome) as livestock producers who are maintaining or regenerating many of the ecological
characteristics associated with healthy grassy woodlands and derived native pastures.

The criteria for inclusion in the project were:

       •     The properties used in production were observed as part of the recruitment process to
             demonstrate the characteristics of healthy, sustainable grassy woodlands and native
             pastures. The property had not been subject to recent (within 10 years) nutrient
             enrichment.
       •     The landholder described a long-term low-input, regenerative grazing regime and that their
             management goals included high levels of landscape function (consistent with Tongway and
             Hindley, 2004) and biodiversity. Their practices don’t include the activities commonly
             associated with grazing that are regarded as threats to grassy woodlands (NSW Department
             of Environment, 2010).

3
    Typical regenerative grazing regimes involved grazing durations of 3 to 7 days with usually more than 180 days (sometimes mor e than a
         year) rest between grazing. The regenerative grazing policy is to observe recovery rates of pastures, estimate how to retain
         sufficient annual pasture growth for replenishment of soil and vegetation resources and match stock numbers to resources
         available.

NSW grassy woodland biome                          Project methods and findings                                               Page | 16
Report: Graziers with better profitability, biodiversity and wellbeing
• The farm business has been producing wool and livestock at commercial scale for more than
10 years and was prepared to provide multiple years of detailed financial data.
Properties and landholders were identified using word of mouth and referral techniques via the
communities of practice in this industry and invited to participate in the project under ANU Ethics
Protocol 2017/011 approved by ANU Human Ethics Committee. Sixteen producers and landholders
confirmed their willingness to participate and the capacity of the properties to sustain or regenerate
characteristics of healthy grassy woodlands and native pastures on their properties was assessed.
To do this, the project team adapted the principles of conservation and management of grassy
woodlands (McIntyre et al., 2002) for a property-wide condition assessment of grassy woodland and
native pasture characteristics. The method incorporated satellite imagery to estimate the extent of
woodland and forest areas and fractional vegetation data from Landsat obtained through FarmMap
4D enabled estimation of bare ground. Woodland condition and ground-layer condition of
woodlands and pastures was assessed via field observations by a suitably qualified ecologist who
also gathered information about past and current management to judge whether the property is
likely to improve condition or not. Section 13 – Appendix B provides more detail about the methods
used.
Field observations for twelve properties were made during December 2017 following some summer
rain. Field observations for four properties were made in May and June 2018. As a result of the non-
ideal timing of these observations, we expect that the observations of the ground-layer may
underestimate the range of species present on the properties.
Following the ecological assessment, one property was judged to not meet the long-term
management criteria for sustainable or regenerating grassy woodlands and financial and wellbeing
data for this participant was removed from the financial results. A second property that had, over
the long term applied no nutrient enrichment to grassy woodlands and derived pastures was
discovered to have added chicken manure to these areas in the final year of the study. This means
that these areas are most likely to be unsustained in the future as grassy woodlands and native
pastures. However, the financial information for this farm business was retained in the profitability
analysis because the effect on production of the changed management practices occurs after the
study period. The findings of the ecological assessment of the properties is described in section 7.1
Ecological characteristics.
The fifteen enterprises included in the financial analysis comprise wool flocks, cattle herds, mixed
wool and cattle operations and some properties include agistment services as part of their
enterprise. Some participants are taking advantage of opportunities to expand their businesses and
have purchased properties in the period of the study. The significant outlays for stock purchases
have affected the profitability in those years. Some participants have introduced other enterprises
or have vertically integrated into direct processing and sales of meat. As a result of very good
environmental management of the property over the long-term, one participant is part of the
Environmental Stewardship Program (ESP) run by the Department of the Environment and their
financial performance reflects the income and expenses related to this contract. While in future
studies it would be desirable to analyse profitability with and without this type of income stream,
the changes to capital and resource allocation decisions the farmer has made to the enterprise in
response to this contract cannot be removed and consequently, the profitability of this business in
the absence of the ESP contract can’t be determined. This is consistent with the treatment of this
type of income by ABARES and allows a like for like comparison with this dataset. Since no other
NSW grassy woodland biome Project methods and findings Page | 17You can also read