Assessing spatial mismatch patterns in the Gold Coast - USQ ...
←
→
Page content transcription
If your browser does not render page correctly, please read the page content below
University of Southern Queensland

       Faculty of Health, Engineering and Sciences

Assessing spatial mismatch patterns in the Gold Coast

                A dissertation submitted by

                        Tari Zador

            in fulfilment of the requirements of

        ENG4111 and 4112 Research Project

                     towards the degree of

       Bachelor of Spatial Science (Honours) (Surveying)

                   Submitted October, 2016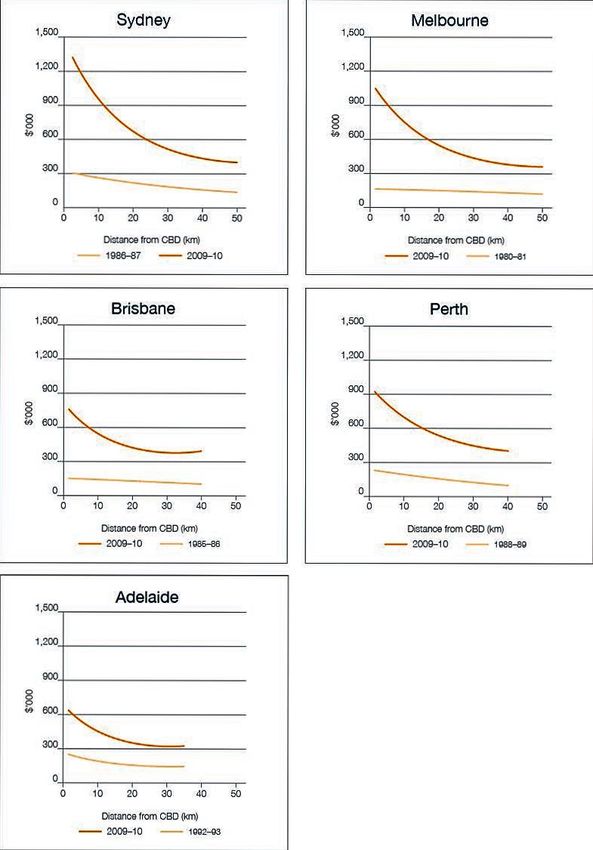
ABSTRACT

This research project empirically tests for the presence of spatial mismatch in the case study region of
the Gold Coast, Australia. Spatial mismatch is defined as the mismatch between where low-income
households reside, and suitable job opportunities (Kain 1968). Globally, several large scale empirical
studies have identified a causal link between poor employment outcomes of low socio-economic
residents, and the commuting distances to employment centres (Andersson et al. 2014; Dodson 2005;
Ihlanfeldt 2006; Li, Campbell, & Fernandez 2013). However, to date there has been a lack of empirical
analysis of the overlap between spatial dimensions of housing and employment (and the commuting
such divisions necessitate) in Australia, and never in the case study region. Thus, empirical testing to
identify the presence of spatial mismatch in the case study region, was considered practical in order to
address the identified gap in the literature. Using Geographic Information System (GIS) software,
secondary data from the 2006 and 2011 Australian Bureau of Statistics (ABS) censuses, at the Statistical
Local Area (SLA) unit, was used to spatially identify three low socio-economic/high unemployment
case study SLAs in the city. A map of the absolute difference in employment was developed using the
ABS data in the five-year period. A buffer of 15.6km (average commuting distance Australians travel
to access work (BITRE 2015)), was applied around each of the three case study SLAs; in order to
identify if disadvantaged households were able to reach areas of high employment within reasonable
commuting times. A secondary part of the research assessed the temporal quality of the public transport
in each of the identified case study SLAs, as previous research identified that the key to reducing the
effects of spatial mismatch is to improve public transport accessibility (Dodson 2005). The research
identified that spatial mismatch was not considered an issue in the case study region of the Gold Coast
as the number of employment opportunities grew in absolute numbers; however, the growth was mostly
in part-time employment. This finding reflects several other studies, which have highlighted Australia’s
shift in employment patterns towards an increase in part-time/casual employment (Australian Social
Inclusion Board 2009; ABS 2016). The ABS data identified that housing affordability was not strongly
spatially differentiated, with a high numbers of unemployed/low-income households, residing in inner
city areas, which are subsequently close to employment centres. The public transport assessment
identified that the highly disadvantaged outer suburban case study area of Nerang, provided the poorest
service accessibility relative to the employment centres. This finding was confirmed with ABS (2011)
identifying that households in case study areas with good access to public transport (Southport), were
nearly twice as likely to not own a car, compared to those with poorer public transport access(Nerang).

                                                                                                     iii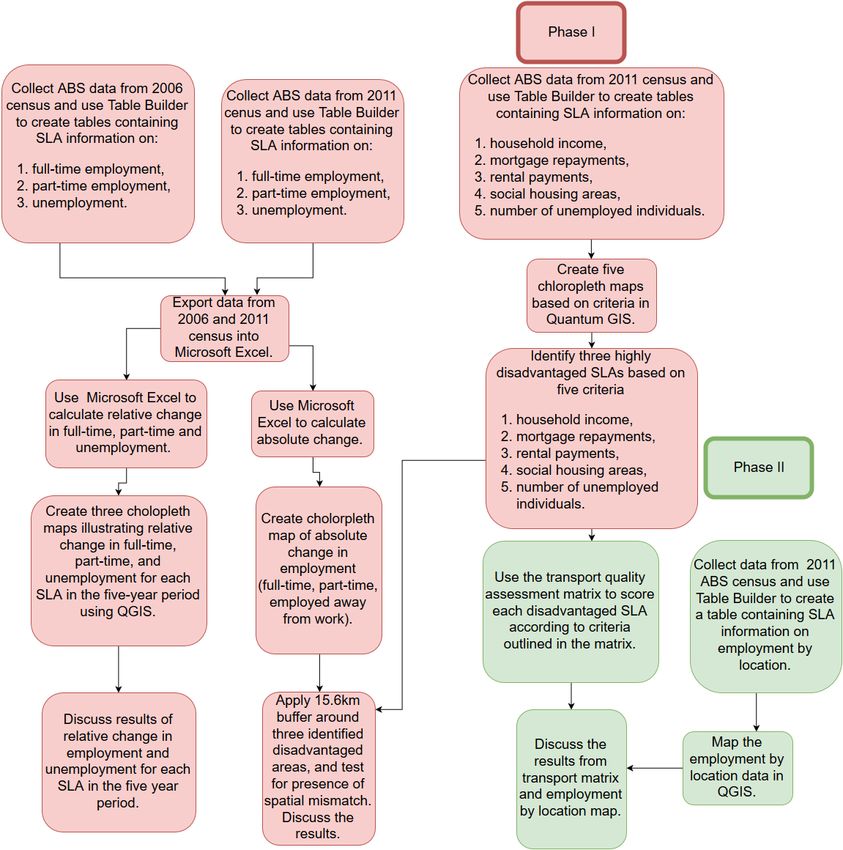
University of Southern Queensland
                         Faculty of Health, Engineering and Sciences

                       ENG4111 & ENG4112 Research Project
                                             Limitations of Use

The Council of the University of Southern Queensland, its Faculty of Health, Engineering and Sciences,
and the staff of the University of Southern Queensland, do not accept any responsibility for the truth,
accuracy or completeness of material contained within or associated with this dissertation.

Persons using all or any part of this material do so at their own risk, and not at the risk of the Council
of the University of Southern Queensland, its Faculty of Health, Engineering and Sciences or the staff
of the University of Southern Queensland.

This dissertation reports an educational exercise and has no purpose or validity beyond this exercise.
The sole purpose of the course pair entitles “Research Project” is to contribute to the overall education
within the student’s chosen degree program. This document, the associated hardware, software,
drawings, and any other material set out in the associated appendices should not be used for any other
purpose: if they are so used, it is entirely at the risk of the user.

                                                                                                        iv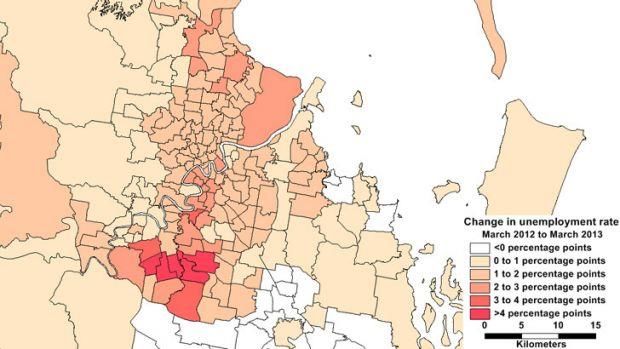
Certification
I certify that the ideas, designs and experimental work, results, analyses and conclusions set out in this
dissertation are entirely my own effort, except where otherwise indicated and acknowledged.

I further certify that the work is original and has not been previously submitted for assessment in any
other course or institution, except where specifically stated.

Tari Zador

Student Number: 1038607

                                                                                                          v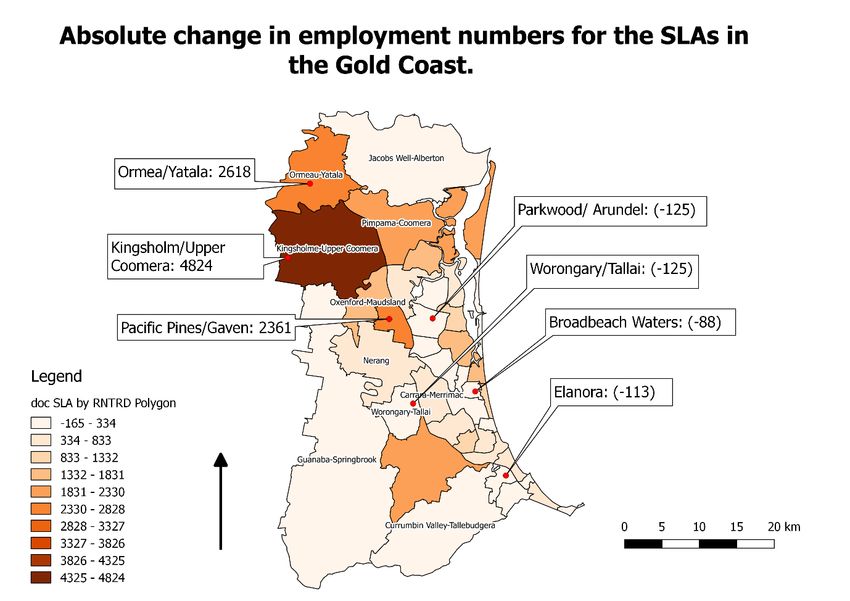
Acknowledgements
This research project was carried out under the supervision of Dr. Marita Basson, Lecturer in Urban
Design and Planning, Faculty of Engineering and Surveying, University of Southern Queensland. I
would like to thank Marita for her guidance, enthusiasm, precision, and attention to detail for the entirety
of this project. This project would have never been completed to its current level without Marita’s
assistance; thus, her input is greatly appreciated.

I would like to acknowledge the support of my family and my lovely girlfriend, Rachel. Thank you for
your patience and understanding for the last five years whilst I have attempted to balance work, study,
and family commitments.

                                                                                                         vi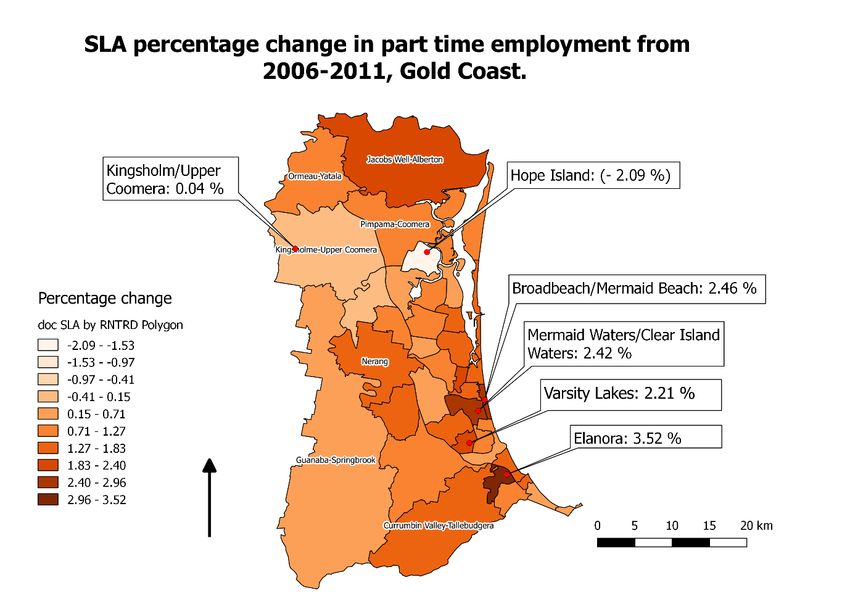
TABLE OF CONTENTS

ABSTRACT........................................................................................................................................... iii
List of figures.…….………………….……….……………………...…………………………………x
List of tables.......................................................................................................................................... xii
Glossary of terms .................................................................................................................................. xii

CHAPTER 1- INTRODUCTION ........................................................................................................... 1
           1.1 Background information for the research _____________________________________ 1
           1.2 Research design goals ____________________________________________________ 3
           1.3 Aims of the project_______________________________________________________ 3
           1.4 Research questions _______________________________________________________ 4
           1.5 Background information on the case study region (Gold Coast) ____________________ 4
           1.6 Employment centres______________________________________________________ 6
           1.7 Employment sectors ______________________________________________________ 6
           1.8 Household income and housing tenures_______________________________________ 7
           1.9 The structure of the dissertation _____________________________________________ 7

CHAPTER 2- LITERATURE REVIEW .............................................................................................. 10
           2.1 Spatial Mismatch Theory _________________________________________________ 10
           2.2 Importance of considering spatial mismatch __________________________________ 11
           2.3 The mechanisms of spatial mismatch _______________________________________ 11
           2.4 Spatial mismatch in Australia _____________________________________________ 12
           2.5 Public transport and social exclusion ________________________________________ 14
           2.6 Neighbourhood effects ___________________________________________________ 16
           2.7 Neighbourhood poverty and inequality ______________________________________ 17
           2.8 Patterns of urban employment _____________________________________________ 18
           2.9 Housing affordability ____________________________________________________ 20
           3.0 Housing occupancy and costs _____________________________________________ 23
           3.1 Australia’s rental market _________________________________________________ 25
           3.2 Literature review’s conclusion _____________________________________________ 27
CHAPTER 3 – METHODOLOGY……………………………...……………………………………28
           3.1 Quantitative research ____________________________________________________ 28
           3.2 Overview of the research design ___________________________________________ 28
           3.3 Case study design _______________________________________________________ 31
           3.4 Unit of analysis ________________________________________________________ 31
           3.5 Data collection methods __________________________________________________ 32
           3.6 Data presentation _______________________________________________________ 33

                                                                                                                                                        vii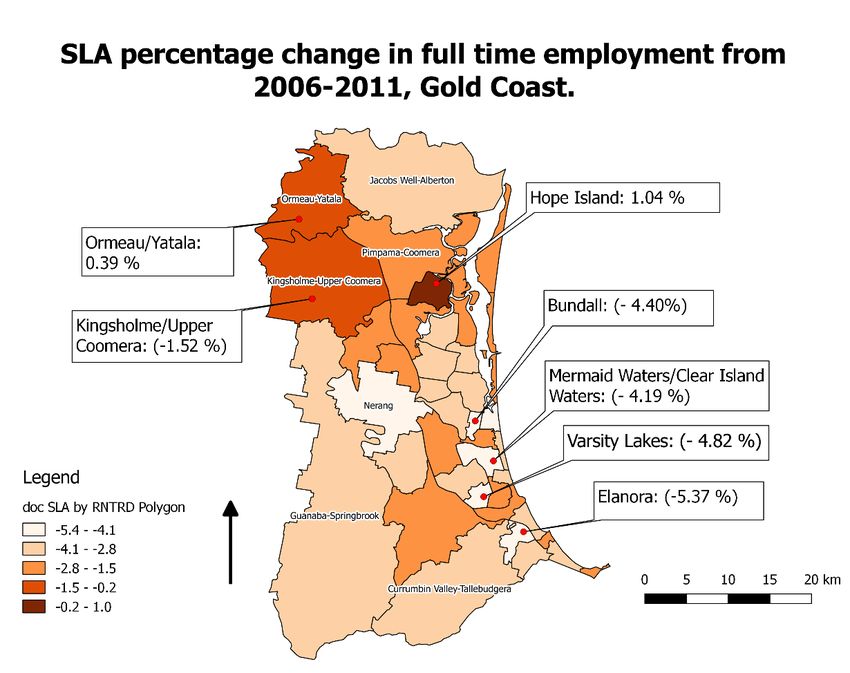
3.7 Research questions ______________________________________________________ 34
         3.8 Methods for responding to research questions _________________________________ 34

CHAPTER 4 – RESULTS AND DISCUSSIONS ................................................................................ 43
         4.1 Structure of results ______________________________________________________ 42
         Part I- Affordable housing, low income and high unemployment SLAs ________________ 43
                4.1.1 Housing rental expenditure __________________________________________ 44
                4.1.2 Housing mortgage expenditure _______________________________________ 46
                4.1.3 Low-income households ____________________________________________ 47
                4.1.4 Social housing spatial concentrations __________________________________ 48
                4.1.5 Unemployed residents ______________________________________________ 51
                4.1.6 Identifying three highly disadvantaged SLAs ____________________________ 51
         Part II- labour market disadvantage and opportunity _______________________________ 52
               4.2.1 Relative change in full-time employment _______________________________ 53
               4.2.2 Relative change in part-time employment _______________________________ 55
               4.2.3 Relative change in unemployment _____________________________________ 56
               4.2.4 Absolute change in the employment numbers ____________________________ 58
         Part III- Employment growth close to affordable housing ___________________________ 59
               4.3.1 Spatial mismatch at the SLA level _____________________________________ 60
         Part IV- Assessing public transport accessibility in the Gold Coast, Australia ___________ 61
               4.4.1 Background information on identified disadvantaged areas ________________ 66
               4.4.2 Discussion of public transport accessibility ______________________________ 66

CHAPTER 5 - CONCLUSION ............................................................................................................ 68
         5.1 Discussion of research questions ___________________________________________ 74
         5.2 Imlications of research findings ____________________________________________ 70
         5.3 Research recommendations _______________________________________________ 72
         5.4 Future research _________________________________________________________ 74
REFERENCE LIST ______________________________________________________________ 75

APPENDIX A- UNEMPLOYMENT AND EMPLOYMENT DATA ................................................. 82

APPENDIX B- PROJECT SPECIFICATION VERSION 3 ................................................................ 87

                                                                                                                                 viii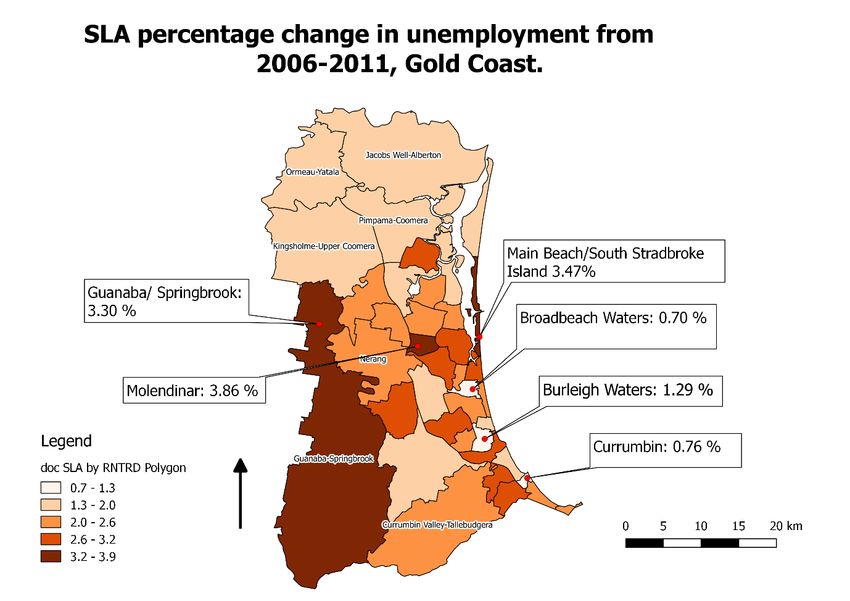
List of figures
Figure 1.1: The location of the Gold Coast in relation to the rest of Australia (Infomaps 2012, p.3)…4
Figure 1.2: Estimated resident population of Gold Coast City from 2005 to 2015 (ABS 2016, p.5) ....6
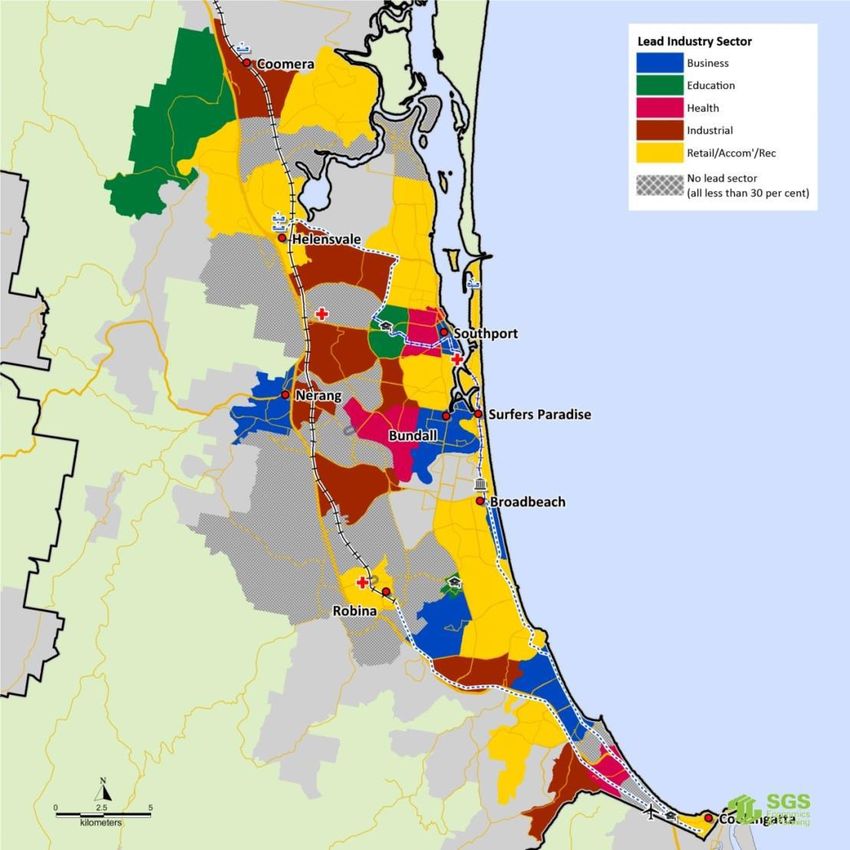
Figure 1.3: Lead industry sector by region in the Gold Coast City (SGS Economics and Planning
2013, p. 24). ............................................................................................................................................ 7
Figure 1.4: The factors creating the spatial mismatch urban environment in Australia (Mcmahon
2006, p.14). ......................................................................................................... ……………………..13
Figure 1.5: Spatial map of unemployment in the city of Brisbane (Queensland Treasury
and Trade 2013, p.6). ............................................................................................................................ 14
Figure 1.6: Gini Coefficient values—international comparison of distribution of individual
incomes (Pawson, Davison & Wiesel 2012, p.12)………...……………...………………...…………16
Figure 1.7: Real house prices by distance from CBD in Australia’s largest cities,
in 2009–10 AUD (State of Australian Cities 2013, p.12). .................................................................... 21
Figure 1.8: House price to household income ratio in all of Australia’s capital cities,
September 1995-September 2010 (HIA Economics Group 2010, p. 4)................................................ 24
Figure 1.9: Australian housing tenure, 1994-95 to 2011-2012 (ABS 2013b, p.1)…………...……....23
Figure 2.0: Research design methodology of the spatial mismatch and transport
quality assessment................................................................................................................................. 30
Figure 2.1: Number of houses in the Gold Coast region whom are paying less than
$250/week in rental payments……......………………………………………………………………..45
Figure 2.2: Number of houses in the Gold Coast region whom are paying less than $600/month
mortgage repayments. ........................................................................................................................... 46
Figure 2.3: Number of houses in the Gold Coast region whom have a household income of
less than $300/week . ............................................................................................................................ 47
Figure 2.4: Number of houses in the Gold Coast region which are government owned……………..49
ix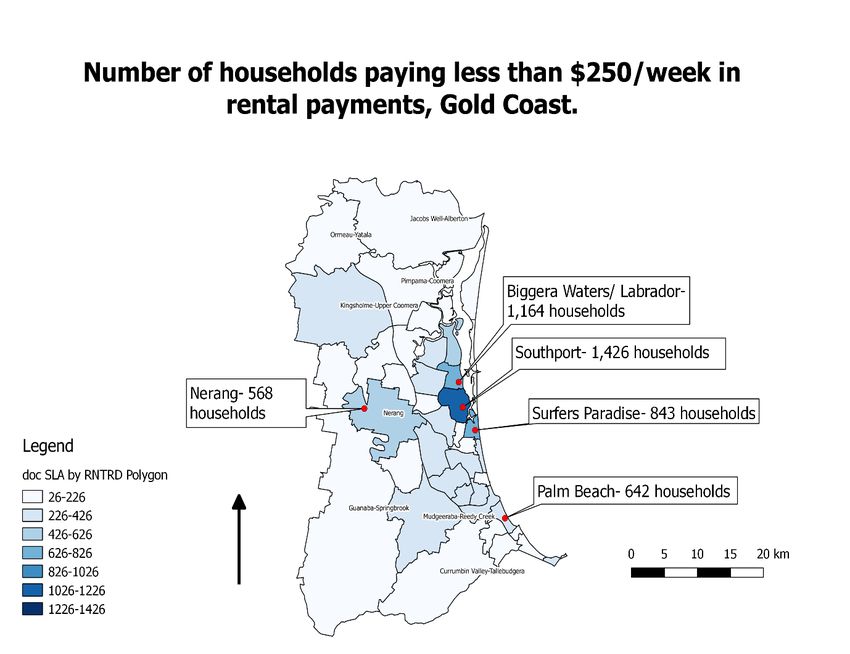
Figure 2.5: Total number of unemployed residents by SLA in 2011
(Source: generated 21st April 2016 using data provided by the ABS 2011 Census)............................ 50

Figure 2.6: SLA relative change in full time employment from the 2006 to the 2011 census
(For data see Appendix A)……………………………………………………………….……………55

Figure 2.7: SLA relative change in part time employment from 2006 to 2011 census
(For raw data see Appendix A.3)……………………………..……………………………………....55

Figure 2.8: SLA relative change in unemployment values from the 2006-2011 census
(For raw data see Appendix A.3). ......................................................................................................... 57

Figure 2.9: Absolute change in employment values from the 2006-2011 census
(For raw data see Appendix A.4). ......................................................................................................... 58

Figure 3.0: Employment location of residents by SLA. census
(For raw data see Appendix A.5). ......................................................................................................... 60

Figure A.1: Number of people that are considered: unemployed, and employed
(part-time, full-time and away from work), and the relative rates for each SLA in the
Gold Coast in 2006. .............................................................................................................................. 82

Figure A.2: Number of people that are considered in unemployed, and employed
(part-time, full-time and away from work), and the relative rates for each SLA in the
Gold Coast in 2011. .............................................................................................................................. 83

Figure A.3: Relative change in full time, part-time and unemployment, for each SLA,
in the Gold Coast from 2006 to 2011.................................................................................................... 84

Figure A.4: Absolute change in employment numbers (full-time + part-time + away from work)
and unemployed residents in each SLA in the Gold Coast from 2006 to 2011. ................................... 85

Figure A.5: Employment location of residents by SLA in 2011. ........................................................ 86

                                                                                                                                                   x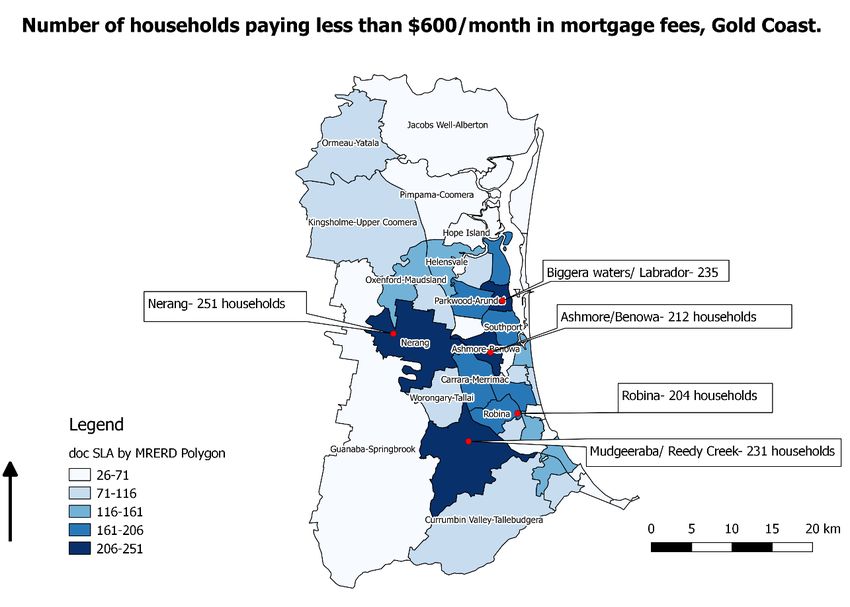
List of tables
Table 1.1: Incidence of income poverty changes over time (ABS 2013a, p. 16)................................. 18

Table 1.2: Affordable and available private rental stock for Q1 households by geographic area
(Wulff et al. 2011p.34).………………………………………………………………….…………….26

Table 1.3: Public transport accessibility criteria matrix…………………………….……….……….40

Table 1.4: Assessing spatial patterns of disadvantage in the Gold Coast ............................................ 40

Table 1.5: Project planner for the dissertation. .................................................................................... 42

Table 1.6: Criteria for deciding the low socio-economic SLAs. .......................................................... 51

Table 1.7: Number of new employment opportunities within a buffer zone of 15.6km from three
SLAs which have been identified as disadvantaged. ............................................................................ 59

Table 1.8: Public transport accessibility criteria matrix....................................................................... 63

                                                                                                                                     xi
Glossary of terms
ABS- Australian Bureau of Statistics
AHURI- Australian Housing and Urban Research Institute
AIHW- Australian Institute of Health and Welfare
BITRE- Bureau of Infrastructure, Transport and Regional Economics
CBD- Central Business District
CRA- Commonwealth Rent Assistance
DILGP- Department of Infrastructure, Local Government and Planning
DTMR- Department of Transport and Main Roads
ERP- Estimated Residential Population
EU- European Union
GIS- Geographic Information Systems
HILDA- Household, Income and Labour Dynamics in Australia
IRSD- Index of Relative Socio-Economic Disadvantage
LGA- Local Government Area
OECD- Organisation for Economic Co-operation and Development
PTIM- Public Transport Infrastructure Manual
SD- Statistical Division
SEIFA- Socio-Economic Index for Areas
SEQ- South East Queensland
SLA- Statistical Local Area
SMT- Spatial Mismatch Theory
UK- United Kingdom
US- United States
xiiCHAPTER 1- INTRODUCTION
This chapter introduces the field of study, and discusses the background for the research, and the
development of the research topic. It also discusses the research questions that are investigated. Finally,
the formal structure of the dissertation, and its main contents are discussed and presented.
1.1 Background information for the research
In the recent decades there has been significant global academic interest concerning the ways in which
housing and labour markets affect urban socio-spatial patterns, specifically in terms of their effect on
labour market outcomes of low socio-economic communities (Andersson et al. 2014; Gobillon, Selod
& Zenou 2003; Kain 1992). Spatial divisions between neighbourhoods, based on socio-economic status,
have increasingly been emerging in many large cities all over the world. In Australian context, most
urban scholars agree that the spatial divisions are predominantly due to the ongoing restructuring of
housing markets, and changes in patterns of urban employment resulting from the effects of
globalisation (Dodson 2005; Pawson, Davison & Wiesel 2012). Such that, residential housing markets
in Australian cities are forcing low income households into outer-urban areas, which are typically more
affordable. However, these areas characteristically contain lower employment opportunities; thereby,
creating a spatial mismatch of employment to affordable housing (Dodson 2005). The issues
surrounding spatial mismatch are further exacerbated in outer suburban areas in Australia, by less
frequent, and less accessible public transport (Dodson et al. 2006).
The research reported in this dissertation builds from extensive contemporary academic literature
highlighting the issues relating to Spatial Mismatch Theory (SMT). SMT was first defined by Kain
(1968, p.9): ‘as a mismatch between where low-income households reside, and suitable job
opportunities’. Kain’s (1968) findings suggested that persistent high unemployment in urban black
communities, was due to a movement of jobs away from their residences, coupled with the inability
(due to housing market mechanisms) for the residents to move closer to employment rich areas. This
discovery helped significantly shift United States (US) government policy towards: moving jobs closer
to neighbourhoods with high unemployment, and by enhancing transportation links between high
unemployment neighbourhoods, and employment centres (Andersson et al. 2014).
Kain’s (1968) paper spawned a large amount of empirical research, testing the theory, which has been
summarized by Kain (1992), and Ihlanfeldt and Sjoquist (1998). Although, the summarised articles
have been critical of some work, there is nevertheless considerable evidence that poor job accessibility
is partially responsible for poor labour market outcomes in the US. However, there still remains
considerable disagreement about the magnitude of the spatial mismatch effect, and about which groups
of workers are most affected by it (Ihlanfeldt 2006). Recently, Andersson et al. (2014), tried to
1overcome these issues by conducting the largest scale investigation to date, on spatial mismatch. The
researchers examined employment data from 250,000 poor Americans, living in nine cities in the
Midwest of the US. The research, which not only included a large sample size, was also longitudinal,
with the authors repeating observations over six years. This large scale research ultimately supported
Kain’s (1968) SMT, concluding that better job accessibility significantly decreased the duration of
joblessness among lower-paid displaced workers (Andersson et al. 2014).
SMT has not just been applied and tested in the US, French urban researchers Gobillon, Selod, & Zenou
(2003), identified that neighbourhood segregation, based on socio-economic status, prevented
unemployed Parisians from finding work. Furthermore, research conducted in England, identified that
individuals who live far from employment centres spend considerably less time (more than 1 month)
looking for work, compared to people who live nearby to employment centres (Patacchini & Zenou
2005).
Despite strong urban research interest in spatial mismatch overseas, there has been little contemporary
literature on SMT in Australia. Hunter (1995) tested for its presence in every capital city in Australia,
and identified that Sydney showed evidence of spatial mismatch. Dodson (2005), applied the theory in
Melbourne, and despite not identifying significant evidence of spatial mismatch; the research did
identify that poor public transport in outer suburban areas was exacerbating the issues related to SMT.
More recently, research by the Queensland Treasury and Trade (2013) identified a significant spatial
trend of increasing unemployment (>4 percent) in outer suburban areas relative to inner central areas,
in the state’s capital, Brisbane.
Identifying spatial mismatch patterns through research is important as it helps urban policy makers
make more informed decisions in determining the whereabouts of future employment hubs. This
informed decision making helps reduce unemployment rates in SMT affected areas, which inevitably
helps reduce the associated social problems relating to high unemployment (Dodson 2005). With spatial
patterns of unemployment, set to rise in Australia; due to globalising forces reducing manufacturing
employment, and a steady increase in automated employment (State of Australian Cities 2013).
Research on spatial mismatch patterns in Australia, and the commuting such divisions necessitate is
considered integral in reducing locational disadvantage (Dodson 2005). However, to date, there has
never been an empirical analysis, of the overlap between spatial dimensions of affordable housing and
employment (and associated commuting divisions) in the city of Gold Coast; thus, the following
research was considered practical.
21.2 Research design goals
The research in this dissertation comprises a desktop analysis on spatial mismatch and public transport
quality in the case study city of the Gold Coast. The goals of the research are threefold; the first goal is
to spatially investigate employment opportunity nearby to disadvantaged areas, with the aim to test for
the presence of spatial mismatch. The second part of the dissertation investigates whether public
transport in disadvantaged areas, provides an ‘adequate level of service’ for temporally flexibility in
employment. Specifically, with the aim to identify if ‘spatial mismatch is evident, does public transport
provide adequate services for a person with temporally flexibility in employment?’ The third goal of
the research was to build on already existing knowledge on spatial mismatch in Australia, which has
been developed by other urban scholars (Dodson 2005; Hunter 1995; McMahon 2006).
1.3 Aims of the project
The main aim of this research project is to examine the links between spatial labour markets and spatial
housing markets in terms of whether there is a spatial mismatch between socio-economically
disadvantaged areas and locations of high employment opportunity in the case study region of the Gold
Coast. A secondary objective is to assess whether public transport accessibility is adequate to provide
high quality access, to temporally flexible employment opportunities, for households in the low socio-
economic case study areas. As huge swathes of urban literature identify that highly accessible public
transport is integral in bridging the spatial divide between low socio-economic communities and
employment rich areas (Dodson et al. 2006; Gleeson & Sipe 2004; Taylor & Ong 1995).
Urban policy planners must ensure affordable housing areas have access to areas of high employment
opportunity, either through adequate public transport infrastructure, and by implementing policies
which create employment in these areas. However, in order to implement adequate policies, high quality
evidence based localised research is fundamental, firstly to identify the relevant issues, and secondly,
to implement adequate localised solutions. Due to the uniqueness of urban societies, localised policies
are the key to mitigating the long-term problems associated with disadvantaged low socio-economic
communities in a region.
Since the mid-1970s, income inequality in Australia has widened, and academic researchers have been
documenting an increase in socio-economic segregation and locational disadvantage (Pawson, Davison
& Wiesel 2012). By investigating these issues, the project traverses a series of government policy
interests, as affordable housing areas typically coincide with high concentrations of households
receiving income support payments in Australia (Dodson 2005). Policy makers have a duty to ensure
that individuals receiving income support are enabled to access high employment locations; thereby,
helping to reduce the burden that these individuals place on government expenditure. Similarly, state
governments raise tax revenues from their residents, thus, they also have an interest in ensuring
3equitable outcomes from their planning policies. Increasing access to employment in affordable housing
areas, does not simply improve the quality of life for the people living in disadvantaged areas, it also
been shown to improve a city’s overall productivity (Li, Campbell, & Fernandez, 2013). The research
questions to be investigated in this research project are discussed in the following section.
1.4 Research questions
This project will examine and address a set of four interconnected research questions, focusing on the
location of affordable housing, regions of employment, and associated transport issues in the Gold
Coast.
1. What are the spatial patterns of housing affordability for different housing tenures (mortgages
and renters), low income households, social housing concentrations, and unemployment?
2. What are the spatial patterns of unemployment concentration and employment location in the
Gold Coast?
3. Is there evidence of a spatial mismatch in the Gold Coast between the locations of affordable
housing and locations of employment opportunity?
4. Does public transport in identified low socio-economic SLAs, provide accessibility for
employees with temporally flexible working conditions?
A little background information is provided in the following section for the case study area of the Gold
Coast.
1.5 Background information on the case study region (Gold Coast)
The Gold Coast is a coastal city in South-East Queensland (SEQ), which is located east of the Great
Dividing Range, it lies just north of the border to New South Wales. It is approximately 66 kilometres
southeast of the state capital, Brisbane (Infomaps 2012) (See Figure 1.1).
Figure 1.1: The location of the Gold Coast in relation to the rest of Australia (Infomaps 2012, p.3).
4The Gold Coast is the second most populous city in the state of Queensland, after the capital, Brisbane.
The estimated residential population in the Gold Coast in 2015, was 555,608, which is an increase of
9,757 from the previous year (See Figure 1.2). The study period focused on in this research is between
2006 to 2011; whereby, during this period there was 65,127 new residents in the city of the Gold Coast.
The Gold Coast has seen a steady trend of population growth, with the city expected to double to nearly
800,000 by 2031 (SGS Economics and Planning 2013). The city is also Australia’s tourism mecca, with
nearly 12 million visitors visiting the region each year (SGS Economics and Planning 2013).
Figure 1.2: Estimated resident population of Gold Coast City from 2005 to 2015 (ABS 2016, p.5).
The Gold Coast has a mix of traditional town centres, tourist resort areas, major stand-alone regional
shopping facilities, and industrial and commercial precincts. The Central Business District (CBD) of
the city is Southport; however, the central tourism district is in the nearby suburb of Surfers Paradise.
Industries typical of CBDs, such as government, law and finance, are dispersed outside the principal
areas of Southport and Surfers Paradise The planning document by SGS Economics and Planning
(2013), described the urban form on the Gold Coast as a series of linear strips or bands that run parallel
to the coast: the beach strip, the high-rise tower/residential coastal strip, the highway strip, the canal
estates, the suburbs, and on the western most edge, the semi-rural hinterland.
The city aligns closely with its 57 km coastline, paralleling the north–south oriented Pacific Motorway,
and mountain ranges in the hinterland mountain ranges (GCCC, 2005). SGS Economics and Planning
(2013) identified the urban form of the city with the distinct high-rise developments along the coastline,
and the urban sprawl radiating westerly as unique to the region. In 1986, Australia’s first master-
planned resort and gated community, Sanctuary Cove, was established in the region (SGS Economics
5and Planning 2013). The city was also the pioneer of individually saleable strata titled apartments, and
home to the first timeshare developments in Australia (SGS Economics and Planning 2013).
1.6 Employment centres
According to the planning document by SGS Economics and Planning (2013), traditional centres
accounted for 53 percent of jobs; whereas, employment nodes accounted for 32 percent, with the
remaining 27 percent dispersed throughout the region. The same study identified the key regional
centres, which are centres with over 250,000 people; located in Surfers Paradise, Southport and Robina.
Smaller regional centres, which are between 100,000-250,000 people, are located in Nerang,
Broadbeach, Burleigh, Coomera, and Coolangatta. SGS Economics and Planning (2013) document also
noted that there is expected to be employment growth in the coastal regions of Mermaid Beach,
Helensvale, Miami, Mermaid Waters and Surfer’s Paradise in the coming years. Recently, the CBD
area of Southport has been recognised as a Priority Development Area (PDA), which has helped drive
new investment into the CBD (SGS Economics and Planning 2013). This has rapidly changed the
patterns of employment in the city, by helping to focus more employment close to the CBD.
1.7 Employment sectors
The main sector of employment is retail trade, which employs 12.4 percent of residents (ABS 2011).
This is followed by construction, health care and social assistance, which employ 11.3 percent and 11.1
percent of the population, respectively (ABS 2011). A large number of residents are also employed in
accommodation and food services, which is attributed to the large number of tourist visiting the city
each year (ABS 2011). Manufacturing also plays a large role in the labour market, employing 7.6
percent of the population; however, like in many other western cities in the world, this figure is rapidly
declining (ABS 2016) (See Figure 1.3).
6Figure 1.3: Lead industry sector by region in the Gold Coast City (SGS Economics and Planning 2013, p. 24).
1.8 Household income and housing tenures
A 2011, analysis of household income levels in Gold Coast City, compared to greater Brisbane shows
that there was a smaller proportion of high income households (those earning $2,500/week or more)
and a higher proportion of low income households (those earning less than $600/week) (SGS
Economics and Planning 2013). The median weekly rent was $350/week and the median household
weekly income was $1,174, which was $214 below Brisbane’s weekly household income (ABS 2011).
In Gold Coast City, 58 percent of households were purchasing or fully owned their home, 31.1 percent
were renting privately, and 2.3 percent were in social housing in 2011 (ABS 2011).
71.9 The structure of the dissertation
This research dissertation is structured into five chapters, Chapter 1, introduces the field of study,
background information on relevant research on spatial mismatch, the main aims of the project, and the
research questions to be investigated. It also details some background information on the case study
region of the Gold Coast, and provides a concise outline on the structure of the dissertation.
Chapters 2, the literature review, identifies previous research concerning the links between urban labour
markets, urban housing markets, social status and transport accessibility. The chapter makes up six
major sections: spatial mismatch, public transport and social exclusion, neighbourhood effects, patterns
of urban employment, housing affordability, and ultimately a summation of the literature reviews key
findings.
Chapter 3, presents and discusses the procedures used to answer the research questions, and the
methodology designed for the project. It also includes, the relevant methods of investigation and
arguments for why these methods were considered suitable for the circumstances. The chapter also
provides a discussion on: the risks involved in the investigation, associated ethical issues, and relevant
timelines.
Chapter 4, illustrates and discusses the results of the spatial mismatch analysis, and the transport
accessibility matrix. This is broken up into four main sections,
1. Part I- identifies the low socio-economic areas in the Gold Coast, Australia.
2. Part II- analyses the relative changes in full-time, part-time employment and unemployment,
and the absolute change in employment, in the Gold Coast from 2006- 2011.
3. Part III- assesses employment growth close to affordable housing for the presence of spatial
mismatch.
4. Part IV- assesses public transport accessibility in the Gold Coast, Australia.
Part I, II, III- identifies, analyses, and assesses the socio-spatial links between SLAs where housing is
affordable, and where employment opportunities are expanding on the Gold Coast. The analysis uses
ABS data on housing costs to identify, which locations housing is most affordable. The analysis also
identifies the spatial patterns of unemployment across the Gold Coast, and classifies SLAs that exhibit
both low housing cost and high unemployment. Part II concludes with an investigation of the
accessibility of employment surrounding the identified SLAs.
Part IV- assesses the relationship between housing affordability and employment accessibility in terms
of transportation options. The accessibility of public transport for three chosen case study SLAs is
8evaluated, in relation to the frequency, accessibility and availability necessary to provide employment.
The report then considers the relative economic burden of different transportation modes on an
individuals’ capacity to access employment.
Chapter 5- concludes with the key findings and recommendations, to help direct government policy.
9CHAPTER 2- LITERATURE REVIEW
This chapter presents the SMT, and the importance of the consideration of this theory in urban planning.
The chapter also discusses relevant literature on the different mechanisms which are associated with
spatial mismatch. The chapter concludes with a discussion of the findings of previous spatial mismatch
analyses in Australia, and the identification of a gap in spatial mismatch research in the case study area.
2.1 Spatial Mismatch Theory
Spatial mismatch is normally defined as unemployment resulting from spatial division between an
employee’s place of residence and prospective place of employment; however, the mismatch can also
be manifested by wages and commuting costs (Gobillon, Selod and Zenou 2003). During the second
half of the 20th century, the majority of wealthy citizens of the US started leaving inner city regions,
and moving to suburban areas. As a result, many businesses started leaving inner city metropolitan areas
and moving to these affluent neighbourhoods. This decentralisation of employment led to the
development of Kain’s (1968) highly influential SMT (Andersson et al. 2014). Kain’s (1968) theory
argued that a major cause of high unemployment rates of African Americans in US cities was due to
the spatial disconnection between inner-city ghettos (where African Americans resided) and the suburbs
(where employment had begun to decentralise). According to Kain (1968), this ‘spatial mismatch’ of
African-American workers relative to employment, was the major cause in entrenching them into a
cycle of poverty and high unemployment. Thus, Kain (1968) established that—distance to employment
centres is directly correlated with increased unemployment rates. This paper created a flurry of literature
on the topic, with many researchers attempting to test, address and refine the theory (Dodson 2005,
Holzer 1991; Ihlanfeldt & Sjoquist 1998; Kain 1992 & 2004).
The SMT is not without some critics however, who have criticised the theory on both theoretical and
empirical terms. Taylor and Ong (1995) suggesting that spatial mismatch is not the issue, it is an
‘automobile’ mismatch issue. Whereby, lower income households in the US, have lower rates of private
vehicle ownership; thus, are not able to access suburban employment. Moore and Laramore (1990),
suggest that the problem is not with spatial mismatch, but more of a skills mismatch; whereby,
disadvantaged households do not possess the necessary skills to benefit from available employment
opportunities. In this characterisation, spatial mismatch is understood as a mismatch of labour skill
resulting from the transition from the old economy to a ‘higher order’ labour market. Comparatively,
research by Sanchez (1999) using modelling for Portland and Atlanta in the US suggests that proximity
to public transport is the major factor in determining labour participation for low income households.
Despite the criticism, Kain’s theory is supported by empirical findings of many other researchers in the
US (Jencks & Mayer 1990; Holzer, 1991; Wheeler 1993; Ihlanfeldt & Sjoquist, 1998). Recently,
10Andersson et al. (2014), conducted the largest scale investigation to date, on spatial mismatch. The
researchers studied employment data from 250,000 poor Americans, living in nine cities in the Midwest
of the US. The research, which not only included a large sample size, also repeated observations over
six years, with the findings ultimately supporting Kain’s (1968) theory.
SMT has also been studied in France, Gobillon, Selod, and Zenou (2003), identified that neighbourhood
segregation prevented unemployed Parisians from finding work. Furthermore, research conducted in
England, concluded that those who live far from jobs spend less time looking for work than those who
live nearby (Patacchini & Zenou 2005). Thus, the weight of evidence suggests that distance to jobs is
indeed partially responsible for the adverse labour market outcomes experienced by disadvantaged
groups residing in some cities. In the past decade, a growing awareness of the worsening problems of
spatial patterns of poverty and unemployment, has rekindled interest in the theory of spatial mismatch.
2.2 Importance of considering spatial mismatch
According to Kain (1992), spatial mismatch between workers and employment is a policy concern for
two main reasons. Firstly, labour surplus in lower socio-economic areas contribute to high
unemployment in these areas. Secondly, other locations may experience labour shortages which restricts
economic growth in the region (Kain 1992). According to Li, Campbell and Fernandez (2013) who
analysed data of US metropolitan areas spanning 25 years in several US cities, identified that spatial
segregation negatively impacted short and long term economic growth, which further increased over
time. A further consideration in the issues relating to spatial mismatch is the longer commutes faced by
lower income workers who choose to live where housing is affordable. Longer commuting times by
employees, according to Yates (2005), are said to inflict costs on employers: by increased absenteeism,
higher staff turnover, prolonged recruitment periods to find replacement staff, and extra costs associated
with training of staff.
2.3 The mechanisms of spatial mismatch
Gobillon, Selod and Zenou (2003), in their investigations in France provide several reasons why
increased distance to employment impact the labour market outcomes for mismatched communities.
Firstly, personnel living far away from employment are subject to reduced frequency and quality of job
information. Secondly, employers typically favour locally-based recruiting techniques. Thirdly,
financial incentives are often insufficient to motivate distant workers to relocate, because relocation
costs and higher rents are often not compensated by earnings. Finally, inadequate and expensive public
transport may further exacerbate these issues (Gobillon, Selod & Zenou 2003). The spatial mismatch
phenomenon has also been researched in an Australian context.
112.4 Spatial mismatch in Australia
Contrastingly, to the classic US case, Australia’s spatial pattern of disadvantaged neighbourhoods tend
to be located in the low rent areas on the edge of the cities, which have relatively poor access to the
labour market because of the distances involved (Hunter 1995). Furthermore, certain older, inner
suburbs also have concentrations of underprivileged neighbourhoods (Hunter 1995). These suburbs are
the closest things that Australia has to inner-city ghettos, which is a well-documented urban
phenomenon in many large US cities.
An early Australian study by Hunter (1995) tested for the presence of spatial mismatch in all of
Australia’s capital cities, using longitudinal ABS data, between 1986 and 1991. The research concluded
that, spatial mismatch within or between Australian cities, was not a defining element in determining
employment levels in most case study cities; however, there was presence of the phenomenon in
Sydney. He also noted that:
‘Even in Sydney spatial mismatch was a very limited part of the explanation of the dispersion of
employment–population ratios. Personal characteristics, such as human capital and various demographic
variables, explain most of the variation of employment–population ratios in Australia's largest city’
(Hunter 1995, p. 195).
Spatial mismatch has also been researched in Australia’s second largest city of Melbourne by Dodson
(2005). Dodson (2005), however, did not identify spatial mismatch in the city, as despite the fact that
housing markets were forcing low income households into outer suburban areas, the number of
corresponding jobs were also increasing in those areas (Dodson 2005). Nevertheless, he noted that,
‘poor public transport services may play a role in obstructing employment accessibility for residents in
low socio-economic areas’ (Dodson 2005, p.43). Furthermore, inhabitants of these areas may not
possess the skills or qualifications to allow them to gain access to work in these employment growth
areas (Dodson 2005). Despite Hunter (1995) and Dodson (2005), both unable to find significant
evidence to support the SMT in Australia, there has been more contemporary research on the issue.
More recently, a study by McMahon (2006) identified the presence of spatial mismatch in Sydney. The
research identified several key integrating factors, which helped create the spatial mismatch urban
environment in the city (See Figure 1.4). McMahon (2006) identified that a major cause of spatial
mismatch in the city was due to a lack of affordable housing in inner central areas, which inevitably
helped push out low income households into outer suburban areas distant from employment areas.
12Figure 1.4: The factors creating the spatial mismatch urban environment in Australia (McMahon 2006, p.14).
Even more recently, a spatial snapshot was released by the Queensland Treasury and Trade (2013),
which used ABS data to map unemployment rates in the Queensland capital of Brisbane. The data
shows a clear spatial differentiation between unemployment rates in inner city areas, compared to outer
suburban areas (See Figure 1.5). These findings have significant implications on the ensuing research,
which tests for the presence of SMT in the case study city of the Gold Coast.
13Figure 1.5: Spatial map of unemployment in the city of Brisbane (Queensland Treasury and Trade 2013, p.6).
2.5 Public transport and social exclusion
According to several studies, the key to reducing spatial disadvantage in urban environments is by
making public transport more accessible, especially for disadvantaged communities (Mees 2000;
Dodson et al. 2006; Burke & Stone 2014). In the context of increasing inequality and changes in urban
employment patterns; research in assessing spatial disadvantage and the underlying mechanisms, such
as public transport access, remains an important issue for urban policy planners in Australia. Globally,
there is strong empirical evidence on the causal relationship between improving public transport
infrastructure, and reducing the effects of locational disadvantage (Murray & Davis 1998; Sanchez
1999; Gleeson & Randolph 2001). Fan et al. (2012) identified that the construction of a light rail line in
Minneapolis-Saint Paul (US), increased access to both low-wage and high-wage jobs. Furthermore, Liu
(2014) documented a similar positive effect on job accessibility along a new light rail line in Phoenix
(US), which was more pronounced for lower income groups.
Households earning low incomes are particularly affected by the factors attributed with locational
disadvantage, as these households are forced by housing market mechanism to outer-suburban areas,
where housing is more affordable (Dodson 2005). These outer suburban areas in Australia, according
to research by Dodson et al. (2006), are typically serviced by less frequent, and less accessible public
transport; thereby, creating socially disconnected communities with high levels of motor vehicle
dependence. This growth in private vehicle dependence, and a lack of investment in public transport
infrastructures, has driven new forms of financial hardship for low socio-economic households (Dodson
14et al. 2006). This financial hardship is attributed to the increasing fuel costs, registration fees, insurance,
and other miscellaneous costs, which are associated with running a private vehicle. Low income
households which cannot meet the associated costs of running a private vehicle, combined with
inaccessible public transport, has been proven to increase the deleterious effects of spatial mismatch
(Dodson 2005).
Locational Disadvantage
Locational disadvantage is generally conceived as attributable to residential remoteness from
employment and services—for instance dependent on whether the locality is serviced by CBD—
connected road or rail links (Burke & Stone 2014). However, locational disadvantage is a multi-scalar
concept. Meaning that there are varying degrees of disadvantage even within suburbs, particularly in
relation to vehicle less low-income households. This means that residents living beyond walking
distance of a station or good bus route will experience another level of locational disadvantage. Poor
outcomes along a range of socio-economic dimensions, e.g. health, increased crime rates and
unemployment levels; have all been attributed to locational disadvantage (Burke & Stone 2014).
Hunter (1995) states that the key to addressing locational disadvantage is by identifying and eliminating
imperfections in the housing market and by improving public transport in low-status neighbourhoods.
However, the extent to which different socio-economic groups are able to negotiate urban space to
access goods, services and employment opportunities using public transport, remains underdeveloped
in the Gold Coast. It is therefore not surprising then that only 2.9 percent of Gold Coast residents use
public transport to go to work, which is less than half the rate for Queensland as a whole (6.5 percent)
(ABS 2011). Furthermore, the proportion of trips made by Brisbane residents on public transport was
more than double that of the Gold Coast in 2009 (Public transport travel 2012). Another study, by
Dodson et al. (2006), in the Gold Coast, discovered that lower socio-economic areas typically had
poorer access to public transport services compared to more affluent areas. The team also identified
that unemployed people and residents under the aged of fifteen had poorer access to public transport as
compared to the total population by Dodson et al. (2006). With the current youth unemployment rate
sitting at approximately 16.5 percent on the Gold Coast (ABS 2016), these findings by Dodson et al.
(2006), despite being ten years old, still have significant implications on the following research on
spatial mismatch and public transport accessibility.
Recently, propelled by the globalising effects of economic restructuring and business uncertainty,
Australia’s labour market has shifted towards more part-time and casual employment; with greater
flexibility in working hours, beyond the conventional forty-hour working week (Australian Social
Inclusion Board 2009). According to Australian Social Inclusion Board (2009), low socio-economic
individuals are more likely to be employed in casual employment, as they typically lack the skills
15required to perform complex tasks. Casual work often involves flexible working hours, often early/late
shifts, or weekend work (Australian Social Inclusion Board 2009), thus, it is critical that public transport
services are capable of providing services with temporal flexibility in order to provide for the needs of
casually employed staff. Lack of late night, early morning, and weekend transport services forces low
socio-economic households to access a private vehicle, which adds a considerable cost to a household.
According to research by the Royal Automobile Club of Queensland Limited (RACQ 2016), the cost
of running a medium size car is approximately $213/week. Comparatively, according to ABS (2013b),
the average equivalised household income for a low income household in Australia in 2013, was
$407/week, this amounts to a considerable additional expense for these households. Thus, another
significant aim in this research is to identify if public transport in the Gold Coast, provides an ‘adequate
level of service’, which allows for temporal flexibility in employment in identified low socio-economic
areas.
2.6 Neighbourhood effects
In the past two decades a vast body of literature has been published on neighbourhood effects—the idea
that living in deprived neighbourhoods has a negative effect on residents’ life chances, above individual
characteristics (Atkinson & Kintrea 2000; Holmes-Smith 2006; Galster 2012; Reynolds & Wulff 2005).
This section provides evidence on the problems associated with neighbourhood poverty, and the
identified negative consequences for individuals growing up in disadvantaged communities. It also
offers evidence on the increased widening of the economic divide within Australian society, which is
contributing to the problems associated with neighbourhood effects.
Neighbourhood effect hypothesis
The ‘neighbourhood effect hypothesis’ refers to the notion that living in a poor neighbourhood can help
further compound the impact of poverty and disadvantage affecting an individual (Atkinson & Kintrea
2000). There is evidence that specific locations exhibit poor outcomes along a range of socio-economic
indicators over a prolonged period, both in the US and Europe (Galster 2012). In Australia, research by
Holmes-Smith (2006) showed that schools with disadvantaged catchment populations, generally
recorded lower achievement than national norms. Aspects of the physical environment of neighbour-
hoods have also been associated with physical activity and obesity in Australian children. Timperio et
al. (2005), identified that limited public transport in the neighbourhood has been shown to be a barrier
to children’s walking and cycling, and to overall physical activity. Furthermore, Homel and Burns
(1989) reported that children with higher levels of worry, fear, anger and unhappiness lived in
disadvantaged neighbourhoods. Of particular importance is the influence that neighbourhood effects
have on young children, as the first five years of a child’s life are critical for their development
(Atkinson & Kintrea 2000). Urban policy makers need to be aware that increases in neighbourhood
16You can also read