The positives and negatives of electricity storage - August 2018 - SIMEC ...
←
→
Page content transcription
If your browser does not render page correctly, please read the page content below

August 2018

The positives and negatives
 of electricity storage
 Cantor Fitzgerald Europe Equity Research

 Adam Forsyth
 Research Analyst
 +44 131 257 4623
 aforsyth@cantor.co.uk
21 August 2018 | Sector Note | Alternative Energy & Resource Efficiency Equity Research | UK
The positives and negatives of electricity storage

 Affordable electricity storage is likely to accelerate the energy transition
ELECTRICITY STORAGE
 in our view. But storage is complex and lithium ion batteries in particular
Storage and renewable development are only part of the answer. We see this as creating opportunities at
Leclanché different points in the market, notably in project development,
Electro Power Systems
 complementary technologies, control systems, renewables and in new
SIMEC Atlantis
Plutus Powergen
 storage technologies.
Windar Photonics
 Lithium ion is a key part of the energy transition
Complementary storage technologies Lowering costs and better performance from lithium ion batteries are changing both
AFC Energy transportation and electricity markets, accelerating the growth of electric vehicles and
CAP-XX renewable energy and driving the transition to a low carbon world. We think the
Ceres Power relationship between EV demand and infrastructure needs in particular will accelerate
RedT demand for lithium ion storage.
ITM Power
 Lithium ion is not the only solution
Ilika
 But lithium ion has persistent limitations in terms of economics and performance.
 These do not rule out lithium ion as a major component of the energy transition but it
 also creates opportunities for other solutions, notably outside the economic operating
 limits of lithium ion.

 Supercapacitors and LTO for very short duration
 We identify four key storage market segments based on storage duration. Very short
 duration markets for frequency management and the internet of things play to the
 strengths of supercapacitors and lithium titanate cells. Gel and solid state batteries are
 new technologies that could also win a share of this growing market.

 Lithium ion remains dominant for short and medium durations
 Short duration markets for frequency response remains a key area of opportunity for
 lithium ion technologies both NMC and LTO. Medium duration is again the preserve of
 lithium ion which we think will increasingly displace diesel and gas for electricity
 storage systems. It is also the market where urban transport lies and again we expect
 to see lithium ion dominate here.

 Flow batteries and fuel cells look to gain at longer durations
 At longer durations lithium ion suffers on both cost and performance. We see flow
 batteries emerging for mid durations and at longer durations hydrogen-based
 solutions including fuel cells coming to the fore. We note in particular this year’s KPMG
 survey of automotive executives which put fuel cell vehicles as the real breakthrough
 in electric mobility.

 Opportunities in development, technologies and renewables
 We see a number of listed companies who are exposed to the opportunities as these
 markets develop. In storage development Leclanché, Electro Power Systems, SIMEC
 Atlantis and Plutus Powergen are all active to a greater or lesser extent. Leclanché and
 Electro Power Systems complement this activity with strengths in storage control.
 There are a number of companies progressing opportunities in the supercapacitor
Adam Forsyth hydrogen, flow battery and solid state battery spaces including AFC Energy, CAP-XX,
Research Analsyt
+44 (0) 131 2574623
 Ceres Power, RedT, ITM Power and Ilika. SIMEC Atlantis and Windar Photonics can
aforsyth@ cantor.co.uk also benefit as storage facilitates further growth in renewables.

This is a marketing communication. It has not been prepared in accordance with legal requirements designed to promote the independence of investment research and is
not subject to any prohibition of dealing ahead of the dissemination of investment research. However, CFE has put in place procedures and controls designed to prevent
dealing ahead of marketing communications. For institutional clients use only. Please see important regulatory disclaimers and disclosures on pages 77-80
Alternative Energy & Resource Efficiency | The positives and negatives of electricity storage

 Table of Contents

 The positives and negatives of electricity storage 3

 Why batteries are a hot idea 10

 Battery limitations 15

 Lithium ion is not the only solution 35

 Storage technologies compared 45

 Leclanché 51

 Electro Power Systems 54

 SIMEC Atlantis Energy 57

 Plutus Powergen 60

 Windar Photonics 63

 AFC Energy 66

 CAP-XX 69

 Ceres Power Holdings 72

 RedT Energy 73

 ITM Power 74

 Ilika 75

2 Cantor Fitzgerald Europe Research
The positives and negatives of electricity storage Alternative Energy & Resource
Efficiency |

 The positives and negatives of electricity storage

 Lithium ion is having a revolutionary impact on both stationary and mobile energy
 markets. Costs have come down and energy density, the amount of energy stored per
 unit of weight, has gone up.

BNEF Lithium Ion Battery Price Survey Lithium Ion Battery Gravemetrc Energy Density
 1200 300

 1000 250

 800 200
 US$/kWh

 Wh/kg
 600 150

 400 100

 200 50

 0 0
 2009 2010 2011 2012 2013 2014 2015 2016 2017 2018 1990 1995 2000 2005 2010 2015

Source: BNEF Source: Joint Centre for Energy Storage Research

 Storage can already down deliver investable paybacks without the need for subsidies
 in key applications. Genuinely objective data in this highly competitive environment
 can be difficult to source but there have been some helpful academic works in recent
 years which demonstrate the undoubted progress.

Studies of Battery Payback Period

Application Behind the meter PV support Electric Bus Behind the meter PV Offshore support vessel
 support

Payback period (years) 14.0 7.7 7.2 5.0
Study National Renewable Energy Columbia University for New York City Universities of Liege and Norwegian School of
 Laboratory Transit Aalborg Economics
Date Nov-15 May-16 Dec-16 Dec-16

Source: CFE Research estimates

 As a result, demand for storage is expected to grow dramatically led by electric
 vehicles (“EVs”) and electric buses. Storage for consumer electronics continues to
 growth augmented by Internet of Things (“IoT”) demand. Stationary storage (Energy
 Storage Systems, “ESS”) is a smaller market by comparison but should also grow
 rapidly from a low base.

 Cantor Fitzgerald Europe Research 3
Alternative Energy & Resource Efficiency | The positives and negatives of electricity storage

 Annual Battery Demand by Sector

 1400

 1200

 1000

 GWh/year
 800

 600

 400

 200

 0
 2011 2013 2015 2017 2019 2021 2023 2025 2027 2029

 EV E-Bus ESS CE

 Source: BNEF

 Despite the strong expected uptake of lithium ion technology, it suffers from a number
 of limitations. Many of these such as material constraints and lifetime limitations
 directly reflect back to cost. Others such as infrastructure considerations and usage
 complexity impact usability.

 The energy stored (effectively the duration of storage) is reflected in energy density.
 While this has improved dramatically, it remains a limiting factor, and results in the
 cost of storing more than a few hours of charge becoming uneconomic and in many
 cases simply impractical. In the transport space this is reflected in limited range.

 Energy Density of Transportation Fuels and Batteries

 10,000

 9,000

 8,000

 7,000

 6,000
 Wh/kg

 5,000

 4,000

 3,000

 2,000

 1,000

 0
 Gasoline Ethanol NCA LCO LFP Lead acid

 Source: Qnovo

 Other performance limitations such as battery life impact cost. Lack of changing
 infrastructure for EVs, charging time constraints and thermal considerations all have
 solutions. Ironically infrastructure solutions are likely to lead to even greater demand
 for storage with stationary storage being a key tool in managing the additional
 pressures placed on grids as a result of EV growth. Application complexity is
 overcome with control solutions and we see this as a key area of differentiation within
 the sector.

4 Cantor Fitzgerald Europe Research
The positives and negatives of electricity storage Alternative Energy & Resource
Efficiency |

 Cost reductions will have to be fought for and are likely to be slower than many
 expect. There are three reasons for this:

 • Raw material constraints
 • Existing low producer margins
 • Electrochemistry limitations

 These are major limitations but do not prevent lithium ion as emerging as a major
 storage solution. In fact we see it dominating storage for short and medium duration
 storage.

 However we also see the limitations creating opportunities for other rival solutions
 especially at longer storage durations and at very short durations. Notably we see fuel
 cells, flow batteries and supercapacitors as benefiting from strong demand.

 We see a renewed and stronger role for solutions based on hydrogen chemistries
 including fuel cells. The success of the recent Bloom Energy IPO suggests we are not
 alone in seeing the value here. But we also note this year’s KPMG survey of
 automotive executives which placed fuel cell EVs ahead of battery EVs.

 “Fuel Cell Vehicles Will be the Real Breakthrough in Electric Mobility”

 Absolutely agree

 Partly agree

 Nuetral

 Partly disagree

 Absolutely disagree

 Source: KPMG Global Automotive Executive Survey 2018

 We also see strong potential in new battery technologies which can overcome some of
 the limitations of lithium ion although these may take time to develop. The leading
 technologies are likely to have most immediate success in consumer electronics and
 IoT applications and this is where we see most interest.

 Supporting our analysis we have developed levelised cost of storage curves which
 show the levelised cost of storage for different technologies for different storage
 durations. This shows four zones where key technologies dominate; very short, short,
 medium and long durations.

 Cantor Fitzgerald Europe Research 5
Alternative Energy & Resource Efficiency | The positives and negatives of electricity storage

Broad Levelised Cost of Storage Groupings

 10,000

 1,000
 US$/MWh

 100

 Very short duration Short duration Medium duration Long duration
 10
 0.0003 0.003 0.03 0.3 1 3 6 12 24 48
 Duration (hours)

 Super capacitors Pumped storage Hydrogen storage old Lithium-ion battery old Lead acid battery Flow battery old OCGT Diesel

Source: CFE Research estimates

 Key storage market segments

 Segment Duration Applications Current solutions

 Very short duration 20ms to 1s Frequency management, IoT Supercapacitors, LTO
 Short duration 1s to 1 hr Frequency response Lead acid, Li - ion
 Medium duration ESS 1hr to 6hrs Renewables arbitrage - Peak shaving Diesel and OCGTs
 Medium duration EV 1hr to 6hrs Urban EV NMC, NCA
 Long duration ESS > 6hrs Renewables arbitrage - load levelling Pumped storage
 Long duration EV > 6hrs Long distance EV None

 Source: CFE Research estimates

 Despite the constraints on cost progress there will be changes in competitive
 positioning and we can map these in terms of our curves to show how we think
 storage markets will develop.

6 Cantor Fitzgerald Europe Research
The positives and negatives of electricity storage Alternative Energy & Resource
Efficiency |

Levelised Cost of Storage Evolution

 10,000

 1,000
 US$/MWh

 Li-ion cost
 reductions

 100 Flow battery cost
 reductions

 Hydrogen storage
 cost reductions

 10
 0.0003 0.003 0.03 0.3 1 3 6 12 24 48
 Duration (hours)

 Pumped storage Hydrogen storage old Hydrogen storage new Lithium-ion battery old Lithium-ion battery new Lead acid battery

 Flow battery old Flow battery new OCGT Diesel Super capacitors

Source: CFE Research estimates

 As a result of this we see the key immediate technologies as being supercapacitors,
 LTO, solid state batteries, NMC, NCA, flow batteries and fuel cells. Further
 opportunities exist in control and development and renewable energy will be given a
 boost by storage as an enabling technology. Finally new storage technologies will be
 able to exploit the limitations of lithium ion in key markets and we see the IoT as a
 notable early area of opportunity here.

 Market development

 Segment Current solutions Competing technology

 Very short duration Supercapacitors, LTO, solid state Supercapacitors, LTO, solid state
 Short duration Lead acid, Lithium ion LTO, NMC
 Medium duration ESS Diesel and OCGTs NMC
 Medium duration EV NMC, NCA NMC, NCA
 Long duration ESS Pumped storage Flow batteries, fuel cells
 Long duration EV NMC, NCA Fuel cells

 Source: CFE Research estimates

 Cantor Fitzgerald Europe Research 7
Alternative Energy & Resource Efficiency | The positives and negatives of electricity storage

 Opportunities for investors
 Lithium ion storage is now seeing widespread adoption and we see this continuing.
 There is a degree of commoditisation already and we think this will continue. However
 we continue to see value in the development of storage project in the right situations.
 But the limitations of lithium ion mean that there are opportunities in complementary
 storage technologies including supercapacitors, flow batteries and in the emerging
 hydrogen economy. Control and implementation providers will also see opportunity in
 our view.

 The widespread adoption of storage will in turn support and encourage more
 renewables and we see relevant companies benefiting here. Finally developers of new
 storage technologies can exploit the limitations of lithium ion and find potentially
 major opportunities as they bring their technologies to market.

 Storage development companies
 The capital needs of storage systems and the skills required to develop projects makes
 the developer roles a valuable one in our view.

 • Leclanché
 • Electro Power Systems
 • SIMEC Atlantis
 • Plutus Powergen

 Complementary technologies
 Technologies other than lithium ion, especially at either end of the duration curve are
 likely to see stronger demand as the limitations of lithium ion become more widely
 known. We see opportunities in supercapacitors, flow batteries and fuel cells as being
 especially interesting at the moment. Newer technologies such as solid state batteries
 are also beginning to gain traction.

 • Leclanché (LTO)
 • AFC Energy
 • CAP-XX
 • Ceres Power
 • RedT
 • Ilika
 • ITM Power

 Control and implementation
 The difficulties in matching storage technologies to complex use needs means that
 control technologies and their implementation are less likely to become commoditised
 over time. The wider area of smart grid and other smart systems, notably micro grids
 is also an area of opportunity for investors.

 • Leclanché
 • Electro Power Systems

 Renewables
 Storage is an enabling technology for renewables and will make their deployment
 more attractive boosting demand in time. We see a number of companies benefiting
 from this.

 • SIMEC Atlantis
 • Windar Photonics

8 Cantor Fitzgerald Europe Research
The positives and negatives of electricity storage Alternative Energy & Resource
Efficiency |

 This time it’s different
 Electricity storage has been around for a long time and has not always been suitable
 for public markets.

 “The storage battery is, in my opinion, a catch-penny, a sensation, a mechanism for
 swindling by stocking companies. The storage battery is one of those peculiar things
 which appeal to the imagination, and no more perfect thing could be desired by stock
 swindlers than that very selfsame thing.”

 Thomas Edison, Interview with the New York Sunday Herald, January 28, 1883.

 However the clearly improving technologies coupled with real demand arising from
 concerns about both climate change and particulate emissions has changed the nature
 of demand for storage in our view. We are moving from a policy driven, normative
 world to a genuine needs based market.

 Cantor Fitzgerald Europe Research 9
Alternative Energy & Resource Efficiency | Why batteries are a hot idea

 Why batteries are a hot idea

 Until quite recently, storing electricity in large quantities sufficient to power a car or
 provide back-up power for the electricity grid has been largely unfeasible in both
 practical and economic terms. Pumped storage has been a possible exception and a
 go to solution for power grids but it is itself an expensive option at up to £1.5m per
 MW of capacity and requiring a significant amount of space. This exemplifies the
 problems faced by most storage solutions, namely cost and energy density, the
 amount of energy that can be stored in a given space. However recent developments,
 notably improvements in lithium ion battery technology, have seen the cost of storage
 fall and energy density rise.

 Price reductions and technology improvements
 The cost of battery technology has fallen dramatically in the past decade.

BNEF Lithium Ion Battery Price Survey Lithium Ion Battery Gravemetrc Energy Density
 1200 300

 1000 250

 800 200
 US$/kWh

 Wh/kg

 600 150

 400 100

 200 50

 0 0
 2009 2010 2011 2012 2013 2014 2015 2016 2017 2018 1990 1995 2000 2005 2010 2015

Source: BNEF Source: Joint Centre for Energy Storage Research

 Battery technology has also improved significantly over this period with new
 technologies being developed to meet market needs and these technologies then
 improved.

Lithium Ion Battery Timeline

Michael Stanley Whittingham proposes Ned Godshall, John Goodenough LCO LMO and LFP NCA NMC
lithium battery for Exxon Research and and Koichi Mizushima demonstrate commercialised by commercialised commercialised commercialised
Engineering 4V LCO cell Sony

1972 1979 1991 1996 1999 2008

Source: CFE Research estimates

10 Cantor Fitzgerald Europe Research
Why batteries are a hot idea Alternative Energy & Resource Efficiency |

 Not all lithium ion is the same
 As lithium ion has been developed over the years, a number of cathode and anode
 materials have been tried resulting in six main chemistries with differing
 characteristics. These are summarised in the table below. Broadly speaking for
 vehicles and stationery storage, NCA and NMC are the dominant chemistries with LTO
 being available as a more expensive but more useful chemistry in certain applications.

Lithium Ion Battery Chemistries Compared

 LCO LMO NMC LFP NCA LTO

Specific energy (Wh/kg) 150–200 100–150 150–220 90–120 200-260 70–80
Specific power (W/kg) 400-2200 300-1600 300 3000-5100
Cycles 500–1000 300–700 1000–2000 1000–2000 500 3,000–7,000
C rate (C) 0.7–1 0.7–1 0.7–1 1 1 1-5
Thremal runaway (°C) 150 250 210 270 150 One of safest

Source: CFE Research estimates

 For EVs and stationery storage, NCA, NMC are the most appropriate given their better
 specific energy and cycle lives. LTO has a key role where power and longevity are
 important considerations. Most of the other chemistries are more suited to consumer
 good applications.

 The drive to reduce exposure to cobalt has led to reformulations of the key NMC
 chemistry. Originally nickel, manganese and cobalt were present in equal amounts
 with cells described as NMC (111). The industry is through different formulations with
 NMC (622) in sight where nickel represents 60% of the total and manganese and cobalt
 with 20% each. The target is NMC 811. However there are issues here. The formulation
 has been found to show increased impedance with cycling leading to a rapid capacity
 fade. For low cycle life cells this may be acceptable and some manufacturers are
 already offering product for consume applications. For large format cells the material
 is not an option at present.

 BNEF expects chemistries to develop as follows.

Share of Chemistry 2017 Share of Chemistry 2030

 LMO LMO

 NCA NCA

 LFP LFP

 NMC (111) NMC (111)

 NMC (433) NMC (433)

 NMC (532) NMC (532)

 NMC (622) NMC (622)

 NMC (811) NMC (811)

Source: BNEF Source: BNEF

 However we think this may be optimistic on NMC 811 for the reasons we have outlined
 above.

 Cantor Fitzgerald Europe Research 11
Alternative Energy & Resource Efficiency | Why batteries are a hot idea

 Economic viability in key use cases
 Batteries are now an economically viable solution as substitutes for other energy
 sources in certain situations. In particular, battery solutions for marine and bus
 transportation and for certain stationery storage applications now make economic
 sense before the consideration of any policy support. The payback periods for
 investments in buses, marine transport and solar (PV) support are all beginning to
 look attractive. Research shows payback periods in these key areas as beginning to
 look viable for subsidy free investment.

Studies of Battery Payback Period

Application Behind the meter PV support Electric Bus Behind the meter PV Offshore support vessel
 support

Payback period (years) 14.0 7.7 7.2 5.0
Study National Renewable Energy Columbia University for New York City Universities of Liege and Norwegian School of
 Laboratory Transit Aalborg Economics
Date Nov-15 May-16 Dec-16 Dec-16

Source: CFE Research estimates

 Additionally growing need for energy supply for internet of things applications (“IoT”)
 has created demand for small scale energy storage.

 IoT uses – need for better batteries
 The very large growth in demand for sensor and control devices fed by IoT
 applications is creating a similarly large demand for power sources for these devices.
 Small devices have traditionally been powered by nickel cadmium, nickel metal
 hydride or even alkaline batteries.

 However these all have a number of limitations including temperature sensitivity and
 memory effects. The biggest limitation of all is poor energy density. As a result lithium
 ion cells are becoming dominant in this area. In certain applications where power
 density is important, supercapacitors are also making inroads and there are a number
 of newer technologies that have applications here including solid state batteries.

 The IoT market continues to grow with Forbes magazine summarising a number of
 recent market forecasts and showing a CAGR to 2020 of between 16% and 31% and
 overall market valuations in 2020 of up to US$8.9Tr.

 IoT CAGR Forecasts to 2020

 PwC

 GrowthEnabler/Markets&Markets

 Dutch ITC

 Gartner

 BCG

 Statista

 Bain

 IDC

 0.00% 5.00% 10.00% 15.00% 20.00% 25.00% 30.00% 35.00%

 Source: Forbes

12 Cantor Fitzgerald Europe Research
Why batteries are a hot idea Alternative Energy & Resource Efficiency |

Demand for storage set to grow
These breakthrough price points drive further demand growth, accelerating down the
cost curve. We have already seen bidding ahead of the curve based on assumed cost
reductions in certain stationery areas such as the UK’s EFR auction. More significantly,
automotive OEMs and governments are planning as though EV demand will grow
significantly. This of course has a propensity to be self-fulfilling.

Policy in particular is advancing to support EVs at a rapid rate. Perhaps the biggest
shift here has been the move in policy priorities from the long term impact of CO2 to
the more immediate impact of particulate emissions notably fine particulates with a
diameter of less than 2.5um (PM2.5). As a result there are various subsidy and other
forms of policy support available around the world. Subsidies of up to 50% of a
vehicle’s costs are available in some countries.

EV Subsidy as % of EV Cost

 60

 50
 % subsidies in EV price

 40

 30

 20

 10

 0
 Netherlands

 Spain

 Italy
 Norway

 France
 Denmark

 Germany
 South Korea

 Sweden
 China

 Portugal
 United States

 United Kingdom

 Japan

 Switzerland
Source: McKinsey & Company

China is now the leading market for EVs and as a result policy here is key.

EV Unit Sales

 China

 USA

 Japan

 Norway

 UK

 France

 Germany

 Netherlands

 Sweden

 Canada

 Belgium

Source: BNEF

Chinese EV policy has developed from tentative support in 2009 to fully-fledged
support in 2016 although there is now an emphasis on reducing the subsidy level with
phase downs in order to follow the cost curve.

Cantor Fitzgerald Europe Research 13
Alternative Energy & Resource Efficiency | Why batteries are a hot idea

China EV Subsidy Development

NEV pilot city Expansion to Expansion to promote Extension of First phase down Extension and Third phase-down with
subsidy program include private hybrid city buses in central subsidy to of central subsidy second phase down stricter qualification and
initiated NEVs non-pilot cities 2013-2015 2014-2015 2016-2020 compliance 2017-2020

2009 2010 2011 2012 2013 2014 2015 2016

Source: International Council on Clean Transportation

 Stricter policy requirements currently being introduced are reducing subsidy from
 short range vehicles and favouring longer range vehicles. Fuel cell vehicles also
 receive support. Additionally there are city level support policies which have been
 strongly instrumental in increasing EV penetration.

 Bloomberg New Energy now forecasts electricity storage capacity to grow at an
 average of 22% annually to 2030, driven principally by EV demand and E bus demand.
 Stationery energy storage systems (“ESS”) shows much lower demand in this forecast.
 However we think ESS demand is understated as the impact of EVs on system power
 demand will increase demand for ESS as a solution to grid constraints caused by
 charging demand.

 Annual Battery Demand by Sector

 1400

 1200

 1000
 GWh/year

 800

 600

 400

 200

 0
 2011 2013 2015 2017 2019 2021 2023 2025 2027 2029

 EV E-Bus ESS CE

 Source: BNEF

 Change drives change
 While EV growth is the biggest source of potential demand, the demand for stationery
 storage may be underestimated. The US Federal Energy Regulatory Commission ruled
 in February that energy storage companies will be eligible to compete against
 traditional power plants in US wholesale markets by the end of 2020 (FERC Order
 841). This has been seen by some as analogous to the US deregulation of the telecoms
 market in the 1970’s. Following the issue of Order 841, the Brattle Group issued
 research suggesting that ESS in the USA could hit 50GW if costs continue to fall.
 Assuming a three hour storage duration in line with the research, this would mean
 150GWh of battery storage for the USA and extrapolating globally would suggest
 total ESS capacity in line with the E-Bus demand shown above.

 Growth for storage set to grow but there are issues
 While this might all sound positive for investors in storage opportunities there are
 major limitations around battery technology. These in turn create risks for investors
 who back the wrong vehicles. In many ways these risks have not changed in many
 years.

14 Cantor Fitzgerald Europe Research
Battery limitations Alternative Energy & Resource Efficiency |

Battery limitations

Batteries are now being seen as the ideal solution to both transport needs and to
solving the intermittency issues of renewable energy. While they certainly have
potential in these areas there are certain issues which mean that they are not
necessarily a cure all in either sector.

 • Performance limitations
 • Raw material scarcity
 • Infrastructure limitations
 • Complexity of use

Performance limitations
Anyone who has owned a mobile phone for more than about two years will be familiar
with one of the performance limitations of batteries, namely a degradation of
performance over time. There are other limitations too famously including heat
management issues which in some cases have been cited as being behind well
publicised failures in products including the Tesla model S, the Boeing Dreamliner and
the Samsung Galaxy Note 7.

Performance limitations can be summarised as follows:

 • Lifecycle
 • Charging times
 • Thermal runaway
 • Power and energy density limitations
 • Cost development

Life
The life of a battery is usually expressed in the number of full charging cycles that a
battery can deliver before there is a noticeable loss of power delivered. A full charging
cycle is from being fully charged to fully discharged and then fully charged again. In
use a battery is unlikely to ever be fully discharged and battery management systems
can control charging so that it can maximise the number of cycles and thus the
batteries life. However lifetime is still an issue.

Cycle Life for Main Li-Ion Chemistries

 8000

 7000

 6000

 5000
 Cycles

 4000

 3000

 2000

 1000

 0
 LCO LMO NMC LFP NCA LTO

 High Low

Source: Battery University

Cantor Fitzgerald Europe Research 15
Alternative Energy & Resource Efficiency | Battery limitations

 Charging time
 The time taken to charge a battery is also problematic. While progress has been made
 here and EV drivers now have the option of superchargers, charging still takes time. In
 the case of an EV it is still quicker to fill up a traditional ICE powered car than to
 charge an EV. Additionally rapid charging can have a significantly negative impact on
 the battery life.

 C Rates for Key Li-Ion Chemistries

 1.6

 1.4

 1.2

 1.0
 Hours

 0.8

 0.6

 0.4

 0.2

 0.0
 LCO LMO NMC LFP NCA LTO

 High Low

 Source: CFE Research estimates

 Charging time is normally expressed as a “C rate” which measures the rate of
 discharge relative to a batteries maximum capacity. A 1C rate means that the
 discharge current will fully discharge the battery in one hour. A 2C rate would see full
 discharge in 30 minutes. In a similar fashion, discharging can be expressed as a D rate
 although often the term C rate is used interchangeably for charging and discharging.

 Life and charging are related.
 Battery life is affected by maximum voltage, temperature and C rate. The first is fixed
 at the design stage and the second is largely a function of the application. However
 the C rate represents a major limitation in that either you can have a long life or you
 can have rapid charging but not both.

 Cycle Life for Different C Rates

 Source: Choi et al. Journal of Power Sources 111 (2002)

16 Cantor Fitzgerald Europe Research
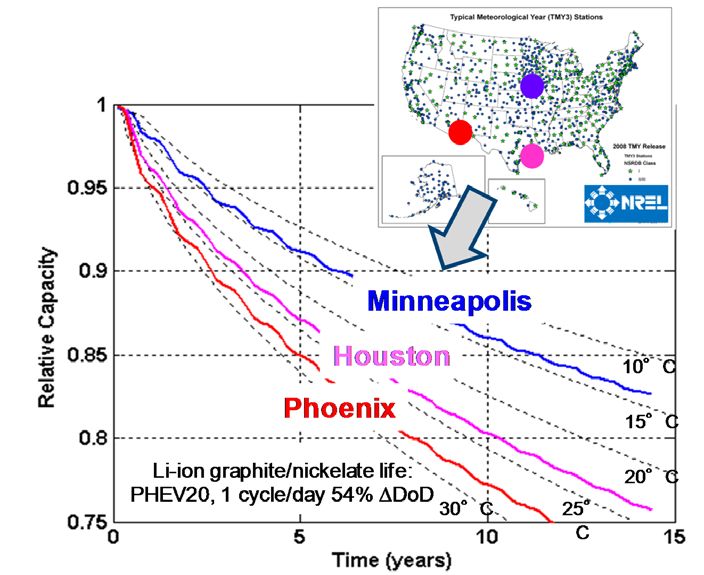
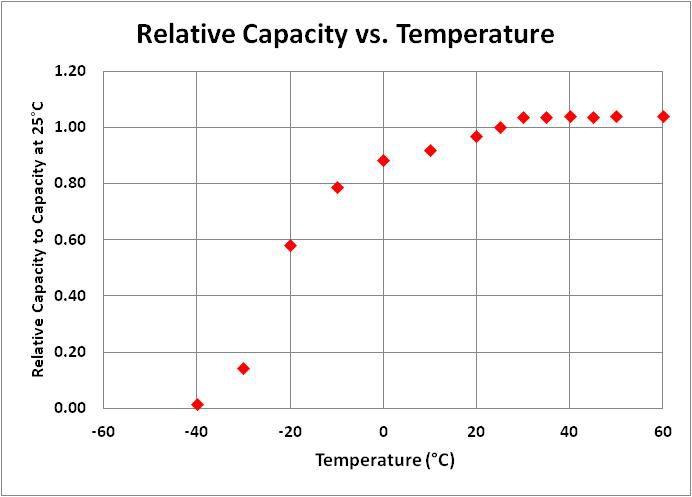
Battery limitations Alternative Energy & Resource Efficiency |

Batteries get hot
Lithium ion in particular has a tendency to overhead leading to thermal runaway. This
can lead to cells exploding if overheating gets out of control. Battery manufacturers
are moving to design in fail safe solutions and in most applications cooling is key.

Thermal Runaway

Source: NREL

Extremes of temperature can also have an impact on battery performance which is
severely limited at low temperatures.

Low Temperature Performance

Source: NREL

High temperatures can also limit battery life quite dramatically. In this case the
performance degradation is not reversible and will lead to a reduction in the overall
life of the battery.

Cantor Fitzgerald Europe Research 17
Alternative Energy & Resource Efficiency | Battery limitations

 High Temperature Performance

 Source: NREL

 As with charging, temperature affects lifetime and in turn this increases the effective
 or levelised cost of storage of the battery.

 Power and energy but seldom both
 Many applications need high power to deliver the required performance. These include
 high power grid needs such as black start as well as the heavy end of the vehicle
 market. Other applications need a large amount of energy which in the case of EVs
 translates into range. Broadly most storage technologies are either good at power or
 at energy but seldom both.

 Ragone Plot

 10000

 1000
 Energy density (Wh/kg)

 Fuel Cells
 Flow-VRD

 100 Li-ion

 10 Pb-acid

 1
 Supercapacitors

 0.1
 10 100 1000 10000
 Power density (W/kg)

 Source: US Defence Logisics Agency, CFE Research estimates

18 Cantor Fitzgerald Europe Research
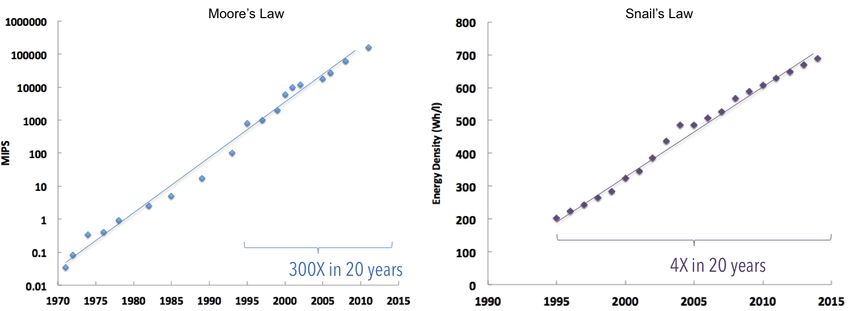
Battery limitations Alternative Energy & Resource Efficiency |

 The amount of energy stored in a battery is limited. This is what limits the range of an
 EV. Improvements are being made all the time but range is still a major deterrent for
 many. Additionally for certain grid applications which require storage for many hours,
 batteries cannot yet provide a suitable solution.

 Energy Density of Transportation Fuels and Batteries

 10,000

 9,000

 8,000

 7,000
 Wh/kg 6,000

 5,000

 4,000

 3,000

 2,000

 1,000

 0
 Gasoline Ethanol NCA LCO LFP Lead acid

 Source: Qnovo

 Costs
 The cost dynamics of a battery mean that while the technology will follow an
 experience curve and see significant cost reductions as volume increases, the
 relationship is unlikely to be as strong as Moore’s Law was for semiconductors. This
 was of course an observation rather than a law and it observed that costs came down
 linearly with annual production. Observations to date of battery costs suggest that
 costs come down with cumulative production which is necessarily a slower rate of
 improvement. It has been termed Snail’s law by one commentator.

Performance Improvements Compared

Source: Qnovo

 Additionally raw material constraints and efficiency limits in balance of plant are acting
 as brakes on the most rapid cost reduction forecasts.

 It is important to remember that Moore’s Law is not a law but merely an observation.
 There is no defined causality. This is a feature typical of learning curves. Abernathy
 and Wayne’s classic paper on learning curves (The Limits of the Learning Curve,

 Cantor Fitzgerald Europe Research 19
Alternative Energy & Resource Efficiency | Battery limitations

 Harvard Business Review, September 1974) which studied the learning curve of the
 model T Ford emphasised that the cost reductions achieved had to be worked for and
 had to come from a deliberate focus on cost above all else, notably flexibility.

 Looking at the facts we see a number of issues that might result in slower than
 expected cost progression.

 • Low margins – limited scope for competition to drive reductions
 • Material constraints – supply chain restrictions in key materials
 • Electro chemistry – gains cannot be considered linear

 Electro chemistry does not usually lend itself to simple solutions. For example Lithium
 ion technology has been struggling with a problem known as voltage fade for a
 number of years now with no sign of solving it. This has limited gains in energy density
 and hence duration. Perhaps the biggest barrier to cost savings is that batteries are
 effectively three dimensional solutions compared with semiconductors or PV cells
 which effectively work in layers. This means a thinner solution will not reduce costs
 without reducing performance and makes a Moore’s law type outcome less likely.

 Overall the performance considerations of batteries limit their usefulness in terms of
 range and charging. Poor usage regimes also impact performance and, as a result,
 cost.

 Raw material scarcity
 A crucial issue with modern battery technology is the use of key materials that could
 see supply constraints as market demand grows. Demand for the key materials
 including lithium, cobalt, nickel, manganese and graphite is set to grow as demand for
 lithium ion batteries grows over the next ten to fifteen years.

 The cell materials used in the main lithium ion battery chemistries are shown below.
 Note that the total cell materials make up 39% of the typical battery pack cost.

 Percentage of Metal Content

 100%
 90%
 80%
 70%
 60%
 50%
 40%
 30%
 20%
 10%
 0%
 NMC (111) NCA LMO LFP LCO

 Li Mn Ni Co Al Fe P

 Source: BNEF

 NMC is the chemistry with most potential for EV applications which is itself the highest
 area of potential demand growth. Much work is being undertaken to reduce the cobalt
 and manganese content of NMC batteries. Most are formulated as NMC 111 which
 means equal parts nickel, manganese and cobalt. More extreme formulations up to
 NMC 811 are being trialled. However this formulation has significant performance
 drawbacks. Notably the cell’s impedance increases with each cycle leading to quite
 rapid capacity fade. While this is less of a problem in certain consumer applications

20 Cantor Fitzgerald Europe Research
Battery limitations Alternative Energy & Resource Efficiency |

with low cycle life, it is still some way away from being a solution for transport or grid
storage. That said intermediate formulations such as NMC 622 are now useable.

Global lithium ion and materials demand forecast from EV sales

 1,000 1400
 900
 1200
 800
 700 1000

 '000 tonnes
 600 800
 500
 400 600
 300 400
 200
 200
 100
 - 0
 2010 2015 2020 2025 2030

 Lithium (tonnes) Cobalt (tonnes)

 Nickel (tonnes) Manganese (tonnes)

 Li-ion battery demand (GWh)

Source: BNEF

For manganese there is not really an issue but both lithium and cobalt, and to an
extent nickel and graphite, could see demand reach almost four times current global
production by 2030. According to the United States Geological Survey (“USGS”) there
are more than sufficient undeveloped reserves in both cases but raising production
will require new investment and any delay here is likely to create constraints on supply
leading to pricing pressure.

EV battery demand impact on selected mineral supply

Material BNEF 2030 forecast BNEF 2030 forecast as a % of BNEF 2030 forecast as a % of
 (metric tonnes) 2014 production known global reserves

Lithium 106,768 296% 0.7%
Cobalt 265,747 237% 3.7%
Nickel 292,909 12% 0.4%
Manganese 254,445 1.4% 0.1%
Copper 862,470 4.7% 0.1%

Source: USGS,BNEF

Both cobalt and lithium markets are already seeing speculative buying as a result, with
lithium almost tripling over the past three years. Cobalt prices have retreated recently
but still remain strongly up.

Cantor Fitzgerald Europe Research 21
Alternative Energy & Resource Efficiency | Battery limitations

 Lithium and Cobalt Pricing (-3y = 100)

 350

 300

 250

 200

 150

 100

 50

 0
 17/08/2015 17/08/2016 17/08/2017

 Cobalt Lithium

 Source: Bloomberg

 Lithium
 Lithium looks likely to face constraints over the next year or so but a significant
 amount of new capacity is set to be developed and producing by 2020.

 Lithium Production Ramp Up

 160000

 140000

 120000

 100000
 tpa

 80000

 60000

 40000

 20000

 0
 2016 2027

 Country Australia Chile Argentina China Zimbabwe

 Brazil Portugal Bolivia Canada Mexico U.S.

 Source: BNEF

 Delays in ramping up these projects could mean market constraints last longer.
 Additionally lithium production is somewhat concentrated with four key developers
 controlling c.80% of the market. This means that even once supply is more balanced,
 prices may remain high.

22 Cantor Fitzgerald Europe Research
Battery limitations Alternative Energy & Resource Efficiency |

Lithium producers market share

 Albermarle

 SQM

 Tianqi

 FMC

 Other China

 Orocobre

 Other

Source: BNEF

Cobalt
Cobalt is already in a technical deficit and despite some new announced capacity
additions a deficit will re-emerge from 2022 onwards. As a result new capacity is likely
to be announced. A high proportion of the world’s cobalt reserves are in the
Democratic Republic of the Congo raising security of supply issues. A reduction in
output would put supply under pressure now.

Cobalt Production by Country

 D.R.C

 Russia

 Australia

 Canada

 Cuba

 Philippines

 Madagascar

 Papua New Guinea

 Zambia

 New Caledonia

 South Africa

Source: BNEF

New cobalt capacity is highly concentrated on a small number of producers. For
example, any problems at Glencore’s Katanga mine would be a major issue for supply.
Glencore has already seen some of its bank accounts in the DRC frozen as part of a
dispute with former business partner Dan Gertler and a JV with the state mining
company Gécamines is also now uncertain following legal action by Gécamines. As all
this is going on the DRC is also introducing a new mining code which will increase
royalty rates from 2% to 10%. Despite this Glencore has recently increased cobalt
output by almost a third. Together with inventory sales in China, this has reduced
some of the recent pressure on prices.

Cantor Fitzgerald Europe Research 23
Alternative Energy & Resource Efficiency | Battery limitations

 New Cobalt Capacity

 Glencore Katanga

 Eurasian Resources Group

 Australian Mines

 Conico

 Terrafame

 eCobalt

 Source: BNEF

 Nickel
 Nickel is primarily used for stainless steel, using two thirds of supply in 2017 compared
 with just 3% for batteries. However BNEF forecast that by 2030 77% of 2016
 production levels will be used for batteries. Oversupply in the market peaked in 2013
 has led to closure of several mines so there is dormant capacity in the market. Nickel
 needs to be processed to high purity for batteries and processing facilities will require
 additional investment as demand grows and there are developments underway.

 Graphite
 There is no immediate pressure on graphite and major new capacity is expected in the
 period 2020 to 2025. As with Cobalt, there is a degree of concentration in new mines
 and delays here could put pressure on supply. Chinese environmental regulations
 could also curtail graphite mining in that country. On the more positive side the
 possibility of producing artificial graphite from needle coke can be utilised but with an
 impact on pricing.

 Summary on material supply
 Overall we expect that material supply will sort itself as new production is brought on
 stream but this will not happen smoothly and prices are likely to remain high.
 Concentration of producers means that even if supply is sufficient prices will not fall
 dramatically. Cobalt is the biggest area of potential supply constraint although delays
 in bringing on new lithium capacity would also have an impact. While new battery
 formulations such as NMC 811 are trying to reduce cobalt content performance
 limitations make these unlikely to be commercially viable in the near term. NMC 622
 and greater use of the older NCA chemistries might have some impact.

 We think material supply will act as a brake on the more rapid cost reduction
 assumptions making a slower cost progression more likely. Opportunities in upstream
 including mining are therefore likely to remain. Supply constraints will also act as an
 additional spur to new technology development making new chemistries beyond
 lithium ion and other storage solutions more viable.

24 Cantor Fitzgerald Europe Research
Battery limitations Alternative Energy & Resource Efficiency |

Infrastructure Limitations
A virtuous cycle of demand growth
There is a growing relationship between EV demand and power needs. There is a
tendency to see demand from power grids for storage as more limited when
compared to potential automotive demand. However the two are at least in part
related.

Lower battery costs makes EV ownership more affordable. As EV ownership grows
the demand on power networks created by charging grows. This puts pressure on the
grid.

A system already under pressure
At the same time, renewable energy is now at a key tipping point. The number of
geographies where solar PV or wind generation has reached the point where it has the
same cost as traditional power generation technologies (known as grid parity) is
growing. The UK has seen offshore wind projects competing at £57/MWh, within 25%
of last year’s baseload electricity price. Two major onshore projects in Germany are
now going ahead based on market prices alone and Vattenfall has announced a
subsidy free offshore wind project.

Global Cumulative Installed Generation Capacity

 18,000 70%
 16,000 60%
 14,000
 50%
 12,000
 10,000 40%
 GW

 8,000 30%
 6,000
 20%
 4,000
 2,000 10%

 - 0%
 2012 2017 2022 2027 2032 2037 2042 2047

 Fossil Nuclear Hydro Wind

 Solar Batteries and flex Other % renewables

Source: BNEF

This new renewable electrical supply is generally mismatched with the additional
demand for EV charging. For example residential charging mainly happens overnight
whereas solar cells only generate during the day. This puts more pressure on the grid,
worsened by the intermittent nature of most renewables.

The Duck Curve
One further impact of increased renewable energy capacity and in particular solar is
the creation of a “Duck Curve” in the daily demand profile. The potential impact of
significant solar capacity on demand was first raised by the California Independent
System Operator (“CAISO”). California used to see energy demand on the grid rise in
the middle of the day and be fairly flat across the afternoon before rising to a peak in
the early evening. Solar is recognised as negative demand because of its distributed
nature. With considerable solar on the Californian system, demand now begins to fall
from 11am as this capacity kicks in. Then in the late afternoon as the sun wanes and
solar starts to come off demand rises very steeply into the early evening peak. This
can be represented on a demand graph showing how demand is expected to behave
as even more planned solar capacity is added out to 2020. The shape is said to
resemble something that quacks.

Cantor Fitzgerald Europe Research 25
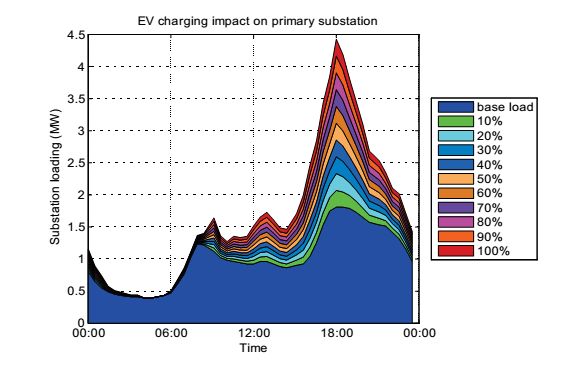
Alternative Energy & Resource Efficiency | Battery limitations

 Duck Curve (UK data)

 35.0

 30.0

 25.0

 20.0

 GW
 15.0

 10.0

 5.0

 0.0

 0:30
 1:00
 1:30
 2:00
 2:30
 3:00
 3:30
 4:00
 4:30
 5:00
 5:30
 6:00
 6:30
 7:00
 7:30
 8:00
 8:30
 9:00
 9:30
 10:00
 10:30
 11:00
 11:30
 12:00
 12:30
 13:00
 13:30
 14:00
 14:30
 15:00
 15:30
 16:00
 16:30
 17:00
 17:30
 18:00
 18:30
 19:00
 19:30
 20:00
 20:30
 21:00
 21:30
 22:00
 22:30
 23:00
 23:30
 0:00
 2015 2020 2025 2030

 2035 2035 - High 2035 - Low

 Source: National Grid

 The key message of the duck curve is that the grid used to have to deal with a small
 ramp up in demand in the later afternoon or early evening but now has to deal with a
 much more marked ramp up. This puts pressure on the system and increases demand
 for flexible and responsive capacity, potentially increasing demand for ESS solutions.

 EVs could make things worse
 Battery electric vehicles (“EVs”) have been seen as a potential source of storage that
 might help to eliminate some of the problem of intermittency. This makes the
 assumption that charging of the EV can occur when the sun is shining and the wind is
 blowing and discharge (driving) can occur at other times. However the propensity to
 charge is greatest when a vehicle returns to the home. This propensity is heightened
 by range anxiety and by a desire to charge efficiently without introducing additional
 charging cycles and potentially shortening battery life.

 Monte Carlo simulations by the University of Strathclyde for the IEEE using time of use
 survey data shows that charging is most likely to occur at times of peak electricity
 demand and thus increase demand. This in turn would exacerbate the duck curve
 effect.

26 Cantor Fitzgerald Europe Research
Battery limitations Alternative Energy & Resource Efficiency |

Scenarios of EV Charging in UK

Source: Strathclyde University/IEEE

The problem could be overcome by changing behaviour so that charging does not
start until later in the evening. Smart charging systems that defer the initiation of
charging until after the evening peak are the obvious solution. Coupled with time of
use (“ToU”) tariffs behaviour might be changed to avoid the inflated demand peak.
However this is not a given as consumer behaviour is uncertain and it would only take
a few well publicised charging failures to create hostility.

Charging devices themselves are already being designed to work with control systems
that will facilitate smart charging making use of customer friendly programming
through mobile phone apps.

In the UK, the government is already considering policy that will make smart charging
mandatory. However it is likely that this will allow manual override.

EV demand impact on grid
The UK National Grid forecasts that EV’s could represent additional demand of up to
29% of current peak demand by 2050. This assumes that all charging is undertaken
when most convenient for the driver which is co-incident with existing peak demand.
However smart charging could defer charging times so that peak impact is minimised
and reduce the peak demand impact to 8GW or 13% of current peak demand.

Cantor Fitzgerald Europe Research 27
Alternative Energy & Resource Efficiency | Battery limitations

 UK Net Peak EV Demand Under Four Scenarios Including V2G

 14

 12

 10

 8

 GW
 6

 4

 2

 0
 2015 2020 2025 2030 2035 2040 2045 2050

 Community Renewables Two Degrees

 Steady Progression Consumer Evolution

 Source: National Grid

 While the National Grid has said it is comfortable that this demand can be met, it is
 still significant and has the potential to put severe pressure on the transmission and
 distribution networks especially at the low voltage network level. Clustering of EV
 charging points in particular could exacerbate the local impacts. Charging may be
 forecastable but is not entirely predictable and this adds to the problem.

 This pressure on the grid can be solved with additional grid capacity but also by smart
 solutions including increased flexible storage and generation.

 V2G
 The pressure placed on networks by EV charging demand could be mitigated by
 vehicle to grid charging (“V2G”) where surplus power stored in a vehicle battery can
 be used by the grid.

 Recent research from the University of Warwick suggests that by managing the
 discharge and charging more efficiently, V2G could actually prolong battery life.
 However other research including work at the University of Hawaii suggests that V2G
 could have a detrimental impact on battery condition and life and even if merely
 suspected this could make it a difficult concept to sell to EV owners.

 Additionally V2G represents an unpredictable source of supply as the behaviour of
 individual vehicle owners cannot be perfectly predicted although adequate forecasting
 is likely to be feasible. The process must also result in a fully charged vehicle when the
 driver wants it. It would only need a few well publicised cases of owners finding their
 vehicles with flat batteries to make such schemes unworkable. For these reasons we
 think V2G cannot be assumed at least until it is developed further. Even National Grid
 is cautious on the number of EV owners who will participate in V2G.

 Percent of EV Owners Who Participate in V2G

 Scenario 2030 2050

 Community Renewables 2% 13%
 Two Degrees 2% 14%
 Steady Progression 2% 10%
 Consumer Evolution 2% 11%

 Source: National Grid

28 Cantor Fitzgerald Europe Research
Battery limitations Alternative Energy & Resource Efficiency |

Overall infrastructure is a challenge. The recent KPMG survey of automotive industry
executives highlighted the issue.

"Battery Electric Vehicles Will Fail Due to Infrastructure Challenges"

 Absolutely agree

 Partly agree

 Neutral

 Partly disagree

 Absolutely disagree

Source: KPMG

More storage
Grids must therefore solve this pressure. That is likely to see them adopt more storage
and so battery demand grows further leading to more cost reductions. This in turn
allows more renewables and the process is driven further forward.

A Virtuous Circle in Energy Storage

 Battery costs
 down and
 performance
 up

 More battery EV demand
 volume rises

 Flexibility Charging
 demand rises demand rises

 Pressure on
 electricity grid

Source: CFE Research estimates

In many developed countries including the UK, electricity demand itself has been
falling as a result of efficiency gains and de-industrialisation. The energy transition and
particularly the rise of EV’s is likely to reverse this decline and lead to quite substantial
increases in demand for electricity.

Cantor Fitzgerald Europe Research 29
Alternative Energy & Resource Efficiency | Battery limitations

 National Grid Peak Demand Forecasts Under Differing Scenarios

 90.0
 85.0
 80.0
 75.0

 GW
 70.0
 65.0
 60.0
 55.0
 50.0
 2005 2010 2015 2020 2025 2030 2035 2040 2045 2050

 History Community Renewables Two Degrees

 Steady Progression Consumer Evolution

 Source: National Grid

 Market complexity
 Stationery power storage needs can appear straightforward at first sight. We can
 summarise these into three main groups based on storage duration across a typical
 day. A simplified picture of power demand across a 24 hour period is shown below,
 illustrating the need to convert a typical grid daily power supply profile to a baseload
 demand need. The profile supplied varies across the day with small variations from
 second to second and larger variations across the day.

 Simplified Daily Demand Profile

 0 1 2 3 4 5 6 7 8 9 10 11 12 13 14 15 16 17 18 19 20 21 22 23

 Source: CFE Research estimates

 Storage can flatten this demand profile entirely but to do so there are three principal
 applications.

30 Cantor Fitzgerald Europe Research
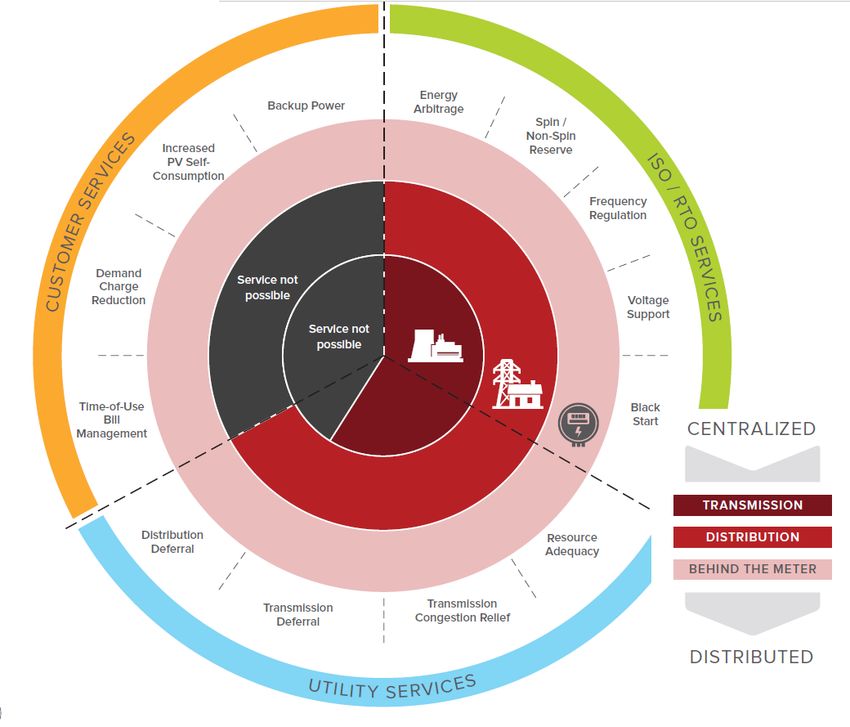
Battery limitations Alternative Energy & Resource Efficiency |

How Different Types of Storage Smooth Power Demand

 Short term
 storage -
 frequency
 response

 Medium term
 storage - peak
 shaving

 Longer term
 storage - load
 levelling

Source: CFE Research estimates

Here the short term market needs storage solutions of up to 30 minutes and the more
responsive the better. Peak shaving needs storage of between an hour and six hours
and load levelling needs at least 6 hours of storage.

However this simplification masks a great deal of complexity. The Rocky Mountain
Institute identifies 13 use cases for stationary storage applications alone.

Power Storage Use Cases

Source: Rocky Mountain Institute

Cantor Fitzgerald Europe Research 31
Alternative Energy & Resource Efficiency | Battery limitations

 In the UK, the National Grid has embarked on an attempt to rationalise over X different
 flexibility needs in the stationery/power market.

 UK Balancing Services Markets

 Source: National Grid

 The transport market is in some ways more straightforward although is not without its
 challenges with differing needs for different transport types and distances. Overall we
 think the underlying complexity of use cases leads to potential marketing challenges
 and funding challenges.

 While we expect these will simplify over time into a smaller number of key markets
 (National Grid’s rationalisation initiatives will help) a degree of complexity will remain
 making some markets challenging and rewarding participants who can deal with this
 complexity adequately. Strong proprietary control offerings are key here. It is
 interesting in this regard that Engie’s acquisition of a 50% stake in Electro Power
 Systems cites the “differentiating control technology” at EPS in its acquisition
 statement. In fact the major recent M&A deals in the storage space recently have been
 dominated by acquisitions of companies with a strong control angle, notably Younicos
 and Greensmith.

 Significant Energy Storage Acquisitions

 Date Acquiror Target EV ($ million) EV / revenue EV / EBITDA

 Mar-18 Engie Electro Power Systems € 37 5.9 -20.8
 Jul-17 Wartsila Greensmith 170 na na
 Jul-17 Aggreko Younicos £40 5.71 na
 Jul-16 Total Saft € 1,003 1.31 9.0
 Jun-15 Energizer Energizer (Spin-off) $2,834 1.57 7.2
 Nov-14 Berkshire Hathaway Duracell $2,898 na 7
 Oct-14 OM Group Ener-Tek $24 1 8
 Jun-13 Eurazeo Croissance IES Synergy € 22 1.57 na
 Oct-12 Johnson Matthey Axeon £41 0.87 na
 Oct-08 Ener1 Enertech $57 0.93 7.9
 Median 1.3 7.9

 Source: CFE Research estimates

 Controls
 Matching storage technologies to demand physically requires complex controls
 systems. Integrating hybrid storage and power increases this complexity dramatically.

32 Cantor Fitzgerald Europe Research
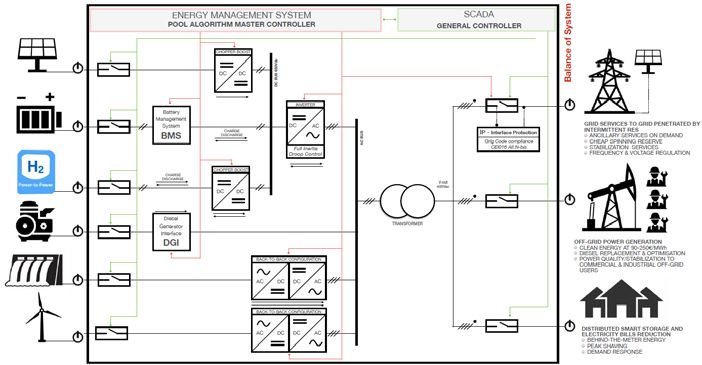
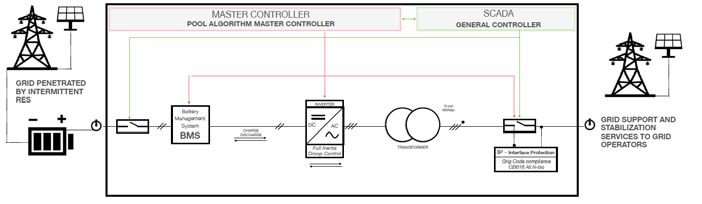
Battery limitations Alternative Energy & Resource Efficiency |

This is a less commoditised part of the market than the provision of physical storage
equipment alone and is seeing growing demand.

Most storage systems will be connected to a grid via power electronics components.
Normally an inverter modulates the waveforms of current and voltage to match with
the grid. The inverter itself is managed by a controller that defines the set points of
the storage system, normally in terms of the magnitude of active and reactive power.

Control of the battery or other storage devices is undertaken by a Battery
Management System (“BMS”) which monitors and controls the charge and discharge
process. This maximises the lifetime of the cells and ensures safe operation.

For a complex system a master control module will co-ordinate charging and
discharging of slave control modules. For a hybrid power plant, control becomes even
more complex. Between different power or storage sources, a further convertor
known as a boost convertor or chopper boost is required to levelise voltages. More
than one of these may be required in a full hybrid system. Complexity can increase as
more assets are added.

Finally a SCADA (supervisory control and data acquisition) system interfaces with the
end users including the local grid if appropriate. This may include interface protection
for the grid.

A straightforward battery based system would look like the diagramme below.

Energy Storage System Control Schematic

Source: Electro Power Systems

A number of key players can go far beyond this basic offering and provide the control
systems and balance of plant to create a full hybrid power plant with a variety of
storage, traditional generation and renewable generation sources and the ability to
serve off-grid, grid connected and distributed demand. We expect to see more
offerings in this space but the existing players have a strong advantage and given
demand are likely to maintain an advantage.

Cantor Fitzgerald Europe Research 33
You can also read