THE COST OF AIR POLLUTION - HEALTH IMPACTS OF ROAD TRANSPORT
←
→
Page content transcription
If your browser does not render page correctly, please read the page content below
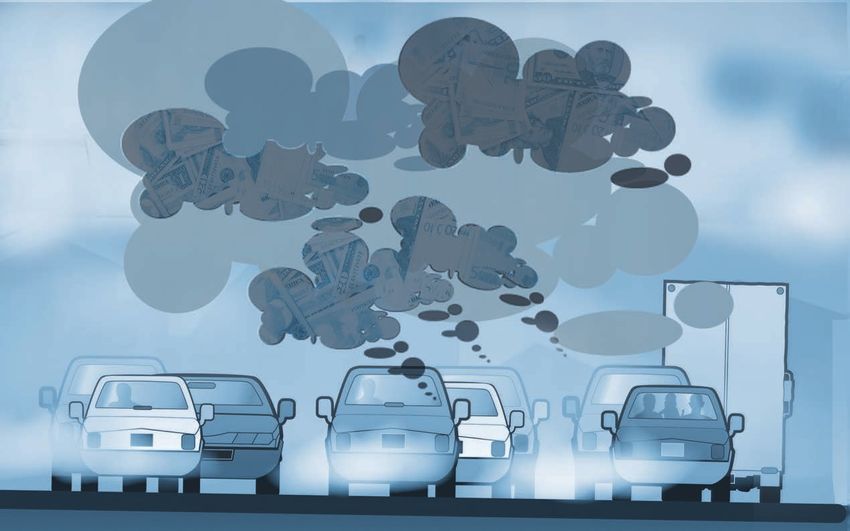
The Cost of Air Pollution
Health Impacts of Road Transport
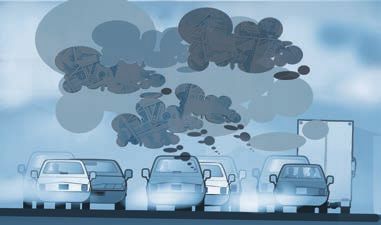
The Cost of Air Pollution
  HEALTH IMPACTS OF ROAD TRANSPORT
This work is published on the responsibility of the Secretary-General of the OECD.
The opinions expressed and arguments employed herein do not necessarily reflect
the official views of the OECD or of the governments of its member countries.

This document and any map included herein are without prejudice to the status of
or sovereignty over any territory, to the delimitation of international frontiers and
boundaries and to the name of any territory, city or area.

  Please cite this publication as:
  OECD (2014), The Cost of Air Pollution: Health Impacts of Road Transport, OECD Publishing.
  http://dx.doi.org/10.1787/9789264210448-en

ISBN 978-92-64-21042-4 (print)
ISBN 978-92-64-21044-8 (PDF)

The statistical data for Israel are supplied by and under the responsibility of the relevant
Israeli authorities. The use of such data by the OECD is without prejudice to the status of the
Golan Heights, East Jerusalem and Israeli settlements in the West Bank under the terms of
international law.

Photo credits: Cover © Paul Maguire - Fotolia.com, © Graphies.thèque - Fotolia.com, © Ihnatovich
Maryia/Shutterstock.com.

Corrigenda to OECD publications may be found on line at: www.oecd.org/about/publishing/corrigenda.htm.
© OECD 2014

You can copy, download or print OECD content for your own use, and you can include excerpts from OECD
publications, databases and multimedia products in your own documents, presentations, blogs, websites and
teaching materials, provided that suitable acknowledgment of the source and copyright owner is given. All
requests for public or commercial use and translation rights should be submitted to rights@oecd.org. Requests
for permission to photocopy portions of this material for public or commercial use shall be addressed directly
to the Copyright Clearance Center (CCC) at info@copyright.com or the Centre français d'exploitation du droit de
copie (CFC) at contact@cfcopies.com.
FOREWORD

                                               Foreword
       L   ocal air pollution, and the health problems it causes, have received increased
       attention in many parts of the world, often because of specific incidents in major cities.
       However, over the last few years, the evidence-base has improved significantly, and
       now demonstrates that the health impacts of local air pollution, particularly from road
       transport, are much larger than previously thought. Drawing on this improved
       evidence-base this study estimates the economic cost of the health impacts of air
       pollution from road transport – on a global scale, but with special reference to People’s
       Republic of China, India and the OECD member countries.
            After the preparation of this book was finished, the World Health Organization
       published new information showing that 3.7 million people died globally because of
       outdoor air pollution in 2012; a further increase from the 3.4 million mortalities in
       2010 that this book is based on.
            The book was prepared by Dr Rana Roy, who in turn wishes to acknowledge the
       able research assistance provided by Mr Stuart Baird. Jenny Calder of the OECD
       Secretariat contributed to the preparation of the final manuscript, and Nils Axel
       Braathen of the OECD Secretariat oversaw the implementation of the project.

THE COST OF AIR POLLUTION: HEALTH IMPACTS OF ROAD TRANSPORT © OECD 2014
                                                                                                    3
TABLE OF CONTENTS
Table of contents
List of abbreviations . . . . . . . . . . . . . . . . . . . . . . . . . . . . . . . . . . . . . . . . . . . . . 9
Executive summary . . . . . . . . . . . . . . . . . . . . . . . . . . . . . . . . . . . . . . . . . . . . . . 11
Chapter 1. Defining the economic cost of health impacts . . . . . . . . . . . . . . 15
1.1. Mortality: The value of statistical life . . . . . . . . . . . . . . . . . . . . . . . . 17
1.2. Morbidity: In search of a standard method . . . . . . . . . . . . . . . . . . . 19
1.3. The dominance of mortality costs over morbidity costs . . . . . . . . 23
Notes . . . . . . . . . . . . . . . . . . . . . . . . . . . . . . . . . . . . . . . . . . . . . . . . . . . . . . 26
References . . . . . . . . . . . . . . . . . . . . . . . . . . . . . . . . . . . . . . . . . . . . . . . . . . 27
Chapter 2. Reviewing the evidence on and calculating the cost
of the health impacts of air pollution . . . . . . . . . . . . . . . . . . . . . . . . . . 29
2.1. Improved reporting versus real changes in impacts and costs . . 30
2.2. Air pollution from road transport . . . . . . . . . . . . . . . . . . . . . . . . . . . 37
2.3. Health impacts of air pollution . . . . . . . . . . . . . . . . . . . . . . . . . . . . . 42
2.4. Economic cost of the health impacts of air pollution . . . . . . . . . . 53
2.5. Road transport’s share of the above economic cost . . . . . . . . . . . . 62
Notes . . . . . . . . . . . . . . . . . . . . . . . . . . . . . . . . . . . . . . . . . . . . . . . . . . . . . . 65
References . . . . . . . . . . . . . . . . . . . . . . . . . . . . . . . . . . . . . . . . . . . . . . . . . . 67
Chapter 3. Rethinking appraisals to mitigate the health impacts
of air pollution from road transport . . . . . . . . . . . . . . . . . . . . . . . . . . . . 73
References . . . . . . . . . . . . . . . . . . . . . . . . . . . . . . . . . . . . . . . . . . . . . . . . . . 78
Tables
1.1. CAFÉ Programme cost-benefit analysis (CBA),
with and without WTP values . . . . . . . . . . . . . . . . . . . . . . . . . . . . . . . 24
1.2. TSAP cost-benefit analysis (CBA), with mortality in VOLYs and VSLs 25
2.1. Selected risk factors ranked by attributable burden of disease
in 1990 and 2010 . . . . . . . . . . . . . . . . . . . . . . . . . . . . . . . . . . . . . . . . . . 33
2.2. Selected risk factors ranked by attributable burden of disease
in selected regions in 2010 . . . . . . . . . . . . . . . . . . . . . . . . . . . . . . . . . . 34
2.3. Deaths, YLLs and DALYs from ambient air pollution in 2005
and 2010 . . . . . . . . . . . . . . . . . . . . . . . . . . . . . . . . . . . . . . . . . . . . . . . . . 44
2.4. Deaths from ambient air pollution in OECD countries . . . . . . . . . . 46
THE COST OF AIR POLLUTION: HEALTH IMPACTS OF ROAD TRANSPORT © OECD 2014
5TABLE OF CONTENTS
2.5. Years of life lost (YLL) from ambient air pollution
in OECD countries in 2005 and 2010 . . . . . . . . . . . . . . . . . . . . . . . . . . 47
2.6. Disability-adjusted life years lost (DALYs) from ambient
air pollution in OECD countries in 2005 and 2010. . . . . . . . . . . . . . . 48
2.7. Deaths from ambient air pollution in China in 2005 and 2010 . . . . 49
2.8. YLLs from ambient air pollution in China in 2005 and 2010 . . . . . . 49
2.9. DALYs from ambient air pollution in China in 2005 and 2010 . . . . 50
2.10. Deaths from ambient air pollution in India in 2005 and 2010 . . . . 50
2.11. YLLs from ambient air pollution in India in 2005 and 2010. . . . . . . 51
2.12. DALYs from ambient air pollution in India in 2005 and 2010 . . . . . 51
2.13. Economic cost of deaths from ambient air pollution
in OECD countries in 2005 and 2010 . . . . . . . . . . . . . . . . . . . . . . . . . . 58
2.14. Indicative estimate of the economic cost of health impacts
from ambient air pollution including morbidities
in OECD countries in 2005 and 2010 . . . . . . . . . . . . . . . . . . . . . . . . . . 59
2.15. Economic cost of deaths from ambient air pollution in China
in 2005 and 2010 . . . . . . . . . . . . . . . . . . . . . . . . . . . . . . . . . . . . . . . . . . 60
2.16. Indicative estimate of the economic cost of health impacts
from ambient air pollution including morbidities in China
in 2005 and 2010 . . . . . . . . . . . . . . . . . . . . . . . . . . . . . . . . . . . . . . . . . . 60
2.17. Economic cost of deaths from ambient air pollution in India
in 2005 and 2010 . . . . . . . . . . . . . . . . . . . . . . . . . . . . . . . . . . . . . . . . . . 61
2.18. Indicative estimate of the economic cost of health impacts
from ambient air pollution including morbidities in India
in 2005 and 2010 . . . . . . . . . . . . . . . . . . . . . . . . . . . . . . . . . . . . . . . . . . 62
2.19. Indicative estimate of road transport’s share of the economic
cost of deaths from ambient air pollution in EU24 in 2010 . . . . . . . 64
2.20. Indicative estimate of road transport’s share of the economic
cost of health impacts from ambient air pollution including
morbidities in EU24 in 2010 . . . . . . . . . . . . . . . . . . . . . . . . . . . . . . . . . 64
2.21. Indicative estimate of road transport’s share of the economic cost
of deaths from ambient air pollution in OECD countries in 2010. . 64
2.22. Indicative estimate of road transport’s share of the economic
cost of health impacts from ambient air pollution including
morbidities in OECD countries in 2010. . . . . . . . . . . . . . . . . . . . . . . . 65
3.1. TSAP CBA; costs, benefits and B/C ratios . . . . . . . . . . . . . . . . . . . . . . 75
3.2. Car, bus and rail revenues in relation to marginal social costs
in Great Britain. . . . . . . . . . . . . . . . . . . . . . . . . . . . . . . . . . . . . . . . . . . . 77
Figures
2.1. Estimates of deaths from ambient particulate matter (PM) pollution 32
2.2. The economic cost of the health impacts of air pollution
from road transport: Three links in the chain . . . . . . . . . . . . . . . . . 35
6 THE COST OF AIR POLLUTION: HEALTH IMPACTS OF ROAD TRANSPORT © OECD 2014TABLE OF CONTENTS
2.3. The economic cost of the health impacts of air pollution
from road transport: Three bases of evidence . . . . . . . . . . . . . . . . . 35
2.4. Deaths from ambient air pollution . . . . . . . . . . . . . . . . . . . . . . . . . . . 44
2.5. Deaths from ambient air pollution in OECD countries, China
and India, per million capita, in 2005 and 2010 . . . . . . . . . . . . . . . . 52
3.1. TSAP CBA; costs and benefits. . . . . . . . . . . . . . . . . . . . . . . . . . . . . . . . 75
Follow OECD Publications on:
http://twitter.com/OECD_Pubs
http://www.facebook.com/OECDPublications
http://www.linkedin.com/groups/OECD-Publications-4645871
http://www.youtube.com/oecdilibrary
OECD
Alerts http://www.oecd.org/oecddirect/
This book has... StatLinks2
A service that delivers Excel® files from the printed page!
Look for the StatLinks2at the bottom of the tables or graphs in this book.
To download the matching Excel® spreadsheet, just type the link into your
Internet browser, starting with the http://dx.doi.org prefix, or click on the link from
the e-book edition.
THE COST OF AIR POLLUTION: HEALTH IMPACTS OF ROAD TRANSPORT © OECD 2014
7The Cost of Air Pollution
Health Impacts of Road Transport
© OECD 2014
List of abbreviations
AQG Air Quality Guidelines
B/C Benefit-cost ratio
CAFÉ Clean Air for Europe Programme
CBA Cost-benefit analysis
COI Cost-of-illness
CPI Consumer price index
CSE Centre for Science and Environment
DALY Disability-adjusted life years lost
DfT UK Department for Transport
DKK Danish krona
EEA European Environment Agency
ESCAPE European Study of Cohorts for Air Pollution Effects
EU European Union
EUR Euro
EVs Electric vehicles
GBD Global Burden of Disease
GDP Gross domestic product
HEAT Health economic assessment tool
HEI Health Effects Institute
IARC International Agency for Research on Cancer
IIASA International Institute for Applied Systems Analysis
LYL Life years lost
MIT Massachusetts Institute of Technology
MTFR Maximum technical feasible reduction
NOx Nitrogen oxides
NPV Net present value
PM Particulate matter
PPP Purchasing power parity
PVb Present value of benefits
PVc Present value of costs
QALY Quality-adjusted life years lost
TSAP Thematic Strategy on Air Pollution
UK United Kingdom
USD United States dollar
9LIST OF ABBREVIATIONS
US EPA United States Environmental Protection Agency
VOLY Value of a life year lost
VSL Value of a statistical life
VSLY Value of a statistical life year
WHO World Health Organization
WTP Willingness to pay
YLL Years of life lost
10 THE COST OF AIR POLLUTION: HEALTH IMPACTS OF ROAD TRANSPORT © OECD 2014The Cost of Air Pollution
Health Impacts of Road Transport
© OECD 2014
Executive summary
O utdoor air pollution kills more than three million people across the world
every year, and causes health problems from asthma to heart disease for
many more. This is costing OECD societies plus People’s Republic of China and
India an estimated USD 3.5 trillion dollars a year in terms of the value of lives
lost and ill health, and the trend is rising. But how much of the cost of those
deaths and health problems is due to pollution from cars, trucks and
motorcycles on our roads? Initial evidence suggests that in OECD countries,
road transport is likely responsible for about half the USD 1.7 trillion total.
Air pollution in OECD countries has fallen in recent years, helped by tighter
emission controls on vehicles, but has increased in China and India as rapid
growth in traffic has outpaced the adoption of tighter emission limits. The
switch to more polluting diesel vehicles in many countries in part to combat
climate change has also added to pollution effects, threatening to arrest the
downward trend in emissions from road transport in OECD countries.
Over the five-year period from 2005 to 2010, there was an overall increase of
about 4% in the number of premature deaths globally caused by outdoor air
pollution – with an improvement in the OECD world being offset by a larger
deterioration in the rest of the world.
These figures, based on new technologies for measuring pollution and
improved analysis of health data, are far higher than those from previous
studies of premature death and illness from air pollution. Calculating the
economic cost of these health impacts, and how much is due to air pollution
from road transport, requires estimating the value of lost lives or lost quality
of life in the case of illness. There is a standard method for calculating the cost
of lost life, but not for loss of health. Hence this study adds to the mortality
cost a 10% margin for loss of health (morbidity), based on the best available
evidence in recent studies.
It is now possible to give a better calculation of the health impacts of air
pollution and of the associated economic cost. Available evidence and
methodology suggest that about 50% of that cost in OECD countries is
specifically attributable to road transport, although more work needs to be
done to provide a robust calculation for the road transport share.
11EXECUTIVE SUMMARY
Main findings
● The number of deaths due to outdoor air pollution fell by about 4% in OECD
countries between 2005 and 2010, while the number of years of life lost fell
even further. But while 20 of the 34 OECD countries achieved progress,
14 did not.
● The number of deaths due to outdoor air pollution in China rose by about
5%, although years of life lost increased by only about 0.5%. China has
arguably succeeded in slowing the increase in the effect of air pollution on
health, since a reduction in exposure to pollution will have a greater effect
on years of life lost than on the number of deaths.
● India registered an increase of about 12% in the number of deaths and about
3% in years of life lost. Although the number of deaths in India is only just
over half the number in China, the trend in India is increasing faster.
● The cost of the health impact of outdoor air pollution in OECD countries,
both deaths and illness, was about USD 1.7 trillion in 2010. Available
evidence suggests that road transport accounts for about 50% of this cost, or
close to USD 1 trillion.
● The best available estimate of the economic cost of the health impacts of
outdoor air pollution in China and India combined is larger than the OECD
total – about USD 1.4 trillion in China and about USD 0.5 trillion in India in
2010. There is insufficient evidence to estimate the share of road transport
in these figures but even if it is less than half, it nonetheless represents a
large burden.
Main recommendations
● A defensible calculation of the economic cost of health impacts must be based
on economic first principles. This means continuing the use of the standard
method for calculating the cost of mortality – the Value of Statistical Life
(VSL) as derived from individuals’ valuation of their willingness to pay to
reduce the risk of dying.
● Indicative estimates suggest that morbidity would add 10% to the mortality
cost figures, but work is needed to complete a standard method of
calculating morbidity costs in a manner consistent with the standard
method for calculating mortality costs.
● A defensible calculation of the economic cost of the health impacts of air
pollution must base itself on the new body of epidemiological evidence made
possible by recent innovations in monitoring and modelling technology.
12 THE COST OF AIR POLLUTION: HEALTH IMPACTS OF ROAD TRANSPORT © OECD 2014EXECUTIVE SUMMARY
● A defensible calculation of the economic cost of the health impacts of air
pollution from road transport must base itself on sector-specific evidence
consistent with the new body of epidemiological evidence. This
necessitates a renewal of the sector-specific evidence base. In the
meanwhile, it is possible to provide indicative estimates only of road
transport’s share in the overall cost.
● Governments should maintain strong regulatory regimes, particularly strict
vehicle standards. Given the size of the economic cost of the health effects
of air pollution, the benefits of reducing that burden could easily outweigh
the monetary cost of investments in more ambitious programmes to reduce
pollution.
● Governments should also rethink their approach to appraising policy
moves, such as the regulatory and tax settings that facilitated the shift to
diesel vehicles. Importantly, there is also a need to ask how it is that the
appraisal process has hitherto failed to secure the passage of a range of
policy proposals for example in relation to public transport that could have
reduced air pollution – and how to rectify this in future.
THE COST OF AIR POLLUTION: HEALTH IMPACTS OF ROAD TRANSPORT © OECD 2014
13The Cost of Air Pollution
Health Impacts of Road Transport
© OECD 2014
Chapter 1
Defining the economic cost of health impacts
This chapter begins with a restatement of the economic first
principles informing the “valuation” of life and health and, therewith,
the “cost” of mortalities and morbidities. It shows that a standard
method is available by which to measure the cost of mortality – the
“value of statistical life” (VSL). While there is work to be done in
order to establish standard measurement methods regarding
morbidity, it is possible to proceed with an indicative estimate of
the additional cost imposed by morbidities drawn from the best
available evidence.
151. DEFINING THE ECONOMIC COST OF HEALTH IMPACTS
T his study reports on the economic cost of the health impacts of air
pollution from road transport – on a global scale but with special reference to
People’s Republic of China (hereafter “China”), India and the OECD world.
Any report on the “economic cost” of impacts on human health, be it
from air pollution or any other source, involving as it does a “valuation” of life
and of health, needs to explain as clearly as possible what precisely is meant
by the terms “value” and “cost”. This is a non-trivial task. For the use of these
terms is frequently misunderstood.
The world is not yet free of the illusion that the wealth of the world
subsists in gold (or some other form of money): the “chrysohedonistic
illusion”. Even though an explicit rejection of this view characterises the
founding works of economic science in the mid-eighteenth century following
through to today,1 long after gold has given way to paper money, it is all too
frequently supposed that what economists really mean by “value”, or by
“cost”, is a given sum of money.
It is therefore as well to begin by stating that this is not so: money is not
the thing being measured but the instrument with which we measure it. Of
course, money plays several roles wherever it is present; and rival schools of
economic thought hold rival views on the roles that it plays. In the context of
the present analysis, however, and irrespective of these otherwise rival views,
all economists can agree that money serves here merely as a common unit of
account, an imperfect instrument with which to measure certain non-
monetary phenomena: namely, the several various items that all of us as
individuals “value” in the ordinary sense of the word.2
So, what is it that we as individuals value and that economists as
observers seek to measure? They include:
● consumption – and, with it, the sacrifice of some items of consumption in
order to secure others, including the sacrifice of current consumption in the
act of investment in order to secure greater future consumption
● leisure – and the sacrifice of some leisure in the act of labour in order to
secure consumption
● health – and the sacrifice of some part of consumption in order to secure
health
● life – and the sacrifice of some part of consumption in order to preserve it.
16 THE COST OF AIR POLLUTION: HEALTH IMPACTS OF ROAD TRANSPORT © OECD 20141. DEFINING THE ECONOMIC COST OF HEALTH IMPACTS
“Value” as used here – also called “utility” – is simply a measure of these
items that we all value in the ordinary sense of the word; and “cost” is a
measure of their loss, absolutely or as a means of securing other valuable
items. The task of the economist then becomes one of aggregating at a social
level these millions of individual valuations at their marginal rates of
substitution.
1.1. Mortality: The value of statistical life
In the case of the ultimate impact on health – mortality – economics
today possesses a singular, and singularly elegant, standard method by which to
measure the cost of this impact from a given source: that is to say, to measure
the loss of the valued item – life – at the level of society as a whole. This is the
“value of statistical life” (VSL), as derived from aggregating individuals’
willingness to pay (WTP) to secure a marginal reduction in the risk of
premature death.
OECD (2012) describes the basic process of deriving a VSL value from a
WTP survey:
The survey finds an average WTP of USD 30 for a reduction in the annual
risk of dying from air pollution from 3 in 100 000 to 2 in 100 000. This
means that each individual is willing to pay USD 30 to have this 1 in
100 000 reduction in risk. In this example, for every 100 000 people, one
death would be prevented with this risk reduction. Summing the
individual WTP values of USD 30 over 100 000 people gives the VSL value
– USD 3 million in this case. It is important to emphasise that the VSL is
not the value of an identified person’s life, but rather an aggregation of
individual values for small changes in risk of death (OECD, 2012).
As such, the economic cost of the impact being studied becomes the VSL
value multiplied by the number of premature deaths; the economic benefit of
a mitigating action becomes the same VSL value multiplied by the number of
lives saved.
In addition, following an extensive research effort led by the OECD (OECD,
2012; Biausque, 2010; Braathen, 2012; Hunt and Ferguson, 2010; Hunt, 2011),
including a rigorous meta-analysis of VSL studies (OECD, 2012), starting with
1 095 values from 92 published studies, both researchers and policy makers
now possess a set of OECD-recommended values for average adult VSL. In
units of 2005 USD, the recommended range for OECD countries is
USD 1.5 million – 4.5 million, the recommended base value is USD 3 million.
The remit of this study is to apply these VSL values to the problem at
hand: the problem of the health impacts of air pollution from road transport.
There is, however, a need to pause to add a few words on the meaning and
purpose of the standard method. For this in turn sets sharp limits to what can
THE COST OF AIR POLLUTION: HEALTH IMPACTS OF ROAD TRANSPORT © OECD 2014
171. DEFINING THE ECONOMIC COST OF HEALTH IMPACTS
and cannot be done in this report. In particular, it shows up the folly, not to say
absurdity, of attempting to combine the standard method with alternative
methods of calculating the “costs” of mortality that have an entirely different
meaning and purpose.
The reasoning informing the standard method is simple enough and may
be simplified even further for the purpose of presentation as follows
(Biausque, 2010; OECD, 2012). Suppose that each individual has an expected
utility function, EU, relating the utility of consumption over a given period,
U(y), and the risk of dying in that period, r, of the form:
EU(y, r) = (1 – r) U(y).
The individual’s WTP, to maintain the same expected utility in the event
of a reduction in the level of risk from r to r’ is the solution to the equation:
EU(y – WTP, r’) = EU(y, r).
VSL is the marginal rate of substitution between these two valued items,
consumption and the reduction in the risk of dying, such that:
VSL = WTP/r.
For the present, the two main points to note are these. First, the value
that the standard method seeks to capture is the value (in this case, the value
of the reduction in the risk of dying) to the individual; it is not, for example, the
value of postponed revenue to the undertaker or the value of higher pension
expenditure by the government. And second, the task of the economist is one
of aggregating valuations by individuals at their marginal rates of substitution;
it is not one of imposing valuations from above.
It is worth recalling here the words of Jacques Drèze, the originator of the
standard method, in reflecting on its origins in an interview more than forty
years later:
In 1960, two French engineers were wondering how much should be
spent on investments enhancing road safety. So they tried to define the
economic value of a life saved. They suggested measuring that economic
value by the future income of a potential victim … and stumbled on the
question: should the value of future consumption be subtracted, in order
to appraise society’s net loss? I realised at once that this very question
pointed to the basic flaw of the approach: people want to survive and
consume, not starve! Going back to the root of the problem, I introduced
what is known today as the “willingness to pay” approach to valuing lives
in safety analysis. How much would an individual be willing to pay in
order to reduce his probability of accidental death? That is for the
individual to decide, given his resources … [and] the subjective
importance he attaches to survival… Road safety being a public good,
individual willingness to pay should then be aggregated as in the
18 THE COST OF AIR POLLUTION: HEALTH IMPACTS OF ROAD TRANSPORT © OECD 20141. DEFINING THE ECONOMIC COST OF HEALTH IMPACTS
Lindahl-Samuelson theory of public goods (Dehes, Drèze, and
Licandro, 2005).
It follows that alternative methods of calculating the “cost” of mortality
which seek neither to capture the value to the individual nor to register and
aggregate the valuations by individuals cannot substitute for the standard
method; nor can they be simply combined with the standard method to
produce composite estimates.
This is not to deny that these alternative methods can offer interesting
policy-relevant information. But that information needs to be treated
separately from the information yielded by the standard method. To do
otherwise is almost a category error.
For example, an incidence of pollution that results in the premature
deaths of working-age people has an impact on the national accounts through
the loss of output and wages; those responsible for studying and forecasting
gross domestic product (GDP) changes have an interest in measuring this
impact. Clearly, however, a calculation that stops counting at retirement age
and places a zero value on the death of a person of 65 years is not counting the
same thing as the standard method. It should not occasion surprise that this
national-accounts’ measure of the “cost” of mortality frequently produces
very different estimates to those produced by the standard method.3
Similarly, the attempt to derive “WTP values” and “VSL values” from
“revealed preference” rather than “stated preference” – for example, by
reference to wage levels in dangerous jobs – can reveal interesting information
on the degree of bargaining power, or the lack thereof, possessed by particular
segments of the workforce.4 What they do not reveal is what is registered by
the standard method: the valuation by individuals of their WTP to reduce the
risk of death.
As shown below, these issues of compatibility also have a bearing on the
valuation of morbidity. But so far as concerns the valuation of mortality, the
conclusion drawn here is simple. The standard method, safely grounded as it
is in the first principles of economic science, will suffice for the task at hand;
the rest can be set aside.
1.2. Morbidity: In search of a standard method
Economics today does not possess a singular, let alone singularly elegant,
standard method by which to measure the cost of morbidity from a given
source: that is, to measure the loss of the valued item, health. Nor do
researchers and policy makers possess anything like a set of OECD-
recommended values for the several and various morbidities that can arise
from a given source.5
THE COST OF AIR POLLUTION: HEALTH IMPACTS OF ROAD TRANSPORT © OECD 2014
191. DEFINING THE ECONOMIC COST OF HEALTH IMPACTS
In part, this lack reflects the current state of research and its limitations.
As noted below, there are two lines of research in this field. There is a
reasonably well-established tradition of developing a plural rather than
singular method of calculating the various costs of morbidities – but this has
not yet arrived at a clear consensus on exactly what needs to be calculated or
the values at which they are to be calculated. There is also a more recent line
of research which seeks to arrive at a composite cost estimate – but this is
nowhere near a state of maturity sufficient to generate either a consensus on
method or a set of agreed values across the OECD world.
This lack also reflects a material difference in the subject matter of the
two fields. There is a material difference between the “cost of mortality” and
the “costs of morbidity” – or rather, several material differences. For the latter
item is, in reality, plural in several respects.
Whereas mortality is, in the nature of things, a singular and well-defined
endpoint, morbidities entail a plurality of endpoints – indeed, a very large range
of endpoints, varying greatly in the extent of severity, and complicating
enormously the task of eliciting and aggregating individual WTP values.
In addition, whereas the cost of mortality is, in an immediate and
unconditional sense, borne by the individual who dies, a case of morbidity can
entail the imposition of costs on a plurality of agents – to begin with, the
individual who is suffering ill-health and the many who are involved in the
organisation and execution of formal and informal care of the one who is ill.
Finally, the individual who is suffering ill-health suffers a plural loss of utility:
not only the “pain and suffering” imposed by the illness but also the loss of some
part of consumption (and leisure) in expending income (and time) in “averting”
and “mitigating” activities in response to current and prospective morbidities.
Therefore, and insofar as morbidity imposes a loss in utility on a plurality
of agents as well as a plural loss of utility on the one who is ill – and without
departing in the least from the distinction between economic calculation and
other forms of calculation, such as national accounting that is so critical to a
correct understanding of VSLs – it is entirely legitimate to calculate the costs
of morbidity in a plural manner: as the sum of separate elements of cost.
In a more or less recent paper for the OECD, Hunt and Ferguson (2010) set
out the elements of this sum:
The economic costs of the health impacts of air pollution can then be
given by the sum of three different categories:
1. Resource costs: Represented by the direct medical and non-medical
costs associated with treatment for the adverse health impact of air
pollution plus avertive expenditures. That is, all the expenses the
individual faces with visiting a doctor, ambulance, buying medicines
20 THE COST OF AIR POLLUTION: HEALTH IMPACTS OF ROAD TRANSPORT © OECD 20141. DEFINING THE ECONOMIC COST OF HEALTH IMPACTS
and other treatments, plus any related non-medical cost, such as the
cost of childcare and housekeeping due to the impossibility of the
affected person in doing so;
2. Opportunity costs: Associated with the indirect costs related to loss of
productivity and/or leisure time due to the health impact;
3. Disutility costs: Refer to the pain, suffering, discomfort and anxiety
linked to the illness.
It should be noted that the “loss of productivity” referenced above, and
regardless of exactly how it is estimated, should be read here as the loss of
income and hence consumption for the affected person and the affected
person’s household – as distinct from the loss of valued-added in the
employer’s accounts or in the national accounts. In this manner, each of these
elements as well as their sum can be defined in conformity with the economic
first principles set out in this chapter.
Unfortunately, this line of research has not yet had time to establish itself
as a standard method, with a high degree of agreement on the definition of the
elements to be calculated and the values at which they are to be calculated.
There are several issues that need to be resolved, including but not restricted
to the following (Hunt and Ferguson, 2010; and Hunt, 2011):
● the definition of distinct endpoints – without which WTP values make little
sense since the disutility of the pain and suffering involved in “illness” can
range from trivially low to very high;
● the need for consistency between methods for estimating the different cost
elements;
● the obvious need to avoid double-counting;
● but also, and just as importantly, the need to be comprehensive – in
particular, the need to include WTP values for disutility, rather than restrict
the definition of costs to “resource costs” and “opportunity costs” alone,
and to include both lost income and lost leisure in opportunity costs rather
than restrict the definition of opportunity costs to lost income alone.
Nonetheless, this is a line of research that is safely grounded in economic
first principles and should in the fullness of time be able to deliver the goods:
that is, a standard method to calculate the costs of morbidity.
What is more unfortunate is that the search for a standard method has
taken a turn in quite another direction, one which might never arrive at a
destination that is capable of winning general agreement. This is the attempt
to arrive pari pasu at a composite cost estimate of morbidity and mortality.
The reasoning informing this approach is as follows. The epidemiological
literature can and does estimate mortality not only in terms of the number of
premature deaths but also in terms of the years of life lost (YLLs) or life years
THE COST OF AIR POLLUTION: HEALTH IMPACTS OF ROAD TRANSPORT © OECD 2014
211. DEFINING THE ECONOMIC COST OF HEALTH IMPACTS
lost (LYLs): that is, adjusting for the age profile and also the pre-existing
condition of those impacted by mortality. The same literature can, and
sometimes does, estimate morbidity not only in terms of its multiple
endpoints but also in terms of “quality-adjusted life years lost” (QALYs) – or,
alternatively described, “disability-adjusted life years lost” (DALYs). Given this,
if economists could arrive at a “value of a life year lost” (VOLYs) (sometimes
described as “value of a statistical life year” – VSLY), they could derive values
for QALYs as a co-efficient of VOLYs – and therefore determine a measure of
the “economic cost” of morbidity as a co-efficient of the “economic cost” of
mortality. Once this task is achieved, policy makers could be relieved of the
burden of applying VSLs derived from WTP surveys as a measure of the
economic cost of mortality.
Now if this approach were well-founded, then the recent meta-analysis of
VSLs and related research effort by the OECD to establish recommended
values – not to mention more than 50 years of progress in economic science
since the pioneering work of Jacques Drèze – could well become redundant.
There is, however, good reason to suppose that it is not well-founded.
First, as a matter of record, it should be noted – as indeed is noted in an
important early paper for the US Environmental Protection Agency (US EPA)
(Hubbell, 2002) – that the original interest of policy makers in the use of QALYs
was as “an alternative method that can account for morbidity effects as well
as losses in life expectancy, without requiring the assignment of dollar values to
calculate total benefits”. And as the US EPA Science Advisory Board advised at
the time: whilst there was merit in using QALYs and therefore VOLYs in
certain contexts and for certain purposes, “alternative measures, such as the
VSLY or the value of a QALY, are not consistent with the standard theory of
individual WTP for mortality risk reduction” (Hunt and Ferguson, 2010; and
Hunt, 2011).
Of the many ways in which the new approach can violate the letter and
spirit of the standard theory, the following deserve special mention:
● Non-monetised QALYs, however useful they are to health professionals,
reflect their valuations of the morbidity suffered by others – not valuations
by representative individuals in the general population – and this will
necessarily flow through into their monetisation.
● VOLYs are rarely derived from WTP surveys even today (Hunt, 2011) – even
if it is in principle possible to do so – and therefore also reflect the
valuations of external parties.
● However they are derived, VOLYs will necessarily produce results that differ
from, and are inconsistent with, the results given by VSLs: the cost of the
death of a group of people of a given age will automatically be counted as
less than the death of a comparable group of younger people with otherwise
22 THE COST OF AIR POLLUTION: HEALTH IMPACTS OF ROAD TRANSPORT © OECD 20141. DEFINING THE ECONOMIC COST OF HEALTH IMPACTS
identical characteristics since the number of LYL for the former group will
be less than that for the latter.
● Whether monetised or not, QALYs can involve an element of “double
jeopardy” (Hubbel, 2002) as described in Hubbel (2006): “If the QALY loss is
determined based on the underlying chronic condition and life expectancy
without regards to the fact that the person would never have been in that
state without long term exposure to elevated air pollution, then the person
is placed in double-jeopardy. In other words, air pollution has placed more
people in the susceptible pool, but then we penalize those people in
evaluating policies by treating their subsequent deaths from acute exposure
as less valuable, adding insult to injury, and potentially downplaying the
importance of life expectancy losses due to air pollution.”
● The combination of counting LYL, rather than lives lost, and carrying
through pre-existing conditions means that the VOLY-QALY approach
“explicitly places a lower value on reductions in mortality risk accruing to
older populations with lower quality of life” (Hubbel, 2002).
Now it would be dogmatic to conclude that the search for a composite
method will necessarily fail to resolve these issues in a manner that is
compatible with economic first principles. It is clear, however, that this search
has not arrived at such a destination and cannot today offer a set of values
that are in any way compatible with the OECD-recommended values for VSLs
that this report is tasked to apply.
Against this background – the availability of a singular standard method
for calculating mortality costs, a well-founded search for a plural method for
calculating morbidity costs which is not yet complete, an also-incomplete
search for a singular method which may be fatally flawed – the approach
adopted in this report is to concentrate on the task at hand. As such, the study
reports on both mortality and morbidity impacts of air pollution but calculates
costs for mortality only, and using only the OECD-recommended values for
VSLs – and then adds to this only a provisional indicative estimate of the
additional cost imposed by morbidity.
It follows that if the OECD and its member-governments wish to calculate
the economic costs of air pollution’s impact on morbidity on a par with the
calculation of the economic costs of air pollution’s impact on mortality offered
below, it is necessary to build an economically robust evidence-base on
morbidity on a par with the economically robust evidence-base on mortality
established in OECD (2012).
1.3. The dominance of mortality costs over morbidity costs
As is indicated below and in the discussion in Chapter 2, the costs of
morbidity are large. As a result, it would indeed be advisable to capture more
THE COST OF AIR POLLUTION: HEALTH IMPACTS OF ROAD TRANSPORT © OECD 2014
231. DEFINING THE ECONOMIC COST OF HEALTH IMPACTS
precisely these costs and their constituent parts in order to develop more
effective interventions to reduce them. But mortality costs are, and
necessarily so, much larger. In any defensible calculation of “economic costs”
properly defined, mortality dominates over morbidity as a share of the total
economic cost of health impacts from air pollution.
The most recent OECD report to address this point sums it up as such:
“overall health costs are dominated by the cost of premature mortality; the
order of magnitude changes vary significantly between morbidity and
mortality.” (Hunt, 2011 and the discussion following Table 2.1.)
This finding has been established for a long time. Inter alia, Hunt (2011)
cites a 1996 report estimating morbidity costs at 15-45% of total costs, with
mortality costs accounting for 55-85%. More recent research, with more
accurate values, tends to attribute a much higher share to mortality costs.
Hunt (2011) cites the 2010 study by the US EPA of the benefits of the 1990 Clean
Air Act Amendments, attributing 93% of the benefits to reductions in
mortality (Hunt, 2011, Table 2.6).
This last point, the progressive attribution of a larger share of the total to
mortality, is best shown by concentrating on a single programme and its
progress. From Hunt and Ferguson (2010), we can extract the following data on
an early iteration of the Clean Air for Europe (CAFÉ) Programme, showing the
effects of adding in, first, non-mortality WTP values and, next, mortality WTP
values.
Table 1.1. CAFÉ Programme cost-benefit analysis (CBA),
with and without WTP values
Benefits in reduced damage costs EUR billions, 2005 As a % of programme cost
Medical cost 0.38
Lost production cost 3.06
Crop losses 0.33
Materials 0.19
Total 3.96 56
Adding in non-mortality WTP
Non-mortality WTP 10.40
New total 14.36 202
Adding in mortality WTP
Mortality WTP 29.09
Grand total 43.45 612
Source: Data reported in Hunt, A. and J. Ferguson (2010), A review of recent policy-relevant findings form the
environmental health literature, OECD, Paris.
24 THE COST OF AIR POLLUTION: HEALTH IMPACTS OF ROAD TRANSPORT © OECD 20141. DEFINING THE ECONOMIC COST OF HEALTH IMPACTS
If valued by the individual’s WTP, the benefits in reduced mortality
account for 67% of the grand total. And WTP values account for 72% of the
remainder. In short, mortality costs dominate morbidity costs; and the values
for (dis)utility dominate the values for resource costs and opportunity costs.
The most recent CBA for the Thematic Strategy on Air Pollution (TSAP)
(Holland, 2012), which builds upon the CAFÉ Programme, estimates the
baseline damage costs as follows:
Table 1.2. TSAP cost-benefit analysis (CBA), with mortality
in VOLYs and VSLs
Baseline health impacts from air pollution in year 2030 (%)
All mortality – LYL – in median VOLY – as a % of the total (with median VOLY) 69
All mortality – LYL – in mean VOLY – as a % of the total (with mean VOLY) 84
All mortality – number of deaths – in median VSL – as a % of total (with median VSL) 83
All mortality – number of deaths – in mean VSL – as a % of total (with mean VSL) 91
Source: Data extracted from Holland (2012), Cost-benefit Analysis of Scenarios for Cost-Effective Emission
Controls after 2020, Version 1.02, November 2012, corresponding to International Institute for Applied
Systems Analysis (IIAC) Thematic Strategy on Air Pollution Report #7, EMRC.
On the basis of the OECD-recommended approach in OECD (2012) –
calculating with mean VSLs – mortality costs claim a 91% share of total costs in
this European research, close to the 93% share of total benefits reported for
reductions in mortality in the US EPA study. In addition, the VSL values used
in Holland (2012) pre-date the higher VSL values recommended in OECD
(2012); applying the latter would yield a result above 91%.
Hence, the most recent evidence suggests that morbidity costs add to the
total by around 10% of the cost of mortality as given by mean VSLs. And this is the
estimate carried over as a provisional indicative estimate in the calculations of
Chapter 2.
The further development of the plural method of calculating morbidity
costs, including a more comprehensive calculation of WTP values, may well
raise morbidity’s share. But it is not credible to suppose that it would raise that
share above that of mortality.
If despite this weight of evidence in the specialist literature, non-
specialists are sometimes inclined to suppose that morbidity costs, and
especially medical costs, are the dominant share of the economic costs of
health impacts, it is only because of critical ambiguities in the use of the term
“costs”.
For example, a consultants’ report for the US EPA from the turn of the
century, reporting on “asthma costs” for 1997 (Chestnut, Mills and Agras,
2000), shows “direct costs” (medical expenditures in the treatment of illness)
THE COST OF AIR POLLUTION: HEALTH IMPACTS OF ROAD TRANSPORT © OECD 2014
251. DEFINING THE ECONOMIC COST OF HEALTH IMPACTS
to be greater than “indirect costs”, and “morbidity costs” to be greater than
“mortality costs”. But this is only because “indirect costs” are defined here as
being “the market value of lost productivity (e.g., wages)”. The authors
themselves clearly warn that this is not the appropriate measure.6 But to no
avail: even today, that paper is sometimes used to question this critical
scientific finding of the dominance of mortality costs.
And yet: how could economic science find otherwise? In the language of
economics, cost is not a sum of money; cost is the loss of what we value. We
value consumption, leisure, health and life. Jacques Drèze says: “People want
to survive and consume, not starve!” To this should be added: “People want to
live, in health if possible, in sickness if need be. In sickness and in health,
people want to live!”
It is only from the contrary perspective of an ancient chrysohedonism,
predating not only the 50 years’ of progress in valuation since the early work
of Jacques Drèze, but also the 250 years’ of progress in the understanding of
value since Francois Quesnay and Adam Smith – only from this perspective of
“counting the King’s money” – that medical expenditures can loom larger than
life. Economic science provides a very different calculation.
Notes
1. To keep it manageable, the referencing in this report is restricted to items
published in the twenty-first century. But the veracity of this claim – that is, the
universal rejection of chrysohedonism by all major schools of economics from the
mid-eighteenth century to the present day – can be checked easily enough by
consulting inter alia the works of Francois Quesnay, Adam Smith, David Ricardo,
Karl Marx, Leon Walras and Kenneth Arrow.
2. This is also described as “use value” as distinct from “exchange value” in the
language of the classical economists and as “utility” in neo-classical and present-
day economics.
3. To repeat: this is not to say that the impact on GDP is not interesting or that it
should be left unreported. But it needs to be reported separately; and so do the
reasons for that separation. There is a parallel here with the issue of GDP impacts
of public investment projects. In recent years, in the case of certain high-profile
projects, the UK Department of Transport has reported results in terms of both
economic evaluation and national accounts: that is, both cost-benefit results and
GDP impacts. But it has taken care to present these calculations separately and to
explain the reasons for it. See for example UK Department for Transport (UK DfT)
(2006).
4. See for example the recent paper by Qin, Li and Lui (2013) on how workers’ lack of
bargaining power in certain sectors, including especially agriculture, can distort
the results.
5. On the current state of research on the costs of morbidity, see in particular Hunt
and Ferguson (2010) and Hunt (2011).
26 THE COST OF AIR POLLUTION: HEALTH IMPACTS OF ROAD TRANSPORT © OECD 20141. DEFINING THE ECONOMIC COST OF HEALTH IMPACTS
6. See Hunt (2011), where the authors warn as follows: “It should be noted that COI [cost-
of-illness] estimates are a useful measure of financial burden of disease, but they do
not measure the monetary value of the full effect of disease on the welfare of the
population and are therefore insufficient for a full cost-benefit analysis of public
policies aimed at reducing morbidity or mortality. Willingness to pay (WTP) is the
more appropriate measure of the change in welfare in cost-benefit analysis, because
it reflects not just the financial effect but also the value people place on the effect on
quality of life and longevity…. In addition, there is substantial evidence that WTP for
reductions in mortality risk far exceed the expected value of lost earnings, which is
the COI measure of the financial effect of premature mortality…”
References
Biausque, V. (2010), The Value of Statistical Life: A Meta-Analysis, OECD, Paris, http://
s e a rch . o e c d . o rg / o f f i c i a l d o c u m e n t s / d i s p l ay d o c u m e n t p d f / ? c o t e = E N V / E P O C /
WPNEP(2010)9/FINAL&doclanguage=en.
Braathen, N.A. (2012), “Valuation of human lives”, Presentation at an Informal Joint
Workshop of the Regulatory Policy Committee and the Annual Meeting of
Sustainable Development Experts on The Role of Impact Assessments in Policy
Making, OECD, Paris.
Chestnut, L. G., D.M. Mills and J. Agras (2000), National Costs of Asthma for 1997,
prepared for US Environmental Protection Agency, Washington, DC, http://
yosemite.epa.gov/ochp/ochpweb.nsf/content/asthmacost.htm.
Dehes, P., J. Drèze and O. Licandro (2005), “From uncertainty to macroeconomics and
back: An interview with Jacques Drèze”, Macroeconomic Dynamics, 9, pp. 429-461.
See also CORE Reprints 1770, Centre for Operations Research and Econometrics,
Louvain-la-Neuve, www.uclouvain.be/core.
DfT (Department for Transport) (2006), Transport, Wider Economic Benefits and Impacts on
GDP, Department for Transport, Department for Transport, London, www.dft.gov.uk.
Holland, M. (2012), Cost-benefit Analysis of Scenarios for Cost-Effective Emission Controls
after 2020, Version 1.02, November 2012, Corresponding to IIASA Thematic
Strategy on Air Pollution Report #7, EMRC, http://ec.europa.eu/environment/air/pdf/
review/TSAP_CBA_corresponding_to_IIASA7_v1-02[1].pdf.
Hubbel, B.J. (2002), Implementing QALYs in the Analysis of Air Pollution Regulations, US
Environmental Protection Agency, Washington, DC, www.epa.gov/ttnecas1/
workingpapers/ereqaly.pdf.
Hunt, A. (2011), “Policy Interventions to Address Health Impacts Associated with Air
Pollution, Unsafe Water Supply and Sanitation, and Hazardous Chemicals”, OECD
Environment Working Papers, No. 35, OECD Publishing, Paris, http://dx.doi.org/
10.1787/5kg9qx8dsx43-en.
Hunt, A. and J. Ferguson (2010), A review of recent policy-relevant findings form the
environmental health literature, OECD, Paris, http://search.oecd.org/officialdocuments/
displaydocumentpdf/?doclanguage=en&cote=env/epoc/wpnep(2009)9/final.
OECD (2012), Mortality Risk Valuation in Environment, Health and Transport Policies, OECD
Publishing, Paris, http://dx.doi.org/10.1787/9789264130807-en.
Qin, X., L. Li and Y. Lui (2013), “The value of life and its regional difference in China”,
China Agricultural Economic Review, Vol. 5, pp. 373-390, http://papers.ssrn.com/sol3/
papers.cfm?abstract_id=2298617.
THE COST OF AIR POLLUTION: HEALTH IMPACTS OF ROAD TRANSPORT © OECD 2014
27The Cost of Air Pollution
Health Impacts of Road Transport
© OECD 2014
Chapter 2
Reviewing the evidence on and calculating
the cost of the health impacts of air pollution
This chapter reviews the extensive new epidemiological evidence
that has become available since the WHO’s 2010 Global Burden of
Disease study. It tabulates health impacts from ambient
particulate matter and ambient ozone pollution – including deaths,
years of life lost (YLLs), and disability adjusted life years lost
(DALYs) – for all OECD countries plus China and India. This
chapter also provides a new calculation of the economic cost of
deaths from ambient air pollution for all OECD countries plus
China and India, along with an additional indicative estimate for
the cost of morbidities.
The statistical data for Israel are supplied by and under the responsibility of the relevant
Israeli authorities. The use of such data by the OECD is without prejudice to the status
of the Golan Heights, East Jerusalem and Israeli settlements in the West Bank under the
terms of international law.
292. REVIEWING THE EVIDENCE ON AND CALCULATING THE COST OF THE HEALTH IMPACTS...
2.1. Improved reporting versus real changes in impacts and costs
The evidence reviewed in this chapter is, wherever possible, on a global
scale. But parts of the discussion, and more especially the calculations, are
conducted with special reference to People’s Republic of China (hereafter
“China”), India and the 34 member countries of the OECD. In an immediate sense,
this restriction is the result of constraints in data availability. But the restriction is
not eccentric: each of these three population blocks constitutes just under one-
fifth of the world’s population and together they make up its majority.
On a global scale as well as in the case of each major country or group of
countries, the best available evidence today suggests that the health impacts
of outdoor air pollution, including from road transport, are considerably greater
than previously reported.
This is primarily a consequence of the improved reporting of the health
impacts of air pollution, through the use of more advanced monitoring
technology – in particular, the use of remote-sensing satellite technology in
place of ground monitoring stations (Brauer et al., 2012; Evans et al., 2012;
Amann, Klimont and Wagner, 2013) – and through the development of a more
comprehensive and rigorous methodology for assembling and analysing the
epidemiological data, as embodied in the Global Burden of Disease (GBD) 2010
study, and published in a series of papers in The Lancet in December 2012 and
in a number of follow-up papers thereafter (Box 2.1).1
The net result is that a far larger number of premature deaths – that is, a
far larger share of the given number of premature deaths2 – is now classified by
epidemiologists as being attributable to “ambient particulate matter (PM)
pollution”.3
GBD 2010 reports a global death toll from PM pollution for the year 2010
that is four times greater than the figure reported for the year 2000 in the World
Health Organization’s GBD study for 2000 (Figure 2.1). It is also more than two
times greater than the figure reported for the year 2010 itself in the OECD
Environmental Outlook to 2050 (OECD, 2012a).
These 3.2 million deaths represent a significant toll; and, at 6% of the
global total of premature deaths, a significant share of the GBD.
The toll on life and limb can also be expressed in terms of years of life lost
(YLL) due to premature mortality and disability-adjusted life years (DALYs) –
that is, the sum of years lost due to premature deaths and years lived in
30 THE COST OF AIR POLLUTION: HEALTH IMPACTS OF ROAD TRANSPORT © OECD 20142. REVIEWING THE EVIDENCE ON AND CALCULATING THE COST OF THE HEALTH IMPACTS...
Box 2.1. The new epidemiological evidence-base on air pollution
This study draws on an epidemiological evidence-base on air pollution that
is markedly different to that used in most previous studies. The new
evidence-base – and in particular the tabulations of deaths, years of life lost
(YLLs) and disability-adjusted life-years lost (DALYs) produced in the Global
Burden of Disease Study 2000 study and reproduced here – incorporates
several critical scientific breakthroughs, of which the two most relevant are
these:
It makes use of a more advanced monitoring technology for measuring
emissions and ambient concentrations of pollutants technology – in
particular, the use of remote-sensing satellite technology in place of ground-
based monitoring stations.
● For a further discussion of the matter, see Amann, Klimont and Wagner
(2013), “Regional and Global Emissions of Air Pollutants: Recent Trends and
Future Scenarios”, Annual Review of Environment and Resources, Vol. 38, http://
environ.annualreviews.org; Brauer et al. (2012), “Exposure Assessment of the
Global Burden of Disease Attributable to Outdoor Air Pollution”,
Environmental Science and Technology, Vol. 46, http://dx.doi.org/10.1021/
es2025752; and Evans et al. (2012), “Estimates of global mortality
attributable to particulate air pollution using satellite imagery”,
E n v i r o n m e n t a l R e s e a r c h , Vo l . 1 2 0 , h t t p : / / d x . d o i . o rg / 1 0 . 1 0 1 6 /
j.envres.2012.08.005.
It employs a more comprehensive and rigorous methodology for
assembling and analysing the epidemiological data. The result is a more
accurate assignment to each disease and each risk factor of its share in the
given number of premature deaths – which in turn happens to entail a higher
share being assigned to ambient air pollution than in most previous studies.
● As is highlighted in Institute for Health Metrics and Evaluation (2013), The
G l o b a l B u rd e n o f D i s e a s e : G e n e ra t i n g E v i d e n c e , G u i d i n g Po l i c y ,
www.healthmetricsandevaluation.org/gbd/publications/policy-report/global-
burden-disease-generating-evidence-guiding-policy: “GBD was created in part
due to researchers’ observation that deaths estimated by different disease-
specific studies added up to more than 100% of total deaths when
summed. The GBD approach ensures that deaths are counted only once.”
And again ibid.: “To ensure that the number of deaths from each cause
does not exceed the total number of deaths estimated in a separate GBD
demographic analysis, researchers apply a correction technique called
CoDCorrect. This technique makes certain that estimates of the number of
deaths from each cause do not add up to more than 100% of deaths in a
given year.”
THE COST OF AIR POLLUTION: HEALTH IMPACTS OF ROAD TRANSPORT © OECD 2014
31You can also read