The Economic Case for the
  Derby-Nottingham Metro
←
→
Page content transcription
If your browser does not render page correctly, please read the page content below
The Economic Case for the Derby-Nottingham Metro
The Economic Case For The Nottingham-Derby Metro                 3

Contents

Chapter                                                   Page

1. Foreword		                                                4

2. Executive Summary                                         6

3. The Derby-Nottingham metro                               12

4. The economic case for working as a metro                 16

5. Business and education providers’ views on the metro     26

6. How the area is operating currently                      28

7. The growth ambition                                      34

8. Priorities for metro collaboration                       38

9. Governance and delivery                                  50

10. Funding the metro                                       54

11. An industrial strategy deal                             57

12. Recommendations                                         60

13. Conclusion                                              62

14. Appendix                                                64
4   The Economic Case For The Nottingham-Derby Metro

1   Foreword

    When Derby and Nottingham City Councils asked Metro Dynamics to explore the economic
    case for the area functioning as a metro economy, I jumped at the opportunity.

    I grew up in Beeston, which as part of Broxtowe District Council, lies on the route between
    Nottingham and Derby. As a teenager in the late 1970s, I was a passionate Nottingham
    Forest fan. The rivalry between Derby and Forest was as real then as it is now. But both
    sets of fans are also only too aware that the two clubs experienced their greatest success
    under the same manager, Brian Clough, whose name has been given to the A52 that runs
    between the two cities.

    The more you look at Derby and Nottingham, the more apparent their underlying economic
    interdependence becomes, but it has often been obscured by competing identities. An old
    friend of mine summed this up very well when he said to me as we walked away from a
    Forest game, “everyone in Nottingham hates Derby, mind you, half my mates work there!”.

    Even as someone who knows the area well, I was surprised by the extent to which the two
    cities are connected economically. 40,000 people commute regularly between the two cities
    and over 400,000 people commute to work within the wider metro area. Three quarters of
    the people who live in the area, also work in the area.

    Moreover, far from being in economic competition, the two cities complement one another.
    Derby specialises in advanced manufacturing and engineering, whereas Nottingham’s economy
    is much more about professional services, biotech, data and digital and creative sectors.

    But whilst the area already has many of the characteristics of an urban metro, it doesn’t
    operate like one, and it loses out as a result. Its collective voice is not as loud as it should
    be. For that reason, it gets less public spending and transport infrastructure investment per
    capita than other similar areas. Despite relatively buoyant economies, and similar levels
    of GVA for the two cities, there are significant levels of inequality, particularly in the north
    of Nottingham and south of Derby. For poor communities in these areas, the economic
    opportunities in advanced manufacturing and the digital economy feel as remote as if they
    were in another country.

    The metro area is also part of a wider East Midlands region which has not so far benefited
    from any new devolution arrangements. Whereas the West Midlands Combined Authority
    can provide coherent and co-ordinated economic leadership for their area, there is no
    equivalent across the East of the Midlands Engine.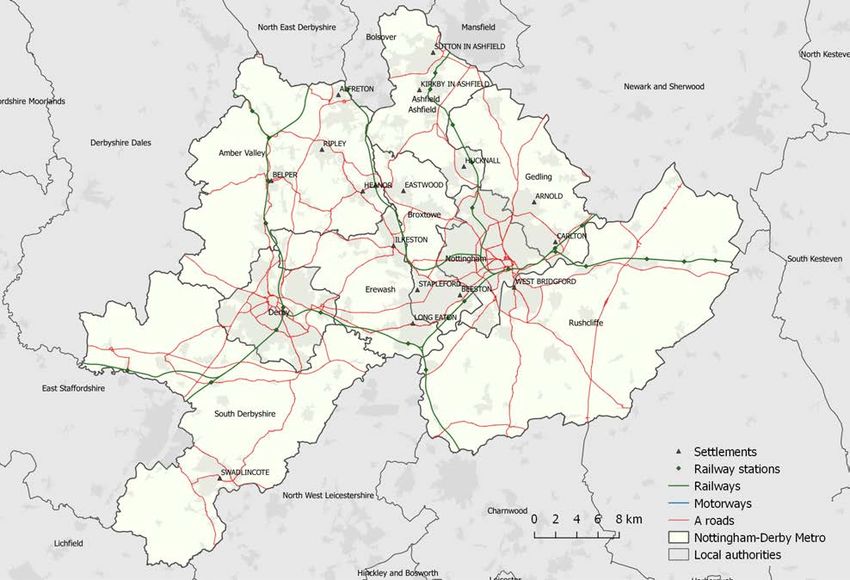
The Economic Case For The Nottingham-Derby Metro                                                   5

Our report makes a strong case for more collaboration to drive inclusive growth. Whilst the
two cities will be critical to this, many future economic opportunities lie in the broader metro
area and the intersections between the places and sectors that this represents. The metro
area, based on Eurostat and ONS data, consists of the urban districts immediately adjacent
to the two cities as well as those between them, adding up to a metro population of 1.4m.
It is the fifth largest in the UK.

The biggest growth opportunities that we identify are located between Derby and
Nottingham, the most significant of which is HS2 at Toton. The potential here is enormous,
it could be an innovation campus that links Derby’s advanced manufacturing and
engineering strengths with Nottingham’s burgeoning digital sector, building on the Midlands
Engine Innovation accelerator plans. It could also provide much needed housing and be the
catalyst for enabling the former Stanton Ironworks site to be developed to its full potential.

But this opportunity will not make itself. Britain has plenty of Parkway stations which failed
to act as catalysts for economic renewal. Making the most of this will require determined
action, leadership and collaboration between Councils, businesses and genuine public
participation. This can’t be about one place trying to dominate another, nor about the public
sector trying to brow beat Universities, Colleges and businesses.

If all of the key organisations, City and County councils, Districts, LEPs, businesses,
education institutions and local communities can work together in a real spirit of
collaboration then there is a big economic prize to be grasped. We were commissioned to
highlight the scale of the economic opportunity - £11bn more in GVA by 2030 and a more
inclusive local economy. Now it’s up to local political, business and civic leaders to decide
how they want to respond this.

Ben Lucas
Managing Director, Metro Dynamics
6 The Economic Case For The Nottingham-Derby Metro
2 Executive Summary
Derby and Nottingham are cities with different but long histories. They were both at the
forefront of the original industrial revolution and share the potential to be at the heart of
the new one. Their unique assets were fundamental in driving their economies in the past,
whereas their combined agglomeration opportunity is the key to their economic future.
Pivotal to unlocking this opportunity is developing an industrial strategy for the metro area that
can use the catalyst of the HS2 station at Toton to drive a new wave of economic innovation,
generate more quality jobs, and build much needed housing. This will require an industrial deal
for the Derby-Nottingham metro on HS2 development, investment, innovation and housing.
Metro Dynamics were commissioned by Derby and Nottingham City Councils to prepare an
independent report on the potential growth opportunities that could be developed if the Derby-
Nottingham area were to function, in economic terms, as a metro. In developing this report, we
have reviewed a range of economic data, looked at how the area currently functions, assessed
the emerging agglomeration opportunities, and spoken to key figures in the local economy.
Our conclusion from this review is that the area already has some of the characteristics of
a metro area, but if it started to act as one, it could accelerate these economic benefits and
drive inclusive growth more effectively across the whole area.
An economic pen portrait
The metro area is a powerful economy. Both cities coped better with 1980s de-industrialisation
than other industrial cities. Consequently, their economies are stronger and have grown
more than many other industrial cities in the UK. The area has some of the finest and most
internationally recognised businesses, universities and colleges in the UK.
• Gross Value Added (GVA) per capita is third highest of all core city regions, similar to
Greater Manchester1.
• Over 600,000 jobs2, with a combined GVA of £30bn3.
• Derby is home to world class advanced manufacturing, which accounts for 30% of its GVA,
making it the strongest manufacturing city in the UK4.
• Nottingham has regional city strengths in finance, business services and public
administration, as well as growing specialisms in biotech, data processing, digital and
creative sectors.
• Three major universities -University of Derby, Nottingham Trent University and University
of Nottingham.
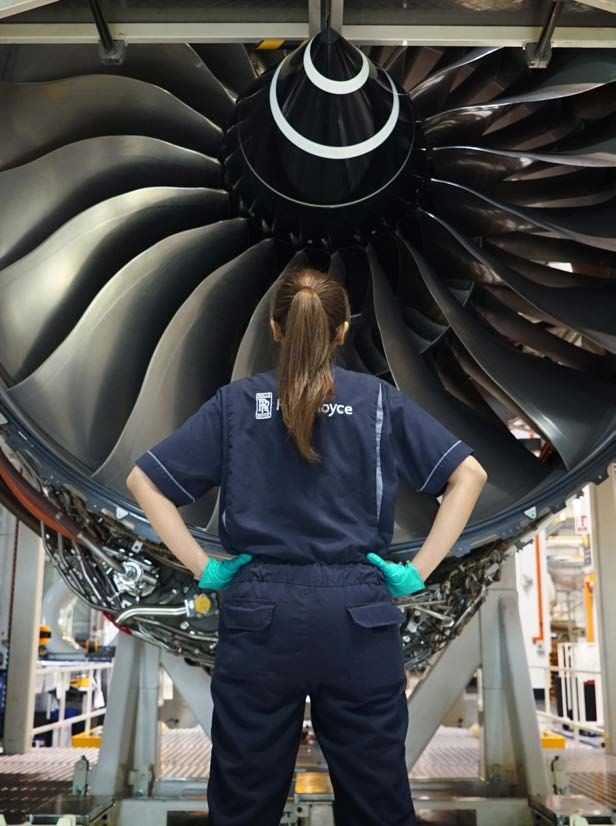
• Location and/or home for major businesses such as Rolls-Royce, Boots, Bombardier,
Experian, Toyota, Capital One and Paul Smith.
1 ONS Regional Accounts, per capita estimate 2015 3 ONS Regional Accounts 2015
2 Business Register and Employment Survey (BRES) 2015 4 ONS Regional Accounts 2015
The Economic Case For The Nottingham-Derby Metro                                                                                                                       7

The metro geography
The RSA City Growth Commission5 identified Derby and Nottingham as one of the 15
large urban areas in the UK that could benefit from operating formally as metro economic
areas. The basis for this designation was the use of Office for National Statistics (ONS)
built up areas data. We have combined this methodology with Eurostat urban area data.
This aligns economic evidence, built up areas and Strategic Housing Market areas. The
resulting metro area:

• Covers the local authority areas of Amber Valley, Ashfield, Broxtowe, Derby, Erewash,
  Gedling, Nottingham, Rushcliffe, South Derbyshire.
• Has a population of 1.4m 6 .
• Is among the top 5 largest metro areas outside London, and in top 50 metro areas
  in Europe7.

A metro in all but name
The Derby-Nottingham area already has many of the characteristics of a metro area 8:

• 40,000 people commute daily between the two cities, and 426,000 metro residents
  commute daily9.
• The metro area covers 87% of commuters into Derby and Nottingham10 .
• 40% of the metro population live in the two cities11, yet 55% of jobs12 and 70% of job
  adverts are in the cities of Derby or Nottingham.
• 82% of metro residents work in the metro, whilst 83% of metro workers live in the area,
  this is a level of self-containment greater than that of the Metro Mayoral areas of the
  West of England and Cambridgeshire and Peterborough13 .
• Derby and Nottingham are the only two adjacent cities in Britain that have almost
  identical levels of GVA per capita14 .
• The two cities are closer than the Olympic Stadium and Wembley in London15 .

5 www.thersa.org/discover/publications-and-articles/reports/unleashing-metro-growth-   10 Census 2011 11 ONS population estimates 2016
final-recommendations 2014                                                             12 BRES 2015
6 ONS population estimates 2016                                                        13 http://sheffieldcityregiondevolution.org.uk/wp-content/
7 Eurostat database urban audit 2014; We have combined the urban areas of              uploads/2016/07/1741120-20SCR20-20CA20Expansion20-20Final20report20-
Nottingham and Derby and combined them with other urban areas to get this figure.      202820June20-20Incl20Exec20Sum.pdf
8 All commuting figures are from Census 2011                                           14 The only other two proximate UK cities with similar levels of GVA per head
9 Both are figures from Census 2011. The first figure counts commuters between         are Birmingham (£22,307) and Coventry (£22,164). This is from ONS Regional
both ‘Metro cities’, that is Derby Metro City (Derby, Amber Valley, Erewash and        Accounts 2015.
South Derbyshire) and Nottingham Metro City (Nottingham, Ashfield, Broxtowe,           15 Using the centres between the two cities and walking distance from Google,
Gedling and Rushcliffe)                                                                and that of the Olympic Stadium and Wembley
8               The Economic Case For The Nottingham-Derby Metro

                The case for operating as a metro
                In an economic and public policy context in which scale matters to achieving agglomeration
                benefits and sub-regional clout, there is a powerful case for the area to operate more formally
                as a metro partnership. As Britain prepares for Brexit, it will be critically important for local
                authorities to work closely with business to respond to any immediate economic shocks, as
                well as to seize new trading opportunities that may emerge. The report notes that the two city
                councils have decided to get on with collaboration and have published a metro strategy, which
                they are now enacting. This joint working - which covers areas such as leisure services, back
                office, and procurement - is an early indication both of intent and potential.

                This report identifies a number of benefits for more formal metro economic arrangements.
                The most compelling include:

                • Overcoming the challenges of relatively underbounded cities to establish a model of
                  voluntary collaboration that builds on the bicentric and complementary relationships
                  between the two cities and the local authority areas around and between them.
                • Giving the metro a more powerful voice, so that it can respond strongly to the challenges
                  and opportunities of the post-Brexit economy and engage effectively both with the
                  Midlands Engine and UK government.
                • Enabling a more strategic approach to generating inclusive growth, through combined
                  approaches to education and skills improvement.
                • Ensuring that the area will be able to reap the full economic, connectivity and inclusive
                  growth benefits of Hs2 at Toton.
                • Building on the fact that the metro’s major growth opportunities lie in economic and
                  location intersections across the area, for example, between digital and manufacturing
                  sectors, and between Nottingham, Broxtowe, Erewash and Derby over exploiting the
                  full potential of HS2 at Toton.

                Growth ambition
                The objective for greater economic collaboration is to grow and spread prosperity and
                opportunity across the metro area. Internationally, the Derby-Nottingham metro should be
                competing and collaborating with other successful urban metro areas. In the report, we look
                at the example of Nuremburg-Furth in Bavaria.

                Globally, cities are driving growth and outperforming their national economies. But despite
                its strengths, the Derby-Nottingham economy lags behind the national GVA rate. Our report
                proposes a target of closing this gap by 2030. This would add an additional £11bn to the
                economy, which is 20% of the target that the Midlands Engine has set for itself over the
                same time period, even though the Derby-Nottingham population only makes up 15%
                of the Midlands population16 .

16 ONS population estimates (2016)
The Economic Case For The Nottingham-Derby Metro                                                         9

Priorities for metro collaboration
The way in which the Derby-Nottingham metro will meet its growth ambition is through
accelerating agglomeration benefits that can drive better productivity and create the right
environment for business innovation. Providing effective support to local businesses,
combined with imaginative public sector working, could create a very strong testbed for
innovation as well as driving more inclusive growth. The report identifies five priority areas
on which metro collaboration should focus:

   1                                                     2
   Inclusive growth                                      Infrastructure
   The report sets out a range of proposed               We highlight how HS2 at Toton represents
   actions including: better aligning skills             a significant opportunity for radical
   demand and provision with local skill                 improvements in connectivity, particularly
   needs; a combined approach to better                  by catalysing frequent and fast connectivity
   business engagement with schools;                     between the two cities through Toton. There
   a combined approach to educational                    will need to be substantial infrastructure
   and skills improvement; a Low Pay                     investment to ensure that Toton fulfils and
   Commission, and an inclusive growth                   surpasses to its potential, including through
   investment framework and metrics.                     unlocking housing development.

   3                                                     4
   Business and                                          Place and
   Innovation                                            promotion
   The metro is already home to established              In the post-Brexit world, Derby-Nottingham
   and successful businesses but it needs to             will need to market itself as an attractive
   do better at identifying supply chain cluster         location for investment and migration.
   growth opportunities. In addition, there is           The report suggests that joint working on
   potential to grow the metro’s reputation as           the tourism and marketing activity of Derby
   a centre for innovation, with the existing            and Nottingham should be an early priority,
   innovation parks and the proposed                     alongside a city centre masterplan, and
   innovation campus at HS2 in Toton.                    collaborative event bidding.

   5
   Public Service Reform
   The two city councils have begun to work to scope the public service reform potential
   of deeper collaboration. We outline the potential to extend this to a range of other citizen
   services. There are obviously opportunities to promote collaboration of wider wellbeing and
   care services and the report also points to the efficiency and wider economic benefits that
   might flow from collaboration on procurement, planning and back-office services.
10          The Economic Case For The Nottingham-Derby Metro

A new local industrial strategy deal -
governance and delivery
There is an opportunity for Derby-Nottingham metro            A Metro Growth Board could be established that draws
to establish a new model for metro governance and             its membership from the existing Metro Strategic
delivery, which would be appropriate for a local              Advisory Group, which is made up of a mixture of
industrial strategy deal. This would need to be robust        council, business and education leaders. It would be
and clear, and reflect the principles on which metro          responsible for local industrial strategy and could have
economic arrangements would be based. The metro               oversight and governance responsibilities over several
area exists within two county areas, Derbyshire and           delivery vehicles.
Nottinghamshire, along with seven district councils, the
D2N2 LEP and an array of major businesses, universities       These delivery vehicles could include:
and colleges. Therefore, the core principles for any new
                                                              • Growth Company - Supporting jobs, growth,
arrangements should be partnership and collaboration.
                                                                productivity, business support and place marketing.
This will require different ways of working. The metro        • HS2 Development Corporation - Delivering the HS2
will not be a panacea for growth in every instance, and         economic growth and infrastructure plan at Toton -
businesses, councils, universities and colleges will            would require statutory Development Corporation
need to continue to work at local, Midlands Engine and          powers.
national level where appropriate. To be successful as a
                                                              • Housing Company - Delivering housing on public
metro, the partners will have to develop behaviours and
                                                                land sites, packaging sites to attract private sector
principles that embed collaboration. This cannot appear
                                                                investment.
to be about any one place or organisation dominating
the area. What is required is a genuine commitment to         • Municipal Corporation - Owning and operating shared
partnership, in which it is clear that metro working will       services and systems, both back and front office.
drive benefits for every area and group, and where the        • Derby and Nottingham Transport Board -
basis for this is established from the outset.                  Co-ordinating transport plans and developing
                                                                investment proposals for better connectivity across
A set of arrangements designed to co-ordinate and drive
                                                                the metro.
inclusive growth across the metro area and to strike a deal
with government on funding, investment and new powers         • Inclusive Growth Board - Bringing together
should be based on partnership between the public sector        Opportunity area work in Derby with improvement
and business. The great 19th Century Cities, such as            work in Nottingham to co-ordinate activity at all-ages,
Derby and Nottingham, grew as municipal corporations, by        including school improvement, skills co-ordination and
bringing together councils and business people to provide       investment proposals.
their economic leadership. Derby-Nottingham metro could
establish a modern corporation model, incorporating
a version of the ‘modern aldermen’ proposed in the
government’s industrial strategy Green Paper.
The Economic Case For The Nottingham-Derby Metro                                                                                                                  11

Funding the metro

As the report highlights, the Derby-Nottingham area has been considerably
underfunded both in general public spending and in infrastructure investment.

A key element of ensuring that any new arrangements could deliver on their potential
and achieve the inclusive growth ambition will be the funding and investment that
the metro is able to win and attract. In addition to exploring options for business rate
pooling, that will depend on government policy on fiscal devolution, the other funding
components could include:

• Infrastructure Investment - A Tax Increment Financing (TIF) equivalent to fund
  investment in transport connectivity linking the two cities to, and through, HS2 at
  Toton.
• Housing investment - Both through current and future Housing Investment Fund
  (HIF) bids, other forms of local housing deals and greater flexibility on Housing
  Revenue Account (HRA) levels.
• European Structural and Investment Funds (ESIF) allocation via UK Prosperity Fund
  - The metro should receive its share of the ESIF funding currently allocated to the
  area - £160m17- so that it can plan to invest this to support inclusive growth.
• Land value capture - The metro should explore the financial options associated with
  land value capture, as this will be an important revenue and finance opportunity due
  to the direct and indirect impact of HS2 on land values.

17 https://www.gov.uk/government/uploads/system/uploads/attachment_data/file/307492/bis-14-772-uk-allocations-eu-structural-funds-2014-2020-letter.pdf - Although
the metro’s allocation may change compared to the wider D2N2 LEP area, the metro is already among the ‘More developed’ UK areas, and so it is unlikely that its per
capita funding of €120 per person would change significantly. https://www.gov.uk/government/uploads/system/uploads/attachment_data/file/307562/bis-14-773-eu-
structural-funds-uk-allocations-2014-to-2020-equality-impact.pdf
12   The Economic Case For The Nottingham-Derby Metro

3    The Derby-Nottingham Metro

     The Derby-Nottingham metro is a £30bn GVA economy, and home to 1.4m people and
     600,000 jobs. The metro is amongst the top 5 largest metro areas in England (outside
     London), placing it in the top 50 metro areas in Europe for population. This gives it size
     and scale on a world stage.

     At the heart of the metro area are the two cities of Derby and Nottingham, only 15-miles
     apart. The two cities are economically distinct and this drives the economic specialism of
     the local authority areas that surround them.

     Derby is a world leader in manufacturing and engineering; Nottingham in bioscience
     and business services. These strengths have made the area an attractive location for a
     number of productive multi-national companies, including: Rolls-Royce, Boots, Experian,
     Bombardier, Toyota and Capital One.

            2hrs
                            Within 2 hours of 90%
                            of England’s population

                            Less than an hour from London
                            by 2032

                            Two cities closer together
                            than the Olympic Stadium and
                            Wembley (15 miles)
The Economic Case For The Nottingham-Derby Metro 13
Operating at scale
Metros, as defined by Bruce Katz and others, are the larger constellations of cities and
towns that constitute a functional economy within built up areas. The RSA City Growth
Commission (2014)18 identified the Derby-Nottingham Metro as one of the UK’s 15 areas
best placed to drive economic growth through joined-up decision making. The Commission
used Office for National Statistics (ONS) built up areas to show that 1 million people live in
the urban areas of the two cities.
We have combined this methodology with Eurostat urban area data. Eurostat uses
economic and demographic statistics to identify the appropriate geography for urban areas,
and is widely used to compare European cities. Combining these methodologies provides
a geography best placed to maximise the economic benefits of operating at scale, aligning
with economic evidence, built-up areas and Strategic Housing Market Areas.
This provides a geography for the Derby-Nottingham metro of: Derby, Nottingham, Amber
Valley, Ashfield, Broxtowe, Erewash, Gedling, Rushcliffe and South Derbyshire.
Figure 1 - A map of the metro with key employers’ locations.
10
9
6
7
2
5
8
1 3
11
4
1, 2, 10. Rolls-Royce 5. HS2 8. Vision Express
3. Bombardier 6. Experian 9. Capital One
4. East Midlands Airport 7. Boots 11. JCB
18 RSA City Growth Commission Final Report 201414 The Economic Case For The Nottingham-Derby Metro
Operating at this scale provides opportunity. Economic evidence cites the capability of
agglomeration to drive economic growth in places. It is this logic that has driven the global
increase in metro level governance, from India to Germany. Linking places helps drive
productivity through widening labour markets and employment opportunities, improving
skills provision, creating relationships between drivers of innovation and expanding markets
for products. It can also provide the scale necessary to attract additional investment.
Derby and Nottingham are well placed to benefit from this opportunity, as the cities are
underbounded. Nearly 50% of the cities’ residents do not live within the two cities’ local
authority boundaries according to ONS built up areas19 - making collaboration between the cities
and their neighbouring authorities vital. This is even more pertinent given the high levels
of commuting flows into the cities - as demonstrated in Section 4.
The complementary strengths of the two cities also provide opportunities. The two cities’
different strengths mean that little is gained from competition between them, whilst collaboration
is advantageous for skills and workforce. The diverse industrial strengths provide an opportunity
to foster innovation through collaboration between sectors (as outlined in the industrial strategy
Green Paper).
Business does not recognise local authority boundaries. For instance, Rolls-Royce already
employ around 1,000 people in Hucknall and Annesley alongside its main base in Derby20,
whilst both shopping centres are owned by INTU and there are numerous other links between
the two cities which can be enhanced through the networks created by agglomeration.
Why now?
HS2 offers a unique opportunity to capitalise on the potential economic benefits of the two
cities working together. Toton will be only 52-minutes from London and is almost equidistant
between the two cities. This offers a growth opportunity, but one that can only be built
upon through wider metro area collaboration. A combination of political will and economic
imperative could maximise the mutual benefits of agglomeration between the two cities.
The government’s industrial policy is also well placed to harness the opportunities. Derby
and Nottingham’s diverse but complementary economies offer cross-sector collaboration
potential to drive innovation and national productivity gains. No other area of the UK has
such untapped potential for this kind of collaboration between innovative industries and
major multinational companies.
As Britain prepares for Brexit, it will be critical that local authorities work closely with
business to prepare for any potential economic shocks, as well as seizing new trading
opportunities that might emerge. Collaborating at metro level will help make the most of
the area’s export strengths, building on burgeoning relationships with China and India.
Moreover, to build a metro that can respond to the economic opportunities of the future will
require mobilising resources and investment at scale to support innovation in automation,
AI, cyber security and food and energy self sufficiency.
19 Census 2011 ONS built up area data
20 http://www.nottinghampost.com/news/business/tens-millions-invested-nottinghamshire-rolls-147162The Economic Case For The Nottingham-Derby Metro 15
Cities account for 80% of global growth21
61% of the UK’s growth is driven
by its city regions22
The two cities provide 55% of jobs
and 75% of inter-council commuting23,
but 40% of population
70% of job adverts are within the cities
As self-contained as D2N2 (despite a
smaller size) and significantly more self-
contained than Derbyshire (79%) and
Nottinghamshire (81%)24
21 RSA City Growth Commission Final Report 2014 23 Census 2011
22 RSA City Growth Commission Final Report 2014 24 Census 201116 The Economic Case For The Nottingham-Derby Metro
4 The economic case
for working as a metro
A uniquely bicentric economy
No other two cities are so close together, yet have such different economic specialism.
Over 30.0% of Derby’s GVA is generated by manufacturing, compared to only 7.7% of
Nottingham’s and the UK average of 9.7%25. This is despite their proximity, and is over 50%
more accentuated than any other proximate UK cities26.
The cities have similar productivity within their local authority areas; this is unusual
compared to other UK cities and is particularly notable given the lack of similarity between
the two economies. Nottingham has a GVA per head of £27,645, compared to Derby’s GVA
per head of £27,25927.
The cities make up 53% of the area’s GVA28,
despite being only 45% of its population.
GVA per capita is 3rd highest of all core city
regions and similar to Greater Manchester and
Leeds City Region29.
The two cities have higher GVA per head than
Liverpool, Cardiff, Birmingham, Leicester,
Newcastle, and are similar to Leeds.
25 ONS regional accounts 2015 27 ONS regional accounts 2015 per head data
26 We have compared the ONS sub regional GVA figures for the local 28 ONS regional accounts 2015
authority areas of: Bath and Bristol; Newcastle and Sunderland; Birmingham, 29 ONS regional accounts 2015
Wolverhampton and Coventry; Cardiff and Newport; Bradford and Leeds;
Portsmouth and Southampton.The Economic Case For The Nottingham-Derby Metro 17
Derby
Derby was a home of the industrial revolution. The GVA from manufacturing, which is over double the
presence of strong and established companies in national average32. These local authorities’ recent strong
advanced engineering saw the city weather de- GVA per capita growth has mirrored the strong recent
industrialisation, experiencing rapid GVA growth over growth in Derby - unsurprisingly given their similar
the last 15-years. This has accelerated recently with manufacturing strength.
the city’s GVA per head growing by 9.5%30 over the
last five years, the second highest of local authorities • Rolls-Royce (12,000 employees in Derby, 1,000 in
in the metro. Derby is the strongest city in the UK for Nottinghamshire)33
manufacturing by a significant margin, as well as the • Bombardier (1,600 employees)34
most productive council area in the country with a
• Toyota (3,000 employees)35
specialism (30% of GVA+) in manufacturing31.
• Over 12,000 employed in the manufacture of other
Derby’s manufacturing strength drives similar advantages transport equipment36
in its neighbouring local authorities. South Derbyshire,
• Nearly 5,000 employed in architectural and
Amber Valley and Erewash derive at least 20% of their
engineering activities37
Nottingham
Nottingham’s economic composition is more business services. These authorities’ productivity gains
typical of a large UK city. It coped relatively well with are closely tied to Nottingham’s. The wider Nottingham
de-industrialisation, with a successful pivot to financial area has seen slow recent growth compared to Derby,
and business services in the 1980s. It is the regional hub as Nottingham’s GVA per capita fell by 1.1% between
for government departments such as the Inland Revenue, 2010 and 2015 .
resulting in a specialism in public administration (28.6%,
compared to an England average of 17.8%38). Nottingham • 7,650 people employed by Boots39
has a knowledge-driven economy, with high productivity • Over 3,000 people employed in data processing -
associated with headquarters of major companies and a 9x the UK average40
strength in IT. The city has burgeoning biotech and data
• Nearly 1,000 employed by Capital One41
processing businesses, driven by major businesses such
as Boots, Experian and Capital One. • 1,125 by Games Workshop42
• Global headquarters of Experian43
As with Derby, Nottingham’s sectoral strengths shape the
economy of the areas around it. The closer these areas • 1,134 employed by Paul Smith44
are to Derby, the more manufacturing orientated their • By 2021, up to 2,600 people employed by the Inland
economies are. Broxtowe and Ashfield have significantly Revenue45
above average GVA generated by manufacturing,
• Over 10,000 people employed in higher education -
whilst Rushcliffe and Gedling - to the south and east of
Over 3x the UK average46
Nottingham - are more orientated towards science and
30 ONS regional accounts 2010 - 2015 38, 39 ONS regional accounts 2015
31, 32 ONS regional accounts 2015 40 http://www.nottinghampost.com/news/business/nottinghamshires-top-200-
33 http://careers.rolls-royce.co.uk/united-kingdom/engineering-and- companies-revealed-162688
manufacturing/our-locations/derby#/; http://www.nottinghampost.com/news/ 41 BRES 2015; employees in SIC 63110- Data processing, hosting and related
business/tens-millions-invested-nottinghamshire-rolls-147162 activities
34 Planes Trains and Automobiles Part 2, Derby City Council, March 2017 42, 43, 44 FAME 2016
35 FAME database by Bureau van Dijk 2015 (FAME) 45 https://www.civilserviceworld.com/articles/news/hmrc-announces-major-office-
36 BRES 2015 - SIC30 closure-programme-%E2%80%93-full-regional-breakdown-and-reaction
37 BRES 2015 - SIC71 46 BRES 201518 The Economic Case For The Nottingham-Derby Metro
GVA breakdown by industry (2015)
Agriculture, forestry and fishing Financial and insurance activities
Manufacturing Real estate activities
Production Business service activities
Construction Public administration;
England
education; health
Distribution; transport;
accommodation and food Other services and household activities
Information and communication
Amber Valley Ashfield Broxtowe
Derby Erewash Gedling
Nottingham Rushcliffe South Derbyshire
Figure 2 - GVA breakdown by industry (2015) for each metro local authority Source: ONS Regional Accounts 2015The Economic Case For The Nottingham-Derby Metro 19 Linked by its people Commuting patterns highlight the extent to which the metro already functions as one economy. The top nine areas for commuting to and from councils are the nine metro local authorities. A total of 82% of metro residents work in the metro, whilst 83% of metro workers live in the metro47. This figure of 82% is well above the ONS minimum of 75% (the threshold for being seen as a functional economic market area in terms of self-containment48), making the area more self-contained than Cambridgeshire and Peterborough and the West of England MCAs, and similar to Greater Manchester. The figure of 82% compares to a self-containment of 71% in Derby and Derbyshire and 80% in Nottingham and Nottinghamshire.49 40,000 daily commuters between the two metro cities50 The metro area covers 87% of commuters into Derby and Nottingham50 426,000 daily commuters within the metro50 55% of commuters go to Nottingham and Derby50 Nottingham, at 43%, is significantly less contained than Derby (62%)50 47 Census 2011 49 Census 2011 48 https://www.ons.gov.uk/employmentandlabourmarket/ 50 All sources for commuting infographics from Census 2011 peopleinwork/employmentandemployeetypes/articles/ traveltoworkareaanalysisingreatbritain/2016
20               The Economic Case For The Nottingham-Derby Metro

Origins of metro workers

100,000

 90,000

 80,000

 70,000

 60,000

 50,000

 40,000

 30,000

 20,000

 10,000

         0
                 am

                                 y

                                       h

                                                        e

                                                                 d

                                                                       fe

                                                                                 re

                                                                                        d

                                                                                                 d

                                                                                                                er
                       by

                                                 g
                               le

                                                      ow
                                        as

                                                                                               oo
                                             lin

                                                             el

                                                                                       el

                                                                                                        ire
                                                                      lif

                                                                                                              ov
                                                                              hi
                      er

                              al
             gh

                                                            hfi

                                                                                      sfi
                                             ed

                                                                     hc
                                      ew

                                                                                              w
                                                                               s

                                                                                                      sh
                                                        t

                                                                                                              ls
                      D

                            rV

                                                     ox

                                                                            by

                                                                                   an
          t in

                                                            As

                                                                                            er

                                                                                                           Bo
                                                                  us
                                             G

                                                                                                    rd
                                   Er

                                                  Br

                                                                            er
                          be

                                                                                            Sh
                                                                                   M
        ot

                                                                                                   fo
                                                                  R

                                                                          D
      N

                       Am

                                                                                                 af
                                                                                        d
                                                                       h

                                                                                       an

                                                                                                 St
                                                                      ut
                                                                     So

                                                                                              st
                                                                                      k
                                                                                     ar

                                                                                            Ea
                                                                                   ew
                                                                                 N

Figure 3 - A graph showing the daily origins of metro workers.
Source: 2011 Census

Interdependence is mirrored in migration figures. Every year, 32,000 people migrate from
one local authority in the metro to another51. This accounts for 41% of migration to metro
authorities. Testament to the importance of these cities to the wider economy, 72% of these
32,000 people are going into or out of either Nottingham or Derby. The cities also act as
beacons to young people from outside the area through their universities, a trend which is
enhanced by older migrants being more likely to move outside the cities.

51 Census 2011
The Economic Case For The Nottingham-Derby Metro 21
Wealth concentrated in the hinterlands
Despite the relatively high GVA of the cities, they suffer from high levels of deprivation-
meaning their growth fails to benefit many residents. This is particularly the case in
Nottingham. Many of its wealthiest earners live outside the city, such as in Gedling, Rushcliffe
and Broxtowe. In Gedling and Rushcliffe, 40.7% and 46.4% of residents, respectively have
NVQ4+ qualifications52, compared to 29.6% in Nottingham (and 33.3% in Derby)53. The local
authorities surrounding the cities are also more likely to be home to managers, directors and
professionals54. This is reflected in lower property prices in the cities55.
This trend results in low residential wages in the cities. Derby (highest) and Nottingham (5th)
have relatively high median workplace wages56, yet low residential wages57. All other local
authorities in the metro (except Ashfield) have higher residential than workplace wages.
Nottingham has the lowest median £
£ residential wage in the metro (£23,346),
despite relatively high productivity. £
£ Meanwhile, Rushcliffe has a median
residential wage of £35,11957 £
£
52 Annual Population Survey (APS) 2016 55 Land Registry 2016
53 APS 2016 56 ASHE 2016
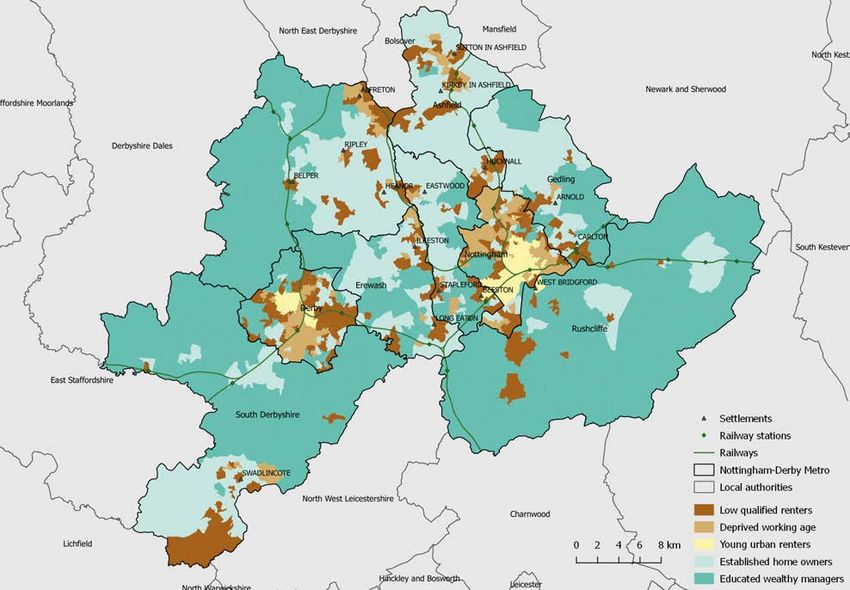
54 APS 2016 57 ASHE 201622 The Economic Case For The Nottingham-Derby Metro Population clusters Figure 4 - Cluster map of the Metro Source: Metro Dynamics methodology analysing 2011 Census data. The cluster analysis above further highlights this trend. Meanwhile, working age residents in poverty (light Rushcliffe, the majority of south Derbyshire and clusters brown) and young urban residents (yellow) congregate of Amber Valley and Gedling have high numbers of in the cities. The cities’ pull of young people through their ‘educated wealthy managers’ (dark green) - people who universities sees the latter group cluster within them - own homes, have managerial jobs and are university residents likely to be university educated, renting and educated. On the other hand, the northern area of the young. This makes both cities (particularly Nottingham) metro is more likely to be home to established home significantly younger than the UK average58. owners (light green) - with low levels of qualifications but low levels of deprivation. 58 ONS Annual Population Estimates 2016
The Economic Case For The Nottingham-Derby Metro 23
With the need for a focus on inclusive growth
in the cities
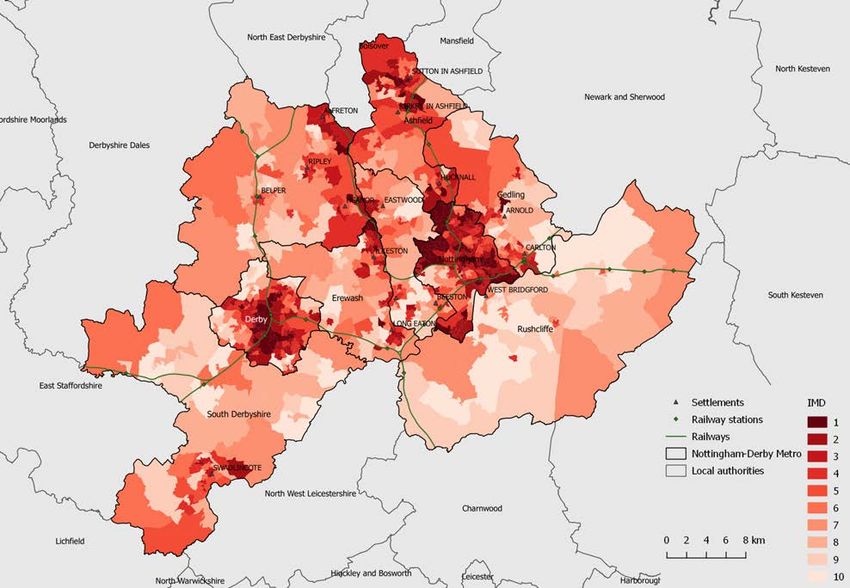
Figure 5 - Map of Metro LSOAs by Indice of Multiple Deprivation
Source: Indices of Multiple Deprivation (2016)
Wages
This commuting, educational and wage disparity within 33.9% of Nottingham’s working age residents are
the metro makes inclusive growth a priority, particularly economically inactive - above the England average. This
for the cities. No unitary authority or county council with is followed by Ashfield and Derby, which have inactivity
a GVA per head below £30,000 has as wide a negative rates of 23.8% and 23.4%. Metro inactivity is 22.4%.61
disparity between its residential wage and GVA per head
as Nottingham59. Simply put, growth is failing to benefit Nottingham has 7.9% unemployment, compared to
enough of Nottingham and Derby’s residents. This is a national average of 4.9% and metro unemployment
demonstrated in both wages and economic inactivity rates. of 4.1%.62
35% of Nottingham’s and 28% of Derby’s residents’ 7.35% of Nottingham’s residents receive ESA, alongside
jobs are paid below the Living Wage, with a particular 7% of Derby’s and 7.67% of Ashfield’s.63
problem existing for part-time workers.60
59 This is a comparison with any unitary or county local authority in the UK, based 61 Economic inactivity rates can be distorted by high levels of students - which is
on their GVA (ONS Subregional Accounts, 2015) and their residential wage (ASHE likely in Nottingham. Nevertheless, Nottingham’s economic inactivity is still likely
2016) to be too high.
60 https://www.thersa.org/action-and-research/rsa-projects/public-services-and- 62 APS 2016
communities-folder/inclusive-growth-commission/map; Living Wage by place 2014 63 Using ESA raw numbers from DWP (ages 18-59); proportions calculated using
ONS Population estimates 201624 The Economic Case For The Nottingham-Derby Metro
% of pupils at the end of KS4 with 5A*-Cs
(including English and maths)
England Derby Derbyshire
Nottingham Nottinghamshire
65%
60%
55%
50%
45%
40%
2009/10 2010/11 2011/12 2012/13 2013/14 2014/15 2015/16
Figure 6 - Graph of KS4 attainment
Source: Revised GCSE and equivalent results in England: 2015 to 2016; Department for Education; 14th July 2017
Education
An associated problem for both cities is education. Poor Both Nottingham and Derby have poorer education
education hinders residents from accessing the labour results than the national average - below 45% of students
market and is a drain on productivity. Both cities have left KS4 with five A*-Cs (including English and Maths) in
an above average proportion of their residents without 2015/1666. This falls below the averages for Derbyshire
qualifications - Nottingham and Derby with 13.4% and Nottinghamshire, which are both above the
and 9.3% of working age (16-64) residents with no England average. Nottingham’s system has consistently
qualifications, respectively64. underperformed national trends over the last 5 years,
This compares to a UK average of 5.2%. whilst Derby’s results have seen a significant decline
since 2011/12.
Nottingham has the 6th highest proportion of working
age residents with no qualifications of any city in the
country (13.4%).65
64 APS 2016
65 Revised GCSE and equivalent results in England: 2015 to 2016; Department for Education; 14th July 2017
66 APS 2016Derby City
26   The Economic Case For The Nottingham-Derby Metro

5    Business and education
     providers’ views on the metro

     During the writing of this report, we have held confidential one-to-one discussions with a
     wide range of business, council, education and university leaders from across the Derby-
     Nottingham Metro. This was a key part of the evidence base, to be used alongside the data
     analysis. In this section of the report, we summarise the findings arising from this senior
     stakeholder research. A full list of interviewees is included in the appendix.

     Top-level objectives of a metro strategy:
     • The key economic growth opportunities for the area are outside the two cities,
       particularly HS2: Making HS2 work is an important part of driving productivity further
       in the metro area. Meanwhile the two cities are under bounded - their housing and
       employment need can only be supplied by working with neighbours in partnership.
       This makes operating at a metro level an economic priority.
     • To drive agglomeration benefits between the cities: It was agreed that the area
       has huge capacity for economic improvement through collaboration and agglomeration.
       A successful metro strategy should focus on facilitating these links, with transport
       improvements central to this.
     • To end damaging competition between partners: All stakeholders - particularly
       those involved in place marketing - highlighted that old rivalries between the cities has
       constrained the ability of the place to maximise its capacity to create agglomeration
       benefits and secure investment. This applies as much to securing private sector as
       public-sector investment.
     • To capitalise on the investment benefits of operating at scale: To be successful,
       the metro needs to be pitched at a sufficient scale to be on the first rung for investments
       and investors who are accustomed to the city region size of Chinese cities.
     • To provide an effective voice in the Midlands Engine: It was agreed that the Midlands
       Engine has cut through with investors at MIPIM, as well as with central government. The
       Metro should be providing a strong, co-ordinated voice in the East Midlands, that can be
       heard within the Midlands Engine and within government.
The Economic Case For The Nottingham-Derby Metro 27
Maximising the impact of the metro:
• The need to develop new forms of collaborative district and county council partnership and - where
behaviour: There are concerns from some of the desired - shared ownership, in recognition of the
districts that the metro would provide an opportunity benefits of co-operation.
for domination by big cities. To mitigate this, there will • A metro where its benefits stretch beyond its
need to be evidence of inclusive decision making and boundaries: Important economic opportunities, such
benefits which accrue across the metro area. as East Midlands Airport and supply chain links with
• A clear and important role for business: The the West Midlands, are beyond the metro’s boundaries.
absence of a shared governance structure has Metro success is dependent on working closely with
lead the relationship between local councils and Nottinghamshire, Derbyshire Leicestershire, Sheffield,
businesses to seem transactional in the past, rather Lincolnshire and others, not at the expense of them.
than a genuine partnership. This means that business The metro should therefore demonstrate how the
leaders should be engaged appropriately during wealth and investment generated will stretch beyond
meetings, with a real commitment by council leaders the area.
and officers to attend these meetings. This should be • An assessment of the relationship between the
reinforced with business leadership being at the heart metro and the Local Enterprise Partnership (LEP):
of the metro, providing real power in decision making. Some areas of focus for the metro, such as business
• A close relationship with Nottinghamshire and support, are functions currently provided by the LEP.
Derbyshire County Councils: The metro can only be The bodies need to be clear about how they would
successful if it works closely with the county councils work together for the joint benefit of the area and
that cover half of its population and its districts. All ensure there is not overlap.
of the metro’s organisations should remain open for
Areas of opportunity and important focus:
• Education is a crucial issue for the metro: The than enterprise zones or business rates. This makes
education system in both Derby and Nottingham is place-marketing and supporting the metro’s skills and
widely regarded as poor and this is backed up by the infrastructure needs vital.
data. Business people stressed the importance of • The key to making the metro feel real is supporting
education in improving productivity, with businesses fast rail infrastructure: Connectivity between Derby
frequently training school leavers with limited and Nottingham is weak compared to other major
numerical and literacy skills. The Chamber of cities, constraining the ability of the area to act as one
Commerce reported that skills and education have connected whole.
been the number one barrier to business growth over
the last ten years. • The disappointment of the Midlands Mainline: The
cancellation of the Midlands Mainline electrification
• The importance of place: Businesses stressed that is a real source of dissatisfaction in the area, and a
they were far more concerned about skills supply potential area of co-ordinated campaigning by a metro
and a sense of momentum around a place, rather authority, alongside partners.
Key requirements of the metro strategy:
• It is important it is not just a talking shop. • Must have business involvement in decision making
• It should have a target all parties can unite around as and shaping the metro action.
the ‘size of the prize’. • Must have council commitment to co-operate as
• Needs a clear rationale and justification. partners in the wider economic interest of the area,
not in that of one institution or authority.
• Must be ambitious - more so than the existing metro
strategy.28 The Economic Case For The Nottingham-Derby Metro
6 How the area is
operating currently
A history of competition
Economic evidence and stakeholder conversations emphasise that operating at a metro
level offers an economic opportunity precisely because the advantages of city collaboration
are so untapped. A significant cause of this is historic political institutions. Despite being
only 15-miles apart67, local government configuration has created more links between each
county and city than the two cities. Until 1997, both cities were districts in their respective
counties. Though both cities are now unitaries, they are still members of county-wide
marketing organisations, county-wide Police and Crime Commissioners, etc.
This county-based political orientation has built upon and reinforced a competitive divide
between the two cities. Both cities have a strong local identity tied to the counties that bear their
name, whilst neither city has been big enough to dominate the other. This is embodied by the
rivalry between their football and cricket clubs. This rivalry can arguably be seen where both
cities working against each other in bids for investment, marketing and local government.
The North Midlands Devolution Deal would have been the first elected political institution
between the two cities. The absence of the metropolitan county structures which
predominate in most of the UK’s other large urban areas has resulted in the absence of any
shared organisation across the metro. Tyneside, Manchester and Liverpool, for example,
all have organisations that emerged from old transport authorities. The legacy of this is
that the area has failed to effectively link the economic strengths of the two cities, and as
a consequence has suffered from inadequate levels of public sector capital investment.
67 Distance between both city centres, using Google dataNottingham Forest and Derby County football clubs, divided by rivalry, united by Brian Clough
30              The Economic Case For The Nottingham-Derby Metro

                A legacy of underfunding
                This absence of regional and sub-regional organisations has contributed to the metro’s
                underfunding compared to similar areas. This, combined with an economy which coped
                reasonably well with deindustrialisation compared to the great northern cities, has created
                a perception - and reality - of the area being overlooked by government.

                Although Derby-Nottingham has similar GVA per head to Leeds and Manchester city regions68,
                it receives lower government spending per person. The metro area is estimated to receive
                £9,962 per person in spending, compared to its tax contribution of £8,384 per person69. If the
                area received the same level of government spending per head as Greater Manchester, per
                person spend would rise by £800, generating an additional £1.1bn for the metro70.

                There is also a disparity in transport funding. An analysis of government spending
                estimates that the East Midlands will receive £221 per person in transport spending from
                2016/17 onwards, the third lowest for any region71. The North is set to receive £427 per
                person72. This is a continuation of historic underfunding - between 2004/5 and 2015/16
                regional spending per head increased at a lower rate than any other English region (less
                than 1% per annum). All other regions saw transport spending increase by at least 1.5%,
                whilst the UK average was 2.8%73. This regional underfunding has been corroborated by a
                recent report by East Midlands Councils on projected public investment by region74.

                The East Midlands receives (of all regions)75:

                  2nd lowest spending on transport as a % of GVA
                  3rd lowest spending per head as a % of tax revenue
                  Lowest spending per 1m vehicle miles on roads
                  2nd lowest spending per head on roads
                  3rd lowest spending per head on railways

68 ONS Subregional GVA - comparing West Yorkshire CA and Greater               72 https://www.ippr.org/news-and-media/press-releases/new-transport-figures-
Manchester MCA geographies with the Metro                                      reveal-london-gets-1-500-per-head-more-than-the-north-but-north-west-
69 Metro Dynamics analysis of the New Economy Nespresso tool                   powerhouse-catching-up
70 Metro Dynamics analysis of the New Economy Nespresso tool                   73 https://www.london.gov.uk/sites/default/files/transportexpenditure_final_cin54.pdf
71 https://www.ippr.org/news-and-media/press-releases/new-transport-figures-   74 http://www.emcouncils.gov.uk/write/Levels_of_Public_Investment_in_East_
reveal-london-gets-1-500-per-head-more-than-the-north-but-north-west-          Midlands.pdf
powerhouse-catching-up                                                         75 Source for all stats in the infographics at: https://www.london.gov.uk/sites/
                                                                               default/files/transportexpenditure_final_cin54.pdf
The Economic Case For The Nottingham-Derby Metro 31 The new metro strategy The area risks falling further behind in spending if it fails to speak to government with one cohesive voice. England’s six Mayoral Combined Authorities are ahead of the metro, receiving a combined total of £161.5m per annum76 in additional investment funding. This already looks likely to increase, with the government exploring further devolution of funding and powers to some metro regions. In short, the Derby-Nottingham Metro can no longer afford not to work as one economic area. To achieve this, councils need to end damaging competition and recognise their mutual interests. Nottingham is unlikely to negotiate another City Deal which doesn’t involve any local authority neighbours, and Derby cannot afford to fail to secure a City Deal again77. All partners need to acknowledge - and have the mechanisms that ensure - that economic growth and collaboration across the metro will benefit each local authority area individually too. Derby and Nottingham City Councils have already begun ambitious work to build the basis for metro level collaboration. This began with the ‘Derby and Nottingham Metropolitan Strategy 2030’, published in April 201778. The Metro Strategy laid out the ambition for the two cities to speak with one voice, recognising that working closely together would allow the councils to collectively punch above their weight with the public and private sector in the UK and internationally. The Metro Strategy identified five strands of work and ambitions: enterprise, skills, connectivity, place and public services. An action plan has been developed to identify the short and medium-term actions required to meet these ambitions and the three objectives that have been identified under each ambition. These include quick wins that can be secured to deliver immediate service improvements for residents, and medium-term actions that can build on these quick wins to deliver deeper and more ambitious collaboration in the long term. The metro strategy has already been successful in delivering service improvements to improve the lives of the residents of the two cities. For example, the two councils have already taken steps to integrate their leisure and cultural offer for residents and visitors. This will allow those who work in one city and live in the other to access leisure facilities in both. Behind the scenes collaboration on transport, place marketing and fostering innovation has also been developing, which will help deliver more investment, productivity and a better run transport system to the metro. Work is already going on between the two councils to deepen and broaden this strategy, to make the two cities better places to live, work and play. This should deliver savings and service improvements for residents in the context of the ongoing and future squeeze on local government finances. This existing and developing shared commitment of the cities to work together more closely gives them credibility in implementing the recommendations of this report. The two cities will continue to work more closely in the future, providing the base for the area to capitalise on the economic opportunities of the metro working as one. 76 https://www.nao.org.uk/wp-content/uploads/2016/04/English-devolution-deals.pdf 77 Derby was one of only English two key cities (the other being Bournemuth) that didn’t receive a City Deal during the last government. 78 Derby Nottingham Metro Strategy; April 2017
32                The Economic Case For The Nottingham-Derby Metro

The Opportunity: Nuremberg-Furth
The Nuremberg-Furth area is identified by Eurostat                                        transport hub promotes links between business, science
as a relatively similar area to Derby-Nottingham.                                         and culture across the area. This has been supported by
It has a similar economic makeup79, with a strong                                         the Bavarian State.
advanced manufacturing economy driven by a big local
multinational (Siemens), an urban area of a similar size                                  A key factor in this is connectivity. Unlike Derby-
(1.7m people)80 and an economy driven by two cities                                       Nottingham, the cities are closely linked by advanced
in close proximity. Nuremberg and Furth are only 8km                                      transport infrastructure. A conventional train line, joined-up
apart. However, Nuremberg-Furth is significantly more                                     road network and metro system unite the populations of
economically successful than Derby-Nottingham. The                                        Nuremberg-Furth together and with the wider region. Like
area’s GDP per head (2014) is 17% higher than the                                         Nottingham, Nuremberg also has its own tram system.
German average81.                                                                         The wider metropolitan area (circa 3.5m people) is the
                                                                                          second largest integrated public transport system in
Governance                                                                                Germany, with an integrated fare system, daily commuter
                                                                                          traffic and accessibility of local transport.
Geographically, like Derby-Nottingham, Nuremberg-Furth
is the second largest metro area in its wider region.                                     And a holistic approach to supporting innovation in
Pertinently, the Midlands Engine identified Bavaria as a                                  sectoral strengths
comparator region to the Midlands. Just as Nuremberg-
Furth is the second largest metro area in Bavaria after                                   Improved transport infrastructure has been complemented
Munich, so Derby-Nottingham is the second biggest                                         by state and metro-level attempts to drive productivity
metro area in the Midlands after the West Midlands.                                       through R&D. Bavaria has undergone a ‘high tech office’
Nuremberg is closely linked to Munich through a high-                                     since 200083, supporting sustainable investments and
speed rail connection, just as Toton will soon provide a                                  innovation. As part of this, a €1.4bn High Tech Initiative
rapid link to Birmingham (and London).                                                    (1999-2006) built universities and research institutes
                                                                                          across the state. In 2015 the state established a strategy
State governance has helped support Nuremberg-Furth’s                                     for digitisation.
economic development, providing support for transport
connectivity and aligned economic development. Under                                      At a Metro level, the regional development strategy
the state’s governance, the metro is united as Middle                                     emphasises science based activities located in
Franconia, one of seven decentralised administrative                                      Nuremberg or other major centres with universities. This,
structures (Regierungsbezirke) of the Bavarian                                            coupled with specific Medtech initiatives such as Medical
government. These are intermediary administrations                                        Valley - a national cluster for medical technology - has
between the Bavarian government ministries in Munich                                      been done through the logic that economic growth in
and the local authorities, coordinating the work of various                               sectors of strength will drive benefits for the wider metro
ministries and monitoring and supervising the multitude                                   economy.
of local authorities within the respective regions.
                                                                                          A holistic approach coupled with an integrated transport
With agglomeration benefits driven by                                                     system which has allowed for reciprocal movements of
transport connectivity                                                                    people84 has delivered significant levels of economic
                                                                                          growth. The continued expansion and unification of the
A key driver of Nuremberg-Furth’s productivity is the                                     public transport network across the area has contributed
benefits provided by agglomeration. The metro region’s                                    to making all of the region accessible by public transport.
high population density and strong transport connections                                  This has driven behavioural pattern changes, with the
have seen it designated an agglomeration region82.                                        metro region increasingly becoming a functional economic
Nuremberg’s agglomeration as the region’s business and                                    area, delivering the productivity benefits associated with
                                                                                          agglomeration85.

79 Eurostat database urban audit 2004                                                     82 http://ftp.zew.de/pub/zew-docs/gutachten/ECR2015-NIW_wiiw_ZEW-RCAstudy.pdf-
80 Eurostat database urban audit 2014; We have combined the urban areas of Nottingham     Please note, this is the wider metro region, which includes the Nuremberg-Furth Metro Area
and Derby and combined them with the Eurostat classified urban area of Nuremberg-Furth.   83 http://ftp.zew.de/pub/zew-docs/gutachten/ECR2015-NIW_wiiw_ZEW-RCAstudy.
81 Eurostat database urban audit 2014; We have combined the urban areas of Nottingham     pdf, p.g. 80
and Derby and combined them with the Eurostat classified urban area of Nuremberg-Furth.   84 OECD Rural Policy Reviews Rural-Urban Partnerships, OECD, p.g. 220
                                                                                          85 OECD Rural Policy Reviews Rural-Urban Partnerships, OECD, p.g. 221
You can also read