10 Economic Factors - Transport and Main Roads
←
→
Page content transcription
If your browser does not render page correctly, please read the page content below
10 Economic Factors
AECOM Gladstone Port Master Planned Area
Evidence Base Report for the Proposed Gladstone Port Master Planned Area
10.0 Economic factors
10.1 Introduction
The purpose of this section of the report is to provide background material of an economic
nature which will assist in the preparation of the Master Plan for the Port of Gladstone.
It focuses on the factors which impact on the port of Gladstone and collects data from
numerous sources which are mostly in the public domain. Ports are about trade and the
factors influencing the movement of imports and exports are key to the report. Gladstone
has a significant industrial capacity which is supported by port activity – for example, bauxite
is imported and converted into alumina and aluminium which are then exported. Fuel is
imported to support industrial, agricultural and mining activity in Central Queensland for the
production and export of coal, grain etc.
The continued attraction of industry with import and/or export requirements is recognised as
a strong growth opportunity for the Port of Gladstone. Future production industries are able to
be located close to port export/import facilities.
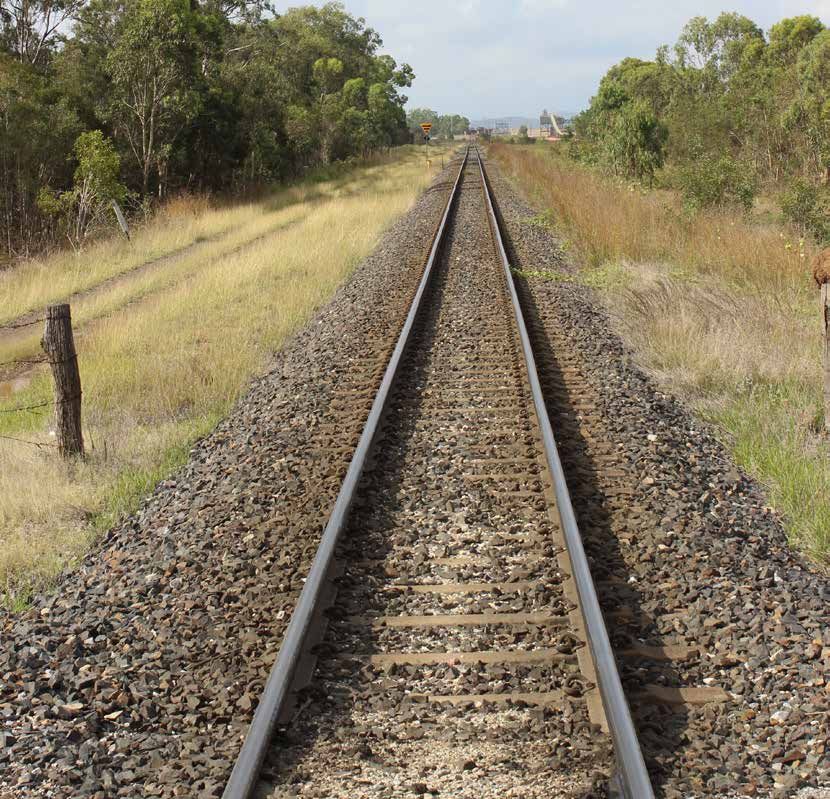
10.1.1 Context for the Port of Gladstone
The Port of Gladstone is Queensland’s largest multi-cargo Port and is the fifth largest coal
export terminal in the world (by throughput). The Port of Gladstone is a major centre for the
import and export of products for the manufacturing, mining and process industries. Handling
more than 1800 vessels annually, it is one of the busiest ports in Australia and plays a vital
role in the local, state and national economies.
The Port’s major functions are to facilitate the export of resources from the Central
Queensland region and to handle the import of raw material and the export of finished
products from major industry established in Gladstone. The Port is a convenient point for the
worldwide distribution of the resources of central and southern Queensland with rail links to
the rich hinterland to the west of the city providing access to coal and other minerals, timber,
agricultural and pastoral areas of the Callide/Dawson Valleys, Central Highlands and Bowen
Basin. A new rail link would facilitate the export of a variety of natural resources from the
Galilee and Surat Basins through Gladstone.
The relationship between Gladstone Port’s marine infrastructure and the supply chain to
industry is a critical consideration in the context of the efficient operations and future growth
of the port. For the efficiency of the port and the maximisation of infrastructure use, the
shorter the loading/discharge time, the better the utilisation of the overall infrastructure,
including channels and berths. For the vessel, the demurrage and costs are similarly reduced
due to the lower time at a port.
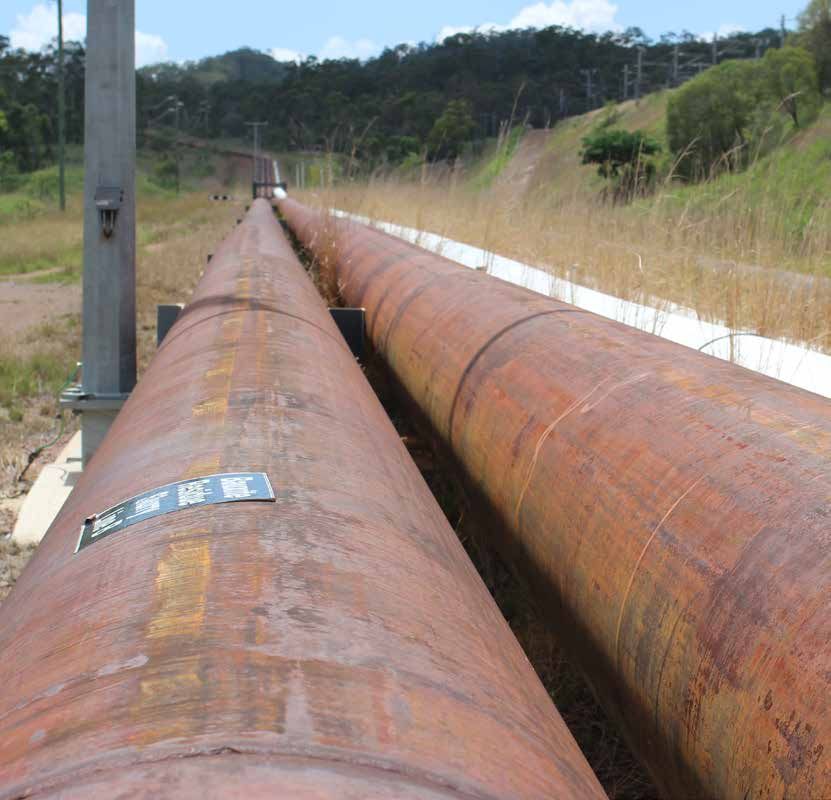
Some products can be immediately transferred significant distances from the wharf while
others cannot. Bulk liquids present the greatest opportunity for storage being located remote
from the wharf. The transport distance is related to the viscosity of the product handled and
therefore the power of the installed pumping capacity. Low viscosity products such as ULP
may be pumped considerable distance with the installed capacity of the tanker. Crude oils
may require additional pump installations to achieve the same distance.
167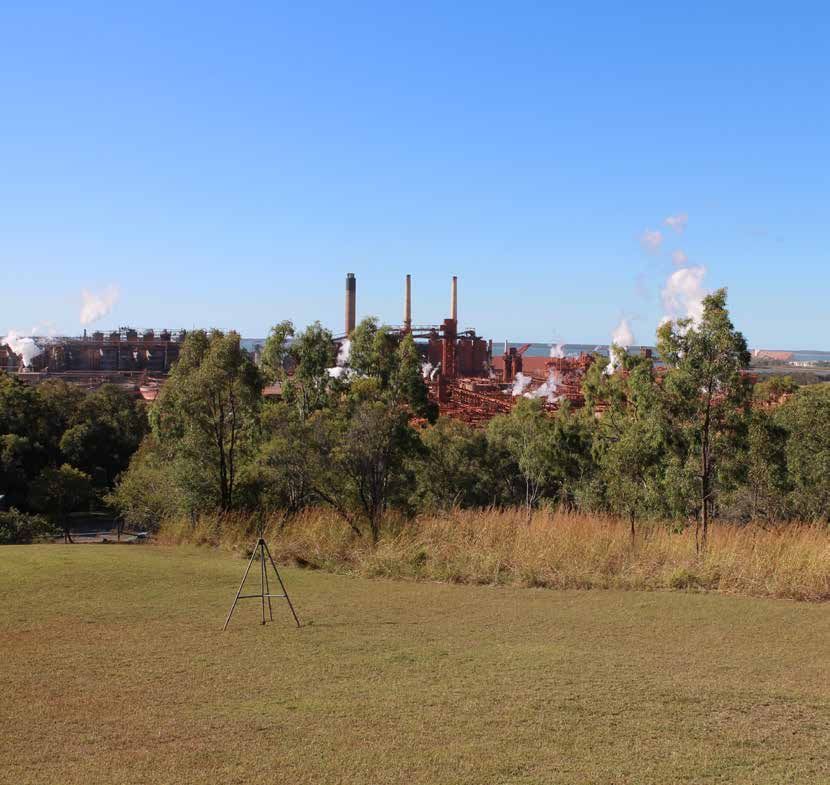
AECOM                                            Gladstone Port Master Planned Area
                                                 Evidence Base Report for the Proposed Gladstone Port Master Planned Area

In comparison, cryogenic bulk liquids need to have the distance between the plant/storage
minimised due to the temperature losses that may result from the overall pumping, etc. For
example, pumping LNG distances of up to a kilometre is considered to be optimal, however
two kilometres of pumping has been used at some sites.
Bulk solids can be conveyed over a considerable distance but the capital and operating costs
increase as a consequence of the distance. A balance is required between the provision of
storage in close proximity to the berth with high conveying rates followed by trickle feed
between the storage and the plant, versus a reduced discharge rate from the berth to a
distant storage facility, resulting in increased marine interface costs.
Break bulk and container trades are best served through the product being stored adjacent to
the berth and short transfer distances during the loading/discharge cycle. For efficiency, land
backed facilities are preferable. The logistics supply chain also needs to reduce the need for
double handling with a rail interface being available at a storage yard, particularly for
container trades.
The Port of Gladstone lies within and adjacent to the Gladstone Regional Council area.
Industries within the harbour catchment area include pastoral, agricultural, processing and
manufacturing. Major processing and manufacturing industries located in the Gladstone
Region include an aluminium smelter, two alumina refineries, an electricity generator, a
manufacturer of sodium cyanide, ammonium nitrate, chlorine and a cement manufacturer.
Three LNG plants have been recently commissioned on Curtis Island. Wiggins Island Coal
Terminal (WICT) has commenced operations with the first shipment having been exported in
May 2015. A large capital dredging project, the Western Basin Dredging and Disposal Project
(WBDDP) was completed in 2013 in association with these new industries.

      10.2         Current port trade activity
Over 30 products are currently handled through the Port of Gladstone and shipped to more
than 30 countries. By far the largest traded commodity is coal, which represented 69 per cent
of total cargo throughput in 2014-15171 when total trade through Gladstone was 99.29 million
tonnes.
In 2014-2015 coal, bauxite, alumina, petroleum products and cement products represented
the largest throughput volumes:
-       coal – 68,564,790 tonnes (export)
-       bauxite – 17,128,958 tonnes (import)
-       alumina – 5,641,425 tonnes (export)
-       petroleum products – 1,511,579 tonnes (import)
-       cement products – 1,697,551 tonnes (export).
All other products are handled in volumes of less than 1Mt. However, as the identified Liquid
Natural Gas (LNG) export facilities come online LNG exports will become a significant
commodity with up to 25mtpa.

171
      Gladstone Ports Corporation Annual Report 2014/15.

                                                                                                                            168
AECOM Gladstone Port Master Planned Area
Evidence Base Report for the Proposed Gladstone Port Master Planned Area
10.2.1 Exports
Table 41 illustrates time series data for export activity over the six financial years from
2008/09 to 2013/14. Grain includes wheat, chick peas and sorghum. Some other minor
and/or intermittent products were exported e.g. burner fuel oil. The total volume of exports for
the Port of Gladstone has averaged around 64mtpa. The leap in coal exports in 2013/14 of
about 10mtpa substantially lifted exports for that year.
169AECOM Gladstone Port Master Planned Area
Evidence Base Report for the Proposed Gladstone Port Master Planned Area
Table 41 Port of Gladstone Export activity by product from 2008-09 to 2013-14 (tonnes pa)
Financial year 2008-09 2009-10 2010-11 2011-12 2012-13 2013-2014
Alumina 4,094,263 4,214,205 3,794,339 3,909,386 4,891,708 5,082,561
Aluminium 368,535 322,675 334,661 373,726 334,883 385,448
Ammonium nitrate 0 0 2,000 0 0 0
Bunker coal 182,305 161,385 162,282 102,411 6,631 0
Calcite 113,778 136,820 103,794 137,477 141,078 136,973
Caustic soda 0 43,582 75,533 57,986 25,898 13,016
Cement/clinker 1,131,896 1,278,273 1,197,842 1,185,476 1,101,711 1,238,573
Coal - Barney Point 3,803,285 4,787,636 3,956,642 4,115,675 2,934,912 4,642,069
Coal- RG Tanna 52,396,680 55,602,406 49,232,706 55,638,013 54,378,793 64,980,430
Containers 9,303 237 3,929 37,905 69,704 85,719
Cotton seed 0 14,128 0 0 0 0
Electrofused 0 6,576 6,095 19,485 11,684 8,019
magnesia
Fly ash 99,443 98,021 129,945 153,309 139,045 125,755
General cargo 36,934 5,053 10,688 27,369 42,044 20,800
Grain 446,449 240,762 260,218 338,245 386,879 149,387
Ilmenite 6,100 0 0 0 46,357 0
Limestone 44,540 22,321 29,301 39,119 28,527 45,694
Magnesia 46,628 57,000 84,670 70,240 58,412 53,732
Military eq./Vehicles 2,130 5,011 0 0 0 0
Scrap metal 22,345 32,229 49,310 38 44,685 74,454
Total exports 62,804,614 67,028,320 59,433,955 66,243,652 64,642,951 77,042,630
172
Source: TMR Trade Statistics for Queensland Ports For the five years ending 30 June 2014
172
Department of Transport and Mains Roads, (DTMR), April 2013, Trade Statistics for Queensland Ports, For the 5 years
ending 30 June 2013
170AECOM Gladstone Port Master Planned Area
Evidence Base Report for the Proposed Gladstone Port Master Planned Area
Export coal dominates the volumes accounting for about 90 per cent of the total in most
years (Table 42). The leading three commodities alumina, cement/clinker and coal account
for about 98 per cent of the total tonnage (Table 43). Gladstone is one of the highest volume
coal ports in the world. The high volume of coal in some ways overshadows significant
volumes of other products such as grain or aluminium which have an annual average of over
300,000 tonnes per year.
Table 42 Leading Commodities Export Activity - Proportions from 2008-09 to 2013-14
Financial year 2008-09 2009-10 2010-11 2011-12 2012-13 2013-14
Alumina 7% 6% 6% 6% 7% 7%
Cement/clinker 2% 2% 2% 2% 2% 2%
Coal 89% 90% 90% 90% 89% 90%
All other 2% 2% 2% 2% 2% 1%
Total 100% 100% 100% 100% 100% 100%
The main commodities exported can be classified into three groups:
- coal and mining products
- agricultural produce – grains, lupins, seeds
- manufactured products – cement, alumina.
This reflects the focus of the regional economy. Gladstone is one of the few Queensland
cities with a significant secondary industry presence. Combined with its role as a major
regional port, Gladstone has a more diverse economic base than many other Queensland
coastal centres which are single sector (e.g. sugar) or only one or two sectors (e.g. sugar
and tourism).
Coal
Export coal is easily the biggest commodity handled by the port of Gladstone. Most is
handled through the RG Tanna Coal Terminal (RGTCT) with a lesser amount through Barney
Point Terminal (BPT). The new Wiggins Island Coal Terminal (WICT) will play a significant
role in the future having exported its first shipment in May 2015. Stage one of WICT provides
an additional coal handling capacity of 27mtpa173.
Coal exports have shown consistent growth over the past 19 years, tripling from 1995 to
2014 with some minor fluctuations reflecting market variations (Figure 31). Except for 2010-
2011 when there was catastrophic flooding at some coal mines, the port has consistently
handled between about 53 and 59 mtpa in recent years (Table 41 and Figure 31). In 2013-
14 there was a significant jump in volume to just under 70 million tonnes. While both
metallurgical (coking) coal and thermal coal is exported from Gladstone, 75 per cent of total
coal export is metallurgical and 25 per cent is thermal coal. The majority of coking coal is
173
Wiggins Island Coal Terminal Environmental Impact Statement 2011
171AECOM Gladstone Port Master Planned Area
Evidence Base Report for the Proposed Gladstone Port Master Planned Area
exported to Japan, South Korea, Taiwan, India, Italy and France for high quality steel
manufacturing. Thermal coal is exported to Japan, Hong Kong, Taiwan, South Korea and
Israel for power generation.
Figure 31 Coal Exports 1995 – 2014
Alumina
Alumina is produced at Queensland Alumina Limited’s (QAL) 3.95mtpa rated refinery south
east of Gladstone and at the Rio Tinto Alcan Yarwun refinery which is rated at 3.4mtpa. The
bauxite feedstock is shipped in from Weipa in the Gulf of Carpentaria via South Trees (for
QAL) and Fisherman’s Landing (for Rio Tinto Alcan). The processed material is then
exported or consumed locally and converted to aluminium at Boyne Smelters Limited at
Boyne Island. In the long term export volumes have been stable averaging about 4.2mtpa
(Table 41). However there was substantial growth from 2012/13 and 2013/14 when over
5mpta was exported.
Alumina exports have grown steadily over the past 19 years, doubling from 1995 to 2013
(Figure 32). The two significant growth periods in 2005 and 2012 coincided with the
commencement of operations in stage 1 and stage 2 of Rio Tinto’s Yarwun Alumina Refinery
(RTYAR). Growth within process industries such as alumina refining tend to be lumpy in
nature, coinciding with operational expansions of facilities.
172AECOM Gladstone Port Master Planned Area
Evidence Base Report for the Proposed Gladstone Port Master Planned Area
Figure 32 Aluminia and Bauxite Trade
Cement/clinker
There has been considerable rationalisation of cement manufacturing in Australia over the
last 20 years with many plants now closed and supply concentrated into a small number of
very large plants. The Cement Australia facility at Gladstone is now Australia’s largest with a
1.7mtpa capacity. The plant supplies the silo at the Port of Townsville by sea. Smaller
markets e.g. Rockhampton and Mackay are supplied by a mix of road and rail. Shipments of
cement/clinker and flyash are currently approaching 1.4mtpa (Table 43). Cement and clinker
exports combined increased significantly at the end of the 1990’s and again in the mid 2000’s
only to have declined slightly over the past seven years (Figure 33).
Figure 33 Cement, clinker and petroleum products
Liquefied Natural Gas
There has been extensive investment in LNG export facilities at the Port on Curtis Island.
Three LNG export facilities are under construction in Gladstone, two of which have
173AECOM Gladstone Port Master Planned Area
Evidence Base Report for the Proposed Gladstone Port Master Planned Area
commenced exports (QCLNG December 2014 and GLNG September 2015). It is expected
that LNG exports will represent a major commodity for the Port. Initially, the three LNG
facilities will have a combined export capacity of 25mtpa with an ultimate volume of LNG
export estimated to be 40mtpa174.
10.2.2 Imports
Table 43 shows six years of time series data for the majority of import activity from 2008/09
to 2013/14175&176. Bauxite dominates the volumes accounting for about 80 per cent of the
total in the sample years. Similar to the leading three export commodities accounting for
about 98 per cent of the total tonnage, the three leading imports (bauxite, caustic soda and
petroleum) account for 94 per cent of the total (Table 44). Minor and/or intermittent imports
not included in Table 43 or Table 44 include LP gas, gypsum, copper slag etc.
The imports strongly reflect the industrial focus of the city. Bauxite is a key input for the two
alumina refineries and caustic soda is crucial in the Bayer process of alumina production.
The combined output of the two Gladstone alumina plants is amongst the largest alumina
production in the world. Another import which is crucial to alumina/aluminium production is
petroleum coke which is also one of the major commodities imported averaging 210,000tpa.
Petroleum is a key input into the mining sector as is magnetite.
Table 43 Import Activity 2008-09 to 2013-14 (tonnes pa)
Import tonnes 2008-09 2009-10 2010-11 2011-12 2012-13 2013-14
Bauxite 13,106,900 13,195,900 13,549,380 13,671,250 16,321,662 16,610,286
Bunker coal 0 0 64,885 0 0 0
Caustic soda 1,481,785 1,440,717 1,500,702 1,687,585 1,889,707 1,854,233
Cement gypsum 44,320 34,069 59,161 49,231 75,622 57,745
Containers 316 0 317 1,635 3,837 3,910
Fuel oil bunker 162,798 175,432 171,510 158,043 0 156,752
General cargo 76,690 35,661 142,825 246,527 419,722 176,914
Liquefied petroleum gas 11,151 11,801 10,390 12,027 11,518 8,598
Liquid ammonia 233,864 263,354 244,940 273,827 233,071 255,250
174
QGC 2015, www.qgc.com.au, Santos GLNG 2015, www.santosglng.com, APLNG 2015, www.aplng.com.au
175
Trade Statistics for Queensland Ports – for the five years ending 30 June 2013
176
Trade Statistics for Queensland Ports – for the five years ending 30 June 2014
174AECOM Gladstone Port Master Planned Area
Evidence Base Report for the Proposed Gladstone Port Master Planned Area
Import tonnes 2008-09 2009-10 2010-11 2011-12 2012-13 2013-14
Liquid pitch 45,528 45,572 47,786 50,603 43,088 49,831
Magnetite 74,382 84,270 74,638 82,151 98,312 127,590
Military Vehicles 2,167 3,396 0 0 0 0
Petroleum coke 209,439 203,603 217,971 203,369 207,949 216,629
Petroleum product 881,405 843,576 830,432 1,048,074 1,292,214 1,028,389
Scrap metal 8,695 0 0 0 0 0
Sulphuric acid 0 0 55,793 61,619 54,107 40,409
Total imports 16,341,644 16,337,351 16,970,730 17,545,941 20,650,809 20,586,536
Table 44 Major Commodities Import Activity - Proportions from 2008-09 to 2013-14
2008-09 2009-10 2010-11 2011-12 2012-13 2013-14
Bauxite 81% 81% 80% 78% 79% 81%
Caustic soda 9% 9% 9% 10% 9% 9%
Petroleum product 5% 5% 5% 6% 6% 5%
General cargo 0% 0% 1% 1% 2% 1%
Liquid ammonia 1% 2% 1% 2% 1% 1%
Petroleum coke 1% 1% 1% 1% 1% 1%
All Other 3% 2% 3% 2% 2% 2%
Total 100% 100% 100% 100% 100% 100%
Bauxite
The six year Bauxite import average was just over 14mtpa showing substantially higher
exports in 2012/13 and 2013/14 at over 16mtpa (Table 43). Bauxite imports have grown
steadily over the past 19 years, doubling from 1995 to 2013 (Figure 32). Output levels of
alumina and the finished aluminium product is broadly in line with the amount of bauxite
imported.
Petroleum Product
Petroleum is imported through Auckland Point Berth 3. BP and Shell are co-located as are
Mobil and Caltex terminals. Petroleum product imports have grown steadily over the past 19
years, more than doubling from 1995 to 2013 (Figure 33).
175AECOM Gladstone Port Master Planned Area
Evidence Base Report for the Proposed Gladstone Port Master Planned Area
10.2.3 Vessel Statistics
A detailed summary of vessel statistics for five years from 2009/10 to 2013/14 is provided in
Table 45. This data indicates that the number of vessels increased by approximately 12 per
cent between 2009-10 and 2013-14. Whilst the number of vessels within the 50,000 –
100,000 deadweight tonnage (DWT) category decreased over the five year period, there has
been a significant increase in the number of vessels greater than 180,000 DWT (rising from
30 vessels in 2009-10 to 102 vessels in 2013-14). This has also translated to a marked
increase in the number of vessels with drafts greater than 15m operating within the port
(increasing from 147 vessels in 2009-10 to 261 vessels in 2013-14.
Similarly the number of vessels greater than 230m in length increased 34 per cent over the
five year period. The increase in the number of largest vessels corresponds with the
increase in coal throughput at the Port of Gladstone over the same period.
177 178
Table 45 Vessel statistics
Financial Year 2009-2010 2010-2011 2011-2012 2012-2013 2013-2014
By Deadweight tonnage (DWT)
>180,000 30 34 54 60 102
100,000- 145 171 200 217 199
180,000
50,000-100,000 791 669 655 625 715
>50,000 466 471 543 609 585
Total Vessels 1432 1345 1452 1511 1601
By Length (m)
230 400 388 453 550 536
Total Vessels 1432 1345 1452 1511 1601
By Draft (m)
>15.00 147 158 200 221 261
177
Department of Transport and Main Roads 2014, Trade Statistics for Queensland Ports for the five years ending 30 June
2014
178
Department of Transport and Main Roads 2014, Trade Statistics for Queensland Ports for the five years ending 30 June
2012
176AECOM Gladstone Port Master Planned Area
Evidence Base Report for the Proposed Gladstone Port Master Planned Area
Financial Year 2009-2010 2010-2011 2011-2012 2012-2013 2013-2014
13.00-15.00 339 249 280 232 316
11.00-13.00 260 244 209 181 165AECOM Gladstone Port Master Planned Area
Evidence Base Report for the Proposed Gladstone Port Master Planned Area
- a regional service centre for the surrounding areas such as Calliope, Dawson and
Callide Valleys.
A future local economic driver is that of cruise ship stop-overs at the port which has the
potential to create economic flow on benefits for the Gladstone tourist industry. P&O Cruises
has announced that a new Southern Barrier Reef discovery cruise will commence in March
2016 which will include a stop-over in Gladstone.
Labour and Workforce Trends
Table 46 summarises June 2015 workforce data. It shows unemployment in the region 1.6
per cent below the Queensland average and despite the recent downturn in coal, which
impacts on the three LGAs, the June 2015 data reflects how strongly the local economies
continue to perform.
Table 46 Estimated Unemployment and Labour Force (June quarter 2015)180
Unemployed Labour force Unemployment rate
Number %
Banana 328 8,315 3.9
Central Highlands 823 18,593 4.4
Gladstone 1,944 35,879 5.4
Subtotal 3,095 62,787 4.9
Queensland 162,154 2,494,162 6.5
10.4 Potential growth in current export commodities
This section provides information regarding the potential growth of existing major
commodities exported through the Port of Gladstone.
10.4.1 Coal
Product sources of supply
A port’s catchment area typically corresponds to the area that can be served on a lowest cost
basis by the port. Distance and connectivity to the hinterland define the boundaries of the
catchment. The Port of Gladstone catchment area comprises areas from two major coal
basins (the southern and central parts of the Bowen basin and the northern parts of the Surat
basin), as well as two smaller basins (the Callide and Mulgildie basins) and is serviced by the
Moura and Blackwater rail systems. The other small basin in the catchment is Maryborough
180
Australian Government Department of Employment, Small Area Labour Markets Australia, various editions and Queensland
Treasury and Trade estimates.
178AECOM Gladstone Port Master Planned Area
Evidence Base Report for the Proposed Gladstone Port Master Planned Area
which is serviced by Queensland Rail's North Coast Line. Currently 17 mines export through
the Port of Gladstone181.
As mines in the catchment area for Gladstone fall largely within the Bowen basin, and the
Bowen basin has largely metallurgical coals, about 75 per cent of total coal exported through
Gladstone is metallurgical coal.
Conversely, thermal coal exports volumes are proportionately much less than metallurgical
coal, accounting for only around 25 per cent of total coal exports through Gladstone. Thermal
coal is mainly consumed in power generation and metallurgical coal is used for making steel.
International and National Macroeconomic effects
Global demand for energy and steel product are major drivers of the proposed Galilee Basin
mines north-west of Gladstone.
There are many competitors in the international coal market including Brazil, Indonesia,
South Africa, USA and potential new comers such as Mongolia. Russia, China and India all
have major domestic reserves which have the potential to displace Australian sourced
supplies. However, in the case of China, it is the difficulty and complexity of supply chains
competing with efficient seaborn material from Australia. In India there is a very complex
legal situation and government policy which favours preserving strategic domestic materials
and direct importation.
Product demand/substitutes
Changing consumption patterns in favour of less polluting energy sources, and a reduction in
energy-intensity in heavy industry will also have a downside effect on growing demand for
coal over the longer term. Although coal continues to be the favoured fuel supply option due
to its cost competitiveness, public pressure is mounting in various countries to strike a
balance between generation economics and environmental protection. LNG and other gases
have already been identified as potential fuel substitutes. Nuclear and alternative energies
are also active in the main markets in which Gladstone export coal competes.
Thermal coal demand in the Pacific basin is forecast to remain strong over the next twenty
years. Higher economic growth, strong rates of electricity generation growth stimulated by an
emphasis on electrification, industrialisation and infrastructure build, coupled with a lack of
suitable alternative, abundant, and competitively priced fuel sources, will create a growing
need for seaborne coal. Global thermal markets are currently facing extraordinary
challenges and uncertainties driven by weakening global economic growth, substantial
overhang in mine and export capacity, low oil prices, volatile currencies in key supplier
countries, and ever-tightening environmental policies182. However, over the longer term,
continued growth in demand for energy worldwide, will provide a platform for the continuation
of strong demand for thermal coal over the next several decades.
China and India will be the engines of thermal coal demand as they develop additional coal-
fired capacity of 841GW and 285GW respectively between 2014 and 2035. At the same
181
Wood Mackenzie for the Queensland Treasury Corporation 2015, Draft - unpublished
182
Wood Mackenzie for the Queensland Treasury Corporation 2015, Draft - unpublished
179AECOM Gladstone Port Master Planned Area
Evidence Base Report for the Proposed Gladstone Port Master Planned Area
time, Japan, South Korea and Taiwan will remain large consumers of thermal coal. Global
seaborne thermal coal imports are forecast to increase from 936Mt in 2014 to 1,860Mt by
2035. China’s demand for Australia’s high energy coal is expected to increase slowly
through 2026 followed by a faster rate of increase through 2033 driven by Indian demand.
Metallurgical coal which is used for making steel is a much smaller and more specific market
with arguably a less predictable long term trend. The easy recyclability of steel, apparently
endless availability of low cost scrap feedstock and low cost Electric Arc Furnace (EAF)
plants contribute to the large demand. Demand for metallurgical coal is predicted to remain
positive in the long term from countries such as China and India.
Wood Mackenzie (unpublished) forecast that the expansion of Chinese steel and hot metal
production as well as India’s urbanisation will drive strong demand for hot metal, coke and
coking coal in these countries. In the long term, growth in metallurgical coal demand will be
largely driven by the increase in steel demand in the rapidly industrialising and urbanising
development economies of Asia, most of which lack sufficient domestic reserves of
metallurgical coal to satisfy their steel production needs. Therefore, global demand
for/supply of metallurgical coal from countries such as Australia will continue to expand
through to 2035 from approximately 280Mt in 2014 to 410 Mt in 2035.
Local factors
While 17 mines currently export through Gladstone, a further 23 projects are forecast to ship
through the port by 2065. Coal export volumes through Gladstone are expected to grow
strongly over the short to medium term out to 2020/21. To accommodate this growth,
construction of Stage one of the Wiggins Island Coal Terminal commenced in 2011. Stage
one of the project will deliver an additional coal handling capacity at Gladstone of 27mtpa.
The first coal export from the new terminal occurred in May 2015. Future stages of the
Wiggins Island Coal Terminal will see up to 84 mtpa of coal export capacity.183.
Existing mines in the Bowen and Callide basins have a total of 1,766Mt of export marketable
reserves for export through the Port of Gladstone. A further 23 potential projects earmarked
for export through the Port of Gladstone have marketable reserves totalling 2,485Mt.
Coal throughput at the Port of Gladstone is forecast to increase by 60Mt from 72Mt in 2015 to
a peak of 132Mt by 2030. While some mines and projects will start to decline from 2031,
Wood Mackenzie estimates there will be additional supply to offset this decline. Further
expansion potential beyond 2035 will depend upon development of greenfield projects that
have been delayed due to low coal prices.
Outlook
The majority of Australian thermal coal export growth is forecast to occur in Queensland with
thermal exports expected to reach 184Mt by 2027. Subsequent to the development of the
Galilee and Surat Basin, Queensland could provide approximately 75 per cent of Australia’s
thermal coal exports by 2035.
183
Wiggins Island Coal Terminal Supplementary EIS
180AECOM Gladstone Port Master Planned Area
Evidence Base Report for the Proposed Gladstone Port Master Planned Area
Supply of metallurgical coal is concentrated between Australia, the USA, Canada and
Russia, currently accounting for 87 per cent of the seaborne market. Australia accounts for
over half of the global supply.
The outlook for coal exports through the Port of Gladstone is favourable but potentially
improved with the Surat Basin and WICT being fully developed. The demand for coal is
growing and the high quality of the Gladstone product combined with efficient and economic
logistics chains, provides a strong defence of the existing status quo with a solid platform for
future growth. The majority of Galilee Basin coal seems to be destined to be exported via
Abbott Point due to proximity, with a smaller volume potentially exported through Gladstone.
10.4.2 Export Grain and Broad acre Crops
Grains include sorghum, chick peas, and wheat and broad acre crops include lupins, pulses,
oilseeds, cotton fibre and seed.
Product sources of supply
Biloela and Emerald areas currently export through the Port of Gladstone and are part of the
Fitzroy region for which data is available. Around 20 per cent of Queensland wheat is grown
in the Fitzroy region. Approximately 164,000ha in the Fitzroy region is planted with wheat
compared to 52,000ha of chickpeas. Chickpea exports have grown marginally due to wheat
growers gaining better wheat crops when rotated with chickpeas184.
Due to the fact that wheat is a winter crop, farmers of the Fitzroy region also often produce
sorghum during the summer which is interchanged by cotton farmers around the Emerald
region when the price of cotton is not sufficient. Because of this flexibility, Queensland is the
largest producer of sorghum nationwide. Sorghum is mostly used as a feed grain for
livestock, and any excess that is not consumed locally is exported185. Sixty-five percent of
Australia’s sorghum is produced in Queensland with 20 per cent grown in the Fitzroy region
which is serviced by the Port of Gladstone.
International and National Macroeconomic effects
People in the Asian boom economies are increasingly adopting western influenced lifestyles
and dietary patterns away from the traditional rice and mainly vegetable/fish diet, at least on
a minimum scale. The rate of consumption seems related to increased wealth, and the
associated western accoutrements. This provides favourable market conditions for the
future particularly if the product quality is good and reputation is important in the market.
More countries than ever are attempting to join this market and the existence of multinational
commodities traders and logistics companies complicate matters. For example it may be
possible to substitute Australian grain with Russian or Argentinian grain.
Gladstone wheat is currently exported to Fiji, Vietnam, Malaysia and New Zealand. Sorghum
is currently traded to New Zealand and China and the bulk of chick peas were exported to
India and Bangladesh in 2013/14186.
184
BIS Shrapnel 2015 for Gladstone Ports Corporation – Non-Commodity Trade – Due Diligence Report – Draft - Unpublished
185
BIS Shrapnel 2015 for Gladstone Ports Corporation – Non-Commodity Trade – Due Diligence Report – Draft - Unpublished
186
BIS Shrapnel 2015 for Gladstone Ports Corporation – Non-Commodity Trade – Due Diligence Report – Draft - Unpublished
181AECOM Gladstone Port Master Planned Area
Evidence Base Report for the Proposed Gladstone Port Master Planned Area
From a national perspective Australia only exports the grain surplus to local consumption. In
some cases such as small crops and rapidly escalating local demand for grain not only for
human consumption but more recently in commercial uses e.g. production of industrial
starches and esters, there may be nothing to export. Potential bio-fuel use will also consume
local production. In central Queensland the growth of feedlots has taken a considerable
amount of the formerly exported grain out of the system.
Product demand/substitutes
Grain exports through Gladstone in 2013/14 was 33kt of wheat, 71kt of sorghum and 46kt of
chick peas. Both Sorghum and chick peas exports were down significantly from 2012/13.
There has been significant growth in recent years for containerised grain. Increasingly
customers are Asian based and have container handling capacity at ports but many do not
have food-grade bulk handling equipment, contamination - free secure storage and the
associated logistics chains to support bulk movements. These latter movements are the
traditional trades for Gladstone.
Containerisation represents a significant challenge to Gladstone which relates to the whole
logistics chain part of which is beyond the control of the Gladstone port. In 2014, AECOM
noted187 there were 10ktpa of cottonseed and cotton fibre exported from the Central
highlands via Brisbane in containers and approximately 20kt of containerised grains, lupins
etc. from the Central highlands were exported through Brisbane. Structural changes in
marketing and distribution of grain have led to a relative decline in the importance of the
traditional silo based handling system giving the option of alternative supply chains. On-farm
storage in containers is one means to bypass the silo system and use trucks to port for
export. There may be an opportunity to expand export of containerised grains through
Gladstone.
Local factors
There have been significant changes in the industry with a rise of local and regional feed-
lotting since the 2000’s which is consuming locally produced grain, particularly sorghum
which traditionally has been exported through Gladstone. There is therefore a potentially
smaller pool to draw from. The industry is still very volatile due to changes in climate and
particularly water supply. There does not seem to be a way to reduce this volatility in the
long term on a year by year basis. There has also been a shift away from traditional grains in
favour of lupins and pulses, especially crops such as chickpeas. Based on the existing
logistics chain, exports through the port of Gladstone are based on the traditional bulk supply
by rail direct from inland silos.
Outlook
It is forecast that chick pea area planted will increase by two per cent per annum, sorghum
yields will grow by 1.6 per cent per annum and wheat exports are likely to remain constant188.
The outlook of grain production will depend on several factors including growing conditions. It
is however, expected that prices and production volumes through Gladstone are projected to
187
AECOM 2014a, Central Queensland Transport Supply Chain Study.
188
BIS Shrapnel 2015 for Gladstone Ports Corporation – Non-Commodity Trade – Due Diligence Report – Draft - Unpublished
182AECOM Gladstone Port Master Planned Area
Evidence Base Report for the Proposed Gladstone Port Master Planned Area
remain steady (wheat) with slow steady increases of chick peas and sorghum. The outlook
could be more favourable with an improved logistics chain.
10.4.3 Horticultural and Other Agriculture Products
Product sources of supply
Central Queensland has a valuable agricultural sector primarily comprised of beef and cereal
grains production, irrigated cropping including cotton, horticulture, forestry and commercial
fishing (Central Queensland – Economic and Infrastructure Framework, 2013). The region’s
growing horticulture industry supplies a significant proportion of Queensland’s tomatoes,
capsicum, green beans and sweet corn, as well as high-quality mangoes189.
Statistics for locally produced products are indistinguishable in the market. Meat products
are produced throughout Queensland and the horticultural products are produced from the
Atherton Tableland and coastal areas south to the NSW border. However, there are three
abattoirs located in Central Queensland. JBS Australia in Rockhampton which has a daily
processing capacity of 676 head of beef; Teys Australia in Rockhampton which has a daily
processing capacity of 1,731 head of beef; and Teys Australia in Biloela which has a daily
processing capacity of 703 head of beef.
The Central Queensland region had a total of 3,642 agricultural businesses in June 2011, of
which beef cattle farming accounted for 2,634 businesses or 72 per cent of the total number
of agricultural businesses in the region.
International and National Macroeconomic effects
The real cost of freight has declined to the point where even low value commodities can be
transported to distant markets. In this global economy out of season products can be
obtained freely from other parts of the world.
Increasing affluence combined with western media penetration is changing tastes and
demands in many traditional societies in Asia, Africa and Eastern Europe. Foreign products
are seen as better, more prestigious and more desirable and this attitude is becoming
entrenched.
There is a growing movement which promotes a “consume local not global” to reduce
transport greenhouse gas emissions and carbon footprint. It is debatable whether this can
reduce the consumer demand for anything at any time anywhere.
Australian agri-marketers have been as active in foreign countries promoting Australian
produce just as hard as competitors from other countries are. This is encouraged and
supported by all levels of government, growers and supply chain providers.
Product demand/substitutes
Central Queensland is a major producer of:
- beef via two abattoirs in Rockhampton and one in Biloela
189
GHD 2014, Economic Development Queensland Regional Queensland Industrial Land Supply Study, Central Queensland
Region.
183AECOM Gladstone Port Master Planned Area
Evidence Base Report for the Proposed Gladstone Port Master Planned Area
- pineapples and tropical fruit in the coastal strip particularly from Yeppoon to Yarwun.
Very little of this is exported through Gladstone. The meat is sold in the domestic
(Queensland and southern) markets or containerised and exported via the port of Brisbane.
The tropical fruit is sold in Brisbane and southern markets. Most of this material is easily
containerised but at the moment Gladstone is not well equipped to handle this or other
refrigerated cargo in the same way Brisbane can. However, there are two shore harbour
cranes now available at Auckland Point and many handy size gear vessels which could
address this issue.
Local factors
According to GHD190: The profitability of the industry is being strongly driven across the
agribusiness supply chain through adoption of the latest technology and better responding to
national and international markets (Central Queensland – Economic and Infrastructure
Framework, 2013).
Outlook
As noted earlier, it is supply chains rather than ports which compete with each other and
unless Gladstone can attract greater frequency of container ship calls, it will be difficult to
capture the containerised grain business from Brisbane. However on the flip side, ships will
not call unless there is a container exchange sufficient to justify the cost of a day’s shipping
time lost, along with extra port costs. The future potential for the shipment of agricultural
products is dependent on the nature of the market being served. Containers bound for South
East Asia can be accommodated on feeder lot services whereas trade to the West Coast of
America and further afield require liner services to optimise the transit times. The number of
container exchanges has a major influence on the desirability for a port of call.
10.4.4 Alumina and Aluminium
Product sources of supply
Located within the Port of Gladstone catchment area are the Rio Tinto Alcan (RTA) and
Queensland Alumina Limited (QAL) alumina refineries and the Boyne Island aluminium
smelter (Pacific Aluminium). Both refineries are dependent on imported bauxite shipped from
Rio Tinto’s Weipa mine in north Queensland. Bauxite is a relatively common element and
mined in many countries. Current bauxite supplies in Weipa are expected to deplete in 10-15
years; however, further development is proposed to the south of Weipa with bauxite
production expected to reach 50 mtpa191. The goods logistics chain to Gladstone with deep
water ports, good supply of electricity, workforce and other resources ensure it has a
competitive edge. The two refineries in Gladstone produce a reliable supply of alumina
which is used locally at Boyne Island and exported.
190
GHD 2014, Economic Development Queensland Regional Queensland Industrial Land Supply Study, Central Queensland
Region.
191
Rio Tinto Alcan 2011, South of Embley Environmental Impact Statement,
http://www.riotintoalcan.com/ENG/ourproducts/1818_environmental_impact_statement.asp.
184AECOM Gladstone Port Master Planned Area
Evidence Base Report for the Proposed Gladstone Port Master Planned Area
RTA started production of alumina in 2004 (capacity of 1.2mtpa) and upon completion of an
expansion by 2018 plant capacity is anticipated to be 3.5mtpa. QAL started in 1967 with a
capacity of 2,740ktpa, however expansions have led to a current plant capacity of 3.3mtpa192.
Pacific Aluminium is Australia’s largest aluminium smelter with a capacity of 570ktpa. The
smelter utilises alumina from QAL to produce aluminium, some of which is consumed
domestically, however the majority of aluminium is exported through the Port of Gladstone.
International and National Macroeconomic effects
Aluminium is a highly traded metal in much demand around the world. Increasing incomes
allow people to trade up in terms of housing and transportation and this trend can be
observed around the world. This increasing wealth underwrites the future of construction and
manufacturing and therefore of the materials used in these processes such as aluminium.
Asia is the fastest growing aluminium consumption region with China accounting from nearly
80 per cent of Asian and 50 per cent of the world’s aluminium consumption in 2014.
Aluminium global capacity is forecast to grow from 59mtpa in 2013 and plateau at around
78mtpa in 2020 while demand growth continues. However, new global aluminium projects
waiting on price appreciation and to ensure capacity meets demand through to 2035.
Product demand/substitutes
Aluminium has been used in a wide variety of applications for many years. It offers a strong,
light-weight, non-rusting alternative to traditional material such as steel. As fuel becomes
more expensive and car manufacturers attempt to reduce mass to provide better performing
cars increased use of aluminium and alloys is expected. Away from industrial applications,
aluminium is widely used in the packaging industry and there are few substitutes with the
versatility of aluminium. For example, for food and beverage packing, few materials can
match the quality and durability of aluminium cans.
On the horizon there is the threat of new materials for specific applications. Most noteworthy
is the Boeing 787 Dreamliner which has substituted high tech composite materials where
formerly aluminium would have been used. Already the Airbus 350 (the B787’s direct
competitor) has adopted some composite features and all manufacturers are examining
weight saving options which could result in reduced demand for aluminium.
However, Wood Mackenzie expect global alumina demand to grow about six per cent per
annum to 2020 and thereafter 3.1 per cent per annum to 2035. Global demand is forecast to
increase from 133mtpa in 2013 to 158mtpa in 2020 which would result in an increase to
capacity utilisation from 79 per cent to 95 per cent. Further increases in utilisation up to 98
per cent by 2022 indicates there will be an urgent need for additional capacity in the short to
medium term.
Global aluminium demand is anticipated to grow by an average of 5.2 per cent over the
2013-2017 period driven by firm demand growth in emerging markets and by the increasing
penetration of aluminium in end-use sectors such as automotive, transportation and power.
Beyond 2017, global consumption growth is expected to gradually decelerate with an
average of 3.3 per cent growth per annum from 2013 to 2035.
192
Wood Mackenzie for the Queensland Treasury Corporation 2015, Draft - unpublished
185AECOM Gladstone Port Master Planned Area
Evidence Base Report for the Proposed Gladstone Port Master Planned Area
Local factors
The QAL alumina refinery has a life to at least 2041 and Yarwun has an expected life to
2052. Beyond these terms, significant capital investment would be required, however
increasing demand in Asia leads Woods Mackenzie (unpubl.) to believe both refineries will
still be operating in 2065. The RTA refinery employs modern technology and both refineries
are within the lowest half of the global alumina cost curve and favourably located to Asian
markets so both plants are competitive in world terms.
Alumina exports from the Port of Gladstone are forecast to increase from approximately
5mtpa in 2014 to approximately 6.4mtpa in 2019 where exports are predicted to remain until
2035.
There is the potential for RTA to undertake a Stage 3 expansion and for QAL to undertake a
possible 400ktpa brownfield expansion in favourable economic circumstances. In the long
term (out to 2050) the volume of alumina exported out of Gladstone is forecast to increase to
10mt as reported by GHD193 .
The Pacific Aluminium Smelter is expected to remain operational until at least 2060. Exports
are predicted to increase from approximately 364kt in 2013 to 371ktpa by 2016 where export
volumes will remain until 2035.
Outlook
The outlook for future alumina and aluminium exports through the Port of Gladstone is
favourable. The global industry’s aluminium utilisation rate could reach 90 per cent by 2021
and quickly surge to 95 per cent in 2024 reflecting a tightening of the capacity/demand
situation. Gladstone aluminium exports are forecast to increase approximately two per cent
by 2016 and remain stable until 2035. In conjunction, Pacific Aluminium has shown
considerable faith in the Boyne Island smelter with significant investment for future aluminium
production.
Similarly, Gladstone alumina exports are expected to increase approximately 28 per cent by
2019 and then remain relatively stable until 2035. QAL has invested in process
improvements and efficiency while RTA is in the process of doubling its capacity. The growth
in Alumina trade is unlikely to be linear and will more likely be reflected in block jumps as
new sites become operational.
10.4.5 LNG
Product sources of supply
Coal Seam Gas (CSG) and natural gas are found in many countries, but unless there is the
infrastructure and logistics chains in place to extract, process, store, transport and distribute
it, it will remain an untapped resource. In this aspect Gladstone is very well served by
pipeline connection to the Surat Basin and other potential sources. The construction of
processing plants, port infrastructure etc. at Gladstone gives it a significant advantage over
other sources of supply.
193
GHD 2014, Economic Development Queensland Regional Queensland Industrial Land Supply Study, Central Queensland
Region.
186AECOM Gladstone Port Master Planned Area
Evidence Base Report for the Proposed Gladstone Port Master Planned Area
The LNG facilities on Curtis Island in the Port of Gladstone are the world’s first dedicated
CSG to LNG supply projects i.e. Australia Pacific LNG (APLNG), Santos’ Gladstone LNG
(GLNG) and Queensland Curtis LNG (QCLNG).
Significant CSG reserves are located primarily in Queensland in the Surat and Bowen
basins. As the operators develop the gas reserves further and understand the performance
of the wells better, the true extent of the reserves can be determined with greater confidence.
Current estimates of gas-initially-in-place for the Bowen Basin and Surat Basin is 142 trillion
cubic feet (tcf) and 252 tcf respectively. The existing projects have agreements with credible
energy companies for a duration of 20 years.
Potential exists for additional gas resources in under-explored areas, such as tight gas and
shale gas however, technical issues create higher cost challenges if they were to compete
with other LNG projects globally.
International and National Macroeconomic effects
As noted above, the world has a growing appetite for energy and there are a number of fuels
which can support that. The ease of extraction, portability via pipelines, economical transport
and other factors have led to its relatively recent surge in popularity. In the USA a number of
coal fired power plants have been converted or replaced by gas. Currently there is a
seemingly inexhaustible demand in China for this cheap reliable fuel. Gas has other
important industrial applications in the production of chemicals, fertilisers and acids.
The demand for rapid industrialisation and economic growth particularly in Asia has resulted
in pollution and environmental concerns. The chief culprit is coal fired powerhouses and this
has created a demand for cleaner energy. New gas fired powerhouses provide a good
alternative to old technology based on inefficient processes using low grade coal. In the long
term the drive to transform economies ensures the future demand for the product and if
Gladstone can stay at the cutting edge, it will have a dominant presence.
The three LNG companies in Gladstone have significant long term supply agreements with
power generators and gas distributors e.g. in Japan and Korea. Another key buyer group are
national oil companies e.g. in Malaysia and China who look to resell the LNG to other buyers.
Product demand/substitutes
Gas has been used as fuel for many years but it is currently experiencing a surge in demand.
While there are substitute products e.g. coal, petrol, they do not provide a direct economical
alternative for a number of applications.
Local factors
LNG exports have commenced from two of the three Gladstone LNG facilities and are
expected to grow. The third facility is expected to commence exports by the end of 2015.
LNG outputs are expected to ramp up from 2015 and reach peak capacity in 2019. The
three facilities are expected to produce approximately their plant capacities (up to 25mtpa
combined) for 20 years. Extension of the life of the projects beyond 20 years is expected
given the significant infrastructure in place but will be subject to availability of reserves in
terms of volume, cost and location. Many other LNG projects world-wide have demonstrated
operational lives of 30 to 45 years.
187AECOM Gladstone Port Master Planned Area
Evidence Base Report for the Proposed Gladstone Port Master Planned Area
Wood Mackenzie194 believe that APLNG and QCLNG will expand by one train each around
2025. The Arrow LNG project is not expected to go ahead in its current format as a
greenfield development but could be developed as supply of gas or as part of an expansion
of one or more of the existing facilities.
Outlook
The contributions from the LNG projects are likely to extend out to the year 2050. In 2020/21,
it is estimated that the industry has capacity to export over 33 million tonnes of LNG through
Gladstone Port. Whilst final output will be influenced by market factors, this export volume is
estimated to be valued at over $13.6 billion (undiscounted).
10.4.6 Cement
Product sources of supply
All cement clinker and cement exported through the Port of Gladstone is produced by
Cement Australia’s plant at Fisherman’s Landing, which is Australia’s largest cement plant
and produces over 1.666mtpa of cement clinker. The plant produces clinker, most of which
is ground into cement at the site, and a range of other products including flyash and lime.
Limestone for the production of cement clinker is sourced from the East End mine (24 km
from Gladstone)195.
International and National Macroeconomic effects
The range of products includes relatively crude semi processed materials to fully
manufactured finished goods in the case of cement.
Extensive infrastructure damage resulting from floods has necessitated a larger infrastructure
rehabilitation and restoration program since 2011. As some of these works finish, demand
will inevitably decline however the potential development of the Galilee Basin mines will
result in high levels of demand during the construction phase, normally estimated at between
2-3 years, depending on the size and complexity of the mine. Apart from the mines there is
significant civil infrastructure e.g. upgraded or new rail lines and roads to service the industry,
housing and amenities for the workforce.
Cement is critical to all sectors in the economy ranging from consumption in domestic
housing applications to commercial retail centres, from civil infrastructure to public and
private works.
Product demand/substitutes
It is difficult to find a product which could be used as substitute for cement. Its future demand
remains positive. Sunstate Cement based in Brisbane is a competitor but has little presence
in the markets which are targeted by Cement Australia in Gladstone. Cement is freely traded
in international markets and it would be possible for foreign sourced material to be directly
imported through Townsville or Cairns (or Mackay) if there was demand which could
potentially displace material shipped out of Gladstone.
194
Wood Mackenzie for the Queensland Treasury Corporation 2015, Draft - unpublished
195
BIS Shrapnel 2015 for Gladstone Ports Corporation – Non-Commodity Trade – Due Diligence Report – Draft - Unpublished
188AECOM Gladstone Port Master Planned Area
Evidence Base Report for the Proposed Gladstone Port Master Planned Area
Cement clinker and cement produced at Fisherman’s Landing is either consumed in the
Gladstone area or is transported through Gladstone Port to other Cement Australia facilities
throughout Australia e.g. Bulwer Island grinding plant and Townsville and Cairns terminals
which lack their own mill facilities. No cement or clinker is currently exported overseas from
Gladstone.
Currently coal mining accounts for almost 80 per cent of local demand for cement. The
construction of the Galilee Basin mines and associated infrastructure will consume additional
material which might otherwise be directed from Gladstone to markets in North Queensland.
After the mine construction phase, it is normal for demand to decrease in line with the
operation/production phase.
Local factors
With growing populations and demand for expanded urban and industrial infrastructure, there
will be continued high demand potentially for decades. The Department of Transport and
Main Roads (TMR) has significant works planned in central Queensland and concrete is
integral to many of these projects. DSD is also examining infrastructure opportunities and
regional economic development throughout the region. Given that the Gladstone plant is
near capacity at present future expansion will be required to maintain shipments through the
port given the number pf potential new domestic regional customers. Otherwise as local
demand rises, there will be less surplus for shipping through the port.
The major generators/consumers are mining companies, private developers, consumers, and
civil infrastructure providers such as commonwealth, state and local government.
Outlook
The outlook is mixed. There is the potential for new coal mine development to increase local
demand and therefore decrease surplus exports. The possibility of direct imports into
Townsville from another source provides another significant threat to trade through
Gladstone. However, there is also the potential for historical circumstances that have
contributed to the recent closure of cement plants in the last five years to result in the plant
altering its production from producing clinker to grinding imported clinker which would
increase port imports.
10.5 Potential growth in current import commodities
Imports are dominated by two groups of products:
- bauxite and materials used in alumina/aluminium production
- petroleum and materials used in the mining, agricultural and transport sectors.
Only the major commodities are covered here in detail.
10.5.1 Bauxite
Product sources of supply
All bauxite utilised at Gladstone is currently sourced from Weipa with the mine being owned
by Rio Tinto Alcan which also owns the RTA at Yarwun in Gladstone and is part owner of
QAL in Gladstone. The deposit and adjoining sites in Weipa are extensive with current
reserves expected to deplete in 10-15 years. The only risks to supply are when significant
189AECOM Gladstone Port Master Planned Area
Evidence Base Report for the Proposed Gladstone Port Master Planned Area
climatic events such as cyclones disrupt shipping patterns or damage equipment at ports or
plants.
International and National Macroeconomic effects
Over 85 per cent of bauxite mined globally is converted to alumina for the production of
aluminium metal. An additional 10 per cent goes to non-metal uses in various forms of
specialty alumina and the remainder is used for non-metallurgical bauxite applications e.g.
commercial applications as abrasives and refractories196.
All bauxite used to produce alumina and aluminium in Australia is sourced from Australia.
Australia is the largest bauxite producer in the world with 74.9Mt produced in 2011. Bauxite
production in Australia is estimated to reach 82 million tonnes in 2014-15197. There are
currently five Australian bauxite mines providing feedstock for the seven alumina refineries,
which in turn supply alumina to the six Australian aluminium smelters and the export market.
The bauxite is generally exported from one port via coastal shipping to another Australian
port which results in a high volume of bauxite imports for Gladstone where two of Australia’s
five refineries are located.
From Gladstone’s perspective, it is trade in the finished product alumina or aluminium rather
than the raw product which is important. Thus the trends in the bauxite market tend to reflect
the dynamics on the downstream products and how they are in demand during periods of
economic boom or slowdown.
Product demand/substitutes
There are no other products from which alumina and therefore aluminium can be produced.
The expansion of Australian bauxite, alumina and aluminium production over the past few
years reflects high demand for the commodities and significant investments are being
undertaken in prospective projects. Along with well-developed production areas around
Weipa, Gove and the Darling Range, bauxite occurrences in Western Australia, Cape York in
Queensland and in central New South Wales and Queensland have maintained commercial
exploration and development interest198.
Local factors
GHD report a relatively favourable future for the Alumina/Aluminium production at
Gladstone199: The volume of bauxite, alumina and aluminium handled at Gladstone is
forecast to grow at a steady rate over the short to medium term and the long term. In the
short to medium term, the volume of bauxite produced in Weipa is forecast to increase from
23 million tonnes in 2011/12 to just over 38 million tonnes in 2020/21. This represents an
average annual increase of just over 7.1 per cent. The value of this production is forecast to
increase from $699 million in 2011/12 to just over $1.1 billion in 2020/21 (undiscounted)
196
Australian Buaxite Limited 2012, ASX announcements 29/06/12, 03/12/12, www.australianbauxite.com.au
197
IBIS World 2015, Bauxite Mining in Australia: Market Research Report,
http://www.ibisworld.com.au/industry/default.aspx?indid=66
198
Geosciences Australia 2010, Bauxite, www.ga.gov.au
199
GHD 2014, Economic Development Queensland Regional Queensland Industrial Land Supply Study, Central Queensland
Region.
190You can also read