JUST TRANSITION FOR REGIONS AND GENERATIONS - Experiences from structural change in the Ruhr area
←
→
Page content transcription
If your browser does not render page correctly, please read the page content below
JUST TRANSITION
FOR REGIONS
AND GENERATIONS
Experiences from structural change in the Ruhr area
ISBN 978-3-946211-21-1

JUST TRANSITION FOR REGIONS AND GENERATIONS
Experiences from structural change in the Ruhr area

Research study conducted on behalf of WWF Germany by

Imprint
Published by                         WWF Germany, Berlin
Date                                 January 2019
Authors                              Elke Dahlbeck, Dr. Stefan Gärtner (Institut für Arbeit und Technik)
Coordination                         Juliette de Grandpré ( WWF Germany)
Contact                              Juliette.degrandpre@wwf.de
Editor                               Thomas Köberich (WWF Germany)
Design                               Anna Risch (post@annarisch.de)

The European Climate Initiative (EUKI) is a project financing instrument by the German Federal Ministry for the Environment, Nature Conserva-
tion and Nuclear Safety (BMU). Its implementation is supported by the Deutsche Gesellschaft für Internationale Zusammenarbeit (GIZ) GmbH.
It is the overarching goal of the EUKI to foster climate cooperation within the European Union (EU) in order to mitigate greenhouse gas emissions.

The opinions put forward in this publication are the sole responsibility of the author and do not necessarily reflect the views of the Federal
Ministry for the Environment, Nature Conservation and Nuclear Safety.

© 2019 WWF Germany · No reprint of the report or extracts thereof without the publisher’s permission.
Foreword               Worldwide, it has become clear that
                        global warming is the greatest eco-
                        logical and social challenge of our
    time. Achieving the climate targets are part of a bigger
    scheme: a global transition in Germany and Europe
    towards a society that no longer relies on fossil fuels.

    This transition is the only possible response to the climate crisis, and in its
    magnitude and significance comparable to such major historical upheavals
    as industrialisation or digitalisation. Therefore, the question of justice
    inevitably arises in two respects: nothing is as unjust and unsocial as
    inconsistent climate protection. At the same time, the transition must be
    fair and socially balanced so that people can support and advance it.
    The so-called Just Transition is therefore becoming increasingly important.

    The trade unions have known this for a long time, as they have been
    trying for decades to prevent the negative effects of transformation pro-
    cesses on workers. However, just transition encompasses more than the
    employees of now obsolete branches of industry. It affects entire regions
    that for decades have supplied us with energy. Coal may no longer be
    viable, but the regions should stay so. A fair energy transition means
    achieving the climate targets set out in the Paris Agreement so that we
    can continue to live well in our regions in the future – and share this
    good life with as many people as possible.

    WWF Germany is devoting a new project to this very topic: Together with
    WWF in Bulgaria, Greece and Poland, the “Just Transition Eastern &
    Southern Europe” project was launched in 2017. It is part of the European
    Climate Initiative (EUKI) of the Federal Ministry for the Environment.
    The project focuses on developing strategies for structural change for
    South-West Bulgaria, West Macedonia in Greece and Silesia in Poland:
    away from coal and towards sustainable economic activities that benefit
    people and the climate.

    The unique thing about it: the strategies are developed together with
    relevant actors from the regions. People from politics, business, civil
    society and trade unions come together to find solutions for structural
    change that are both climate and socially compatible. In Germany,
    the Coal Commission is currently attempting to create a similar model.
    Its decision on how to phase out coal should be taken both from the
    point of view of climate and structural change.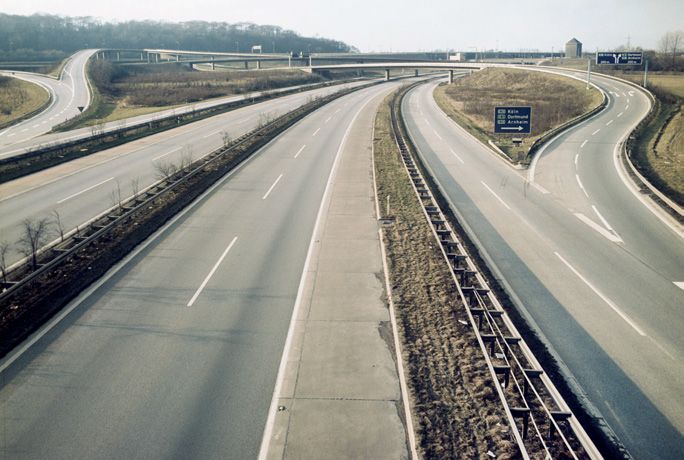
But developing plans is the first important step. What is needed then is
    binding commitment. This applies to the climate targets, so that they
    are not, as was recently the case in Germany, abandoned without conse-
    quence. And it applies to the necessary steps in structural change. This is
    crucial considering the long-term nature of these tasks. This is what
    the experience of structural change in the Ruhr area, to which this study
    is dedicated, teaches us. It also shows how important the participation
    of civil society is. On the following pages you can read which additional
    lessons from the Ruhr area could be relevant for other regions in Germany
    and Europe. With this study we want to contribute to the discussion:
    towards the common task of preserving our livelihoods.

    Jörg-Andreas Krüger
    Chief Conservation Officer, WWF Germany

4
Content
       Foreword                                                                       3
1      Introduction	                                                                  7
2      Economic change in Germany                                                     9
2.1    Structural change and structural rupture                                     12
2.2	Political intervention is necessary for balanced regional
     development16
2.3    Shaping change 	                                                             20
2.4    Structural policy is almost always too late                                  22
3      Structural change in Germany and the Ruhr area                               25
3.1    Development of coal production in Germany                                    25
3.2    Structural change in the Ruhr area                                           32
4      Structural policy in Germany                                                 38
4.1    Structural policy in the Ruhr area                                           38
4.1.1 Integrated structural policy (1966 –1974)                                     38
4.1.2 Centralised structural policy (1975 –1986)                                    40
4.1.3 Regionalised structural policy (1987–1999)                                    41
4.1.4 Field of competence oriented structural policy (ab 2000)                      43
4.1.5 Evaluation of structural policy measures in the Ruhr area                     44
4.2    Structural policy for the lignite mining districts in Germany                48
4.2.1 Lignite mining districts in Germany                                           48
4.2.2 The „Unternehmen Revier“ initiative                                           51
5      Recommendations and transferable solutions                                   54
6      References	                                                                  61
7      Annex                                                                        65

                                        Just transition for regions and generations   | 5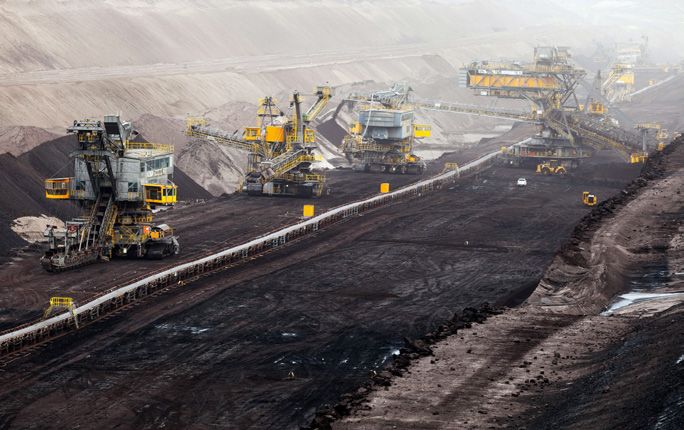
1Introduction                     “Structural change” is generally understood to
                                   mean a change in the structural composition of
                                   an aggregate (e.g. gross domestic product (GDP)
       or the workforce). From a sectoral point of view, it includes changes in
       the structure of industries, and from a regional perspective, shifts between
       individual regions in a larger economic area. Regional and sectoral
       structural change cannot be viewed independently from one another as
       industries are typically not evenly distributed across the regions. This
       applies especially to the lignite and hard coal regions in Germany and
       Europe, which are concentrated in specific regions, for example, for many
       years, in the Ruhr ar ea and Saarland or the four lignite mining districts
       of Rhineland, Helmstedt, Central Germany and Lusatia.

       The imminent phase-out of coal will bring structural changes to the
       regions affected. Depending on the social and political model, the State
       steps in to support the regions through structural policy interventions.
       However, structural policy cannot (and will not) prevent structural
       change, but can provide a framework. Regions must allow change.
       Structural policy interventions, however, which are also required under
       constitutional law in Germany, are not ineffective and meaningless –
       on the contrary!

       This study reviews Germany’s experiences with structural policy focusing
       on the Ruhr area (but also experiences from other regions) and identifies
       the structural policy developments and their positive and negative impacts.
       In addition to an analysis of relevant literature, quantitative analyses
       of secondary data were conducted. Building on these initial results, the
       most important effects of the structural policy measures were identified.
       Guideline-based interviews with decision-makers from the realms of
       politics, administration, business and trade unions were conducted to
       provide a further empirical foundation for the study findings. In addition,
       a dedicated group discussion was held with representatives from the
       political arena, environmental organisations and trade unions.

       To discuss transferability to other regions and countries, particular
       attention was also paid to the geographic conditions, historical context
       and structures. This is relevant in view of the fact that structural change
       is organised differently in large industrial centres with interconnected
       economic sectors than in industrial villages situated on the periphery.

                                             Just transition for regions and generations   | 7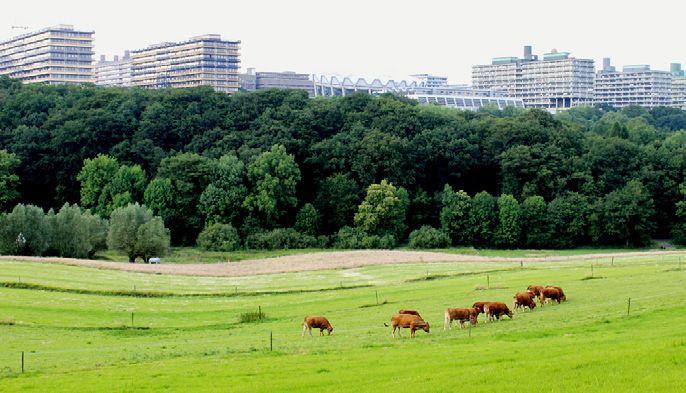
Since the general institutional framework in Greece, Poland and Bulgaria
    differs considerably from Germany’s institutional setting, the effects were
    also evaluated with regard to institutional integration.

    The core of the empirical work, however, deals with the main dilemma
    of structural policy, namely that it usually occurs after the fact to remedy
    the situation and is not preventive. However, structural policy in the
    wake of the energy transition in particular could be shaped at an early
    stage.

    In the following, the most important terms related to structural change
    and policy are defined and the functioning of structural policy in Germany
    is explained (chapter 2). Building on these definitions and explanations,
    the development of lignite and hard coal mining in Germany as well as
    structural changes in the Ruhr area will be traced (chapter 3). The fourth
    chapter describes and analyses selected structural policy measures in
    the Ruhr area over the last 50 years, as well as the current structural
    policy program “Unternehmen Revier” for the four lignite mining areas
    in Germany. Finally, transferable solutions identified and criteria for
    other regions are proposed in the context of recommendations for action
    (chapter 5).

8
2                     Economic change                Economies are subject to constant structural

                            in Germany
                                                      change. However, various factors can impair
                                                      an economy’s ability to adjust to this change.
                                                      Depending on the social and political model,
                            the State then intervenes to help regions with developmental deficits.
 Structural change as an    As shown in Figure 1, this structural change, in contrast to the “unman-
        ongoing process     aged” (meaning the unintentionally influenced structural change only
                            resulting from the market), can be described as “managed” structural
                            change.

                            “Structural policy” is understood to mean political interventions, includ-
                            ing legal and institutional interventions intended to influence structural
 Structural policy shapes   change in a targeted manner. For example, structural policy is the sector
       structural change    of economic policy that selectively relates to specific areas (e.g. weaker
                            regions or sectors with development deficits). As shown in Figure 1,
                            structural policy can also be subdivided into sectoral and regional struc-
                            tural policies.

             Figure 1: 	 Structural change
                          Source: Author’s data

                                             STRUCTURAL CHANGE

                               Unmanaged                                      Managed
                            structural change                             structural change

                                                                Regional                     Sectoral
                                                            structural policy            structural policy
                            Regional structural policy has different meanings, is used interchange-
                            ably with terms like regional policy or regional economic policy 1 and
                            is used to promote targeted development of certain sub-areas. This is
                            usually achieved by financially supporting certain areas and rerouting
                            financial flows. Regional science distinguishes between planned and
                            unplanned spatial financial flows Financial flows with planned regional
                            impacts include financial equalisation, large-scale transport infrastruc-
                            ture measures and measures under the scope of structural and regional
                            planning policy. Financial flows with unplanned spatial impacts include,
                            for example, taxes, general government subsidies and social security
                            systems.

                            1   See e.g. Fürst et al. 1976: 4; Eckey 1995: 815

                                                                         Just transition for regions and generations   | 9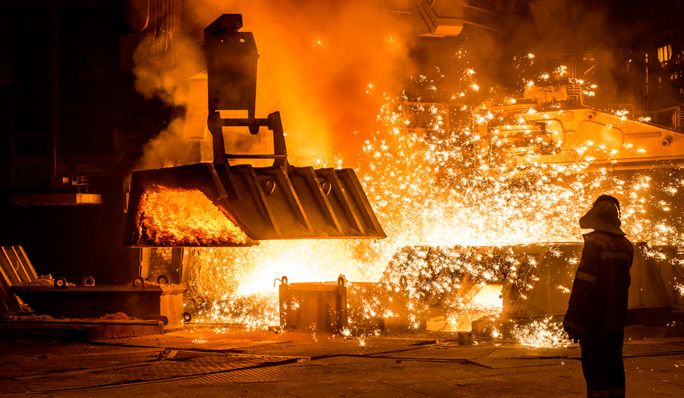
Financial flows in
regional structural policy
       can unfold so-called
     spatial effects. Among
the financial flows which
      – as regional science
  calls it – have planned

                                                                                                                 Photo: Karl-Heinz Liebisch/pixelio.de
        spatial effects are,
  for example, transport
infrastructure measures.

      Regional and sectoral    The application and impact of structural policy is often a mixture of
           structural policy   regional and sectoral policies, as the development deficits of specific
                               sectors are concentrated in certain regions there is a lack of growing and
                               sustainable sectors in structurally weak regions. Sectoral and regional
                               structural policies also influence each other in terms of interests, motives
                               and objectives. But there can also be conflicting goals: if an industry
                               and thus a region in which the industry occupies a significant position is
                               in decline, regional policy-makers are primarily concerned with the
                               development of the region, e.g. paying subsidies to attract new businesses.
                               For the owners as well as the employees of the prevailing industries the
                               top priority is to preserve established companies because good wages are
                               often paid in established industries and returns are high.

        Structural policy is   Regional structural policy is a multi-level policy that extends from the
        a multi-level policy   EU, federal and state levels down to the municipal level. In Germany,
                               the possibilities to access the lower spatial level (e.g. local self-government
                               guaranteed by the constitution) are limited, as became evident, for
                               example, in the context of Germany’s energy transition and the planned
                               power lines. In the case of larger infrastructure projects, the various
                               stakeholders in the region must therefore be persuaded to participate in
                               the process.

    Local economic policy      Local economic policy – policy that focuses on the city, county or region –
  and / vs. regional policy    is pursued independently of the structural policy objectives of the higher
                               spatial level as shown in Figure 2. Often the objectives of the different
                               levels complement one other, e.g. when a structurally weak region responds
                               to specific, balanced regional economic development programmes of
                               the EU or a federal state. The distinction between regional and local
                               economic policy is by no means trivial because municipal economic

10
development can pursue an egocentric policy regardless of overall
regional objectives. Thus, in addition to a consensus-oriented policy,
a conflictual local economic policy may also result if, for example,
certain sectors in individual locations are to be promoted by all regions,
from which, however, not everyone benefits. Strictly speaking, the same
is true of a balance-oriented regional policy, e.g. when a wealthy region
increases its prosperity through smart economic policy and thus con
tributes to widening the regional welfare gap.
Figure 2: Levels of regional structural policy
Source: Author’s data based on Gärtner 2008
EU, federal government, federal state
Regional policy / regional structural policy
(economic policy geared to sub-regions)
e.g. redistribution of resources
Common objectives Diverging goals
Improvement of own location
Local economic policy, e. g. municipal economic development
(policy geared to one’s own region)
Municipalities, counties …
Section 2.1 discusses the context of structural change, which generally
can be considered an independent process based on growth of location
factors due to market pressure, natural conditions and political and social
trends. However, the section also addresses the fact that this automatism
can lead to undesirable socio-political, regional and macroeconomic out-
comes. The State therefore tries to intervene through targeted measures
(section 2.2). Section 2.3 deals with the fact that, despite structural
interventions, change can hardly be stopped in the long term. Finally,
Section 2.4 concludes by highlighting the dilemma that structural policy
generally has no preventive impact.
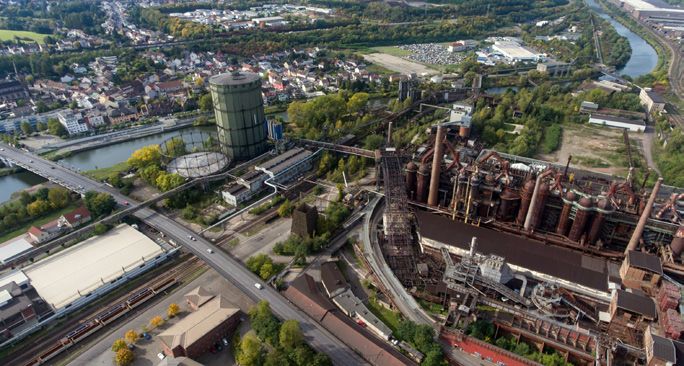
Just transition for regions and generations | 11The coal and steel
industry has made
the Ruhr area the
largest agglomeration
in Europe. With the end
of the hard coal mining,
the Ruhr area
Photo: Getty Images /iStockphoto
had to reinvent itself
economically.
2.1 Structural change and structural rupture
Development paths of Even though structural ruptures sometimes occur, new economic sectors
structural change often grow out of these old sectors. For example, the environmental
economy in the Ruhr area was created by the mining industry due to the
increased environmental requirements since the 1970s. This industry
still exists in the region today, although the mining industry no longer
matters 2. The food industry in Mecklenburg-Western Pomerania, which
was created there because of a strong agricultural base 3, is another
example. Furthermore, in the region around Bielefeld the processing of
flax into linen began in the 16th century. Even if today the production
no longer exists, local textile brands still exist in the area.
Adjustments to product ranges usually are made by the companies them-
selves, if, for example they find that their products are less in demand.
It is often helpful to observe companies of the same industry to get an
impression about the market situation – which products are in demand
and which new markets can be tapped. This is one of the reasons why
companies of the same sector, especially historically, often concentrate
locally. The industrial complexes grew outside of cities and city centres
not only for reasons of space shortages and rising land prices, but also
for reasons related to urban hygiene. The systematic separation of the
functions of housing, work, transport and leisure was adopted in the
Charter of Athens in 1933 and was only revised by the so-called Leipzig
Charter on Sustainable European Cities in 2007, which added more
authority to the concept of the “City of Short Paths” 4. Furthermore,
2 Nordhause-Janz / Rehfeld 1995, 2012; Pizzera 2012
3 Gärtner / Flögel 2017
4 Brandt et al. 2017
12The German Mining
Museum in Bochum,
the largest of its kind
in the world.
Photo: Getty Images /iStockphoto
declining transport costs have shifted production to parts of the world
where natural resources are cheaper, labour and other factor costs are
lower and environmental regulations were and still are laxer.
Structural change Structural change also repeatedly creates opportunities for a new start,
creates opportunities for example buildings are empty and new things can be tried out.
For instance, former industrial sites have been considered to have special
potential for about 20 to 30 years from now and are no longer seen
exclusively as the decline of the industrial base. This is also reflected in
a corresponding policy for the preservation of historical monuments,
specific funding programmes, international building exhibitions and
well-designed architectural projects which often enhance the value of
these building complexes. Within the framework of structural policy,
interventions and economic development policies, services have been
provided in many old industrial regions and districts in recent years,
e.g. in the cultural and creative industries, but also knowledge-based
services. The rehabilitated industrial buildings often serve as backdrops
for these new cultural venues and creative added value.
Strong significance of However, this structural change has mainly created jobs in the service
the service sector sector. The lower demand for labour due to the high productivity increase
in the industrial sector could not be compensated completely and not in
all regions by job offers in the service sector. In addition, salaries in the
service sector have not increased to the same extent as in the industrial
sector. This is mainly due to the fact that rising wages – at least in the
case of private service companies – are usually financed by an increase in
productivity. But on average, productivity gains are lower in the service
sector than in the manufacturing sector. Even though de-industrialisation
has contributed to an improvement in the quality of life, individual
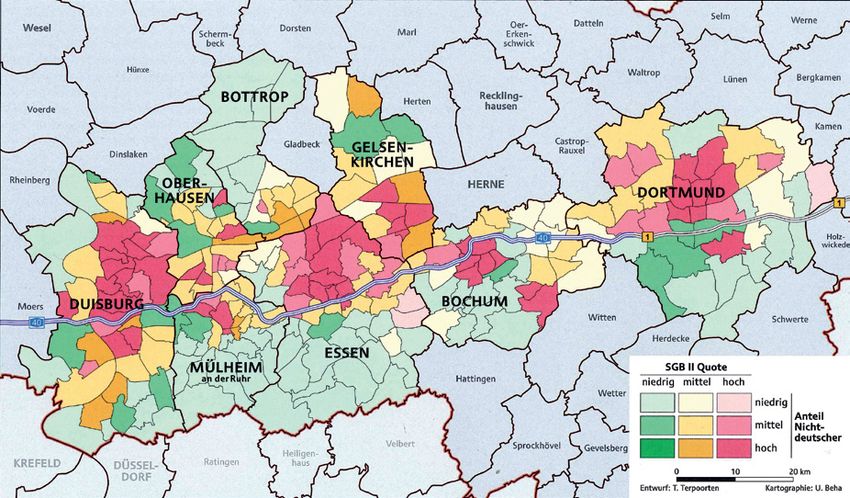
Just transition for regions and generations | 13Figure 3: Employees subject to social security contributions in production
professions as a percentage of all employees, counties and
independent cities 2014
Source: BBSR Bonn 2017
Data: Employment statistics of the Federal Employment Agency
Kiel
Rostock
Lübeck
Schwerin
Bremerhaven Hamburg
Oldenburg
Bremen
Berlin
Hanover Wolfsburg
Osnabrück Potsdam
Frankfurt/Oder
Braunschweig
Bielefeld Magdeburg
Münster
Cottbus
Paderborn Göttingen
Duisburg Essen
Dortmund
Leipzig
Düsseldorf Kassel Dresden
Jena
Aachen Cologne Erfurt Chemnitz
Bonn
Koblenz
Wiesbaden Frankfurt
Mainz Darmstadt
Trier Würzburg
Erlangen
Ludwigshafen Mannheim
Fürth
Saarbrücken Heidelberg Nuremberg
Karlsruhe Heilbronn Regensburg
24.3 % and below Pforzheim
Stuttgart Ingolstadt
24.3 – 28.6 %
Augsburg
28.6 – 32.6 % Ulm
Munich
32.6 – 36.8 %
36.8 % and above Freiburg
14employment biographies are fractured, because former industrial workers
only partly fit the requirements of the new service industries. This also
means that nowadays, e.g. in the Ruhr area, fewer people work in manu-
facturing professions than in the rest of North Rhine-Westphalia (Figure 3).
Size, location, Mining regions have always been affected by structural change: phases of
economic diversity economic growth are usually followed by phases of structural change,
for example because deposits have been depleted or have become eco-
nomically unprofitable for different reasons. These development pathways
differ greatly. Whether cities and agglomerations survive structural
change without significant demographic decline when the raw materials
run out or have lost value due to developments on the global market
depends, on the one hand, on their economic diversity, their size, the
situation in the region and, on the other hand, on the political willingness
to support the regions in developing new competitive economic fields.
The commitment to support regions is partly determined geopolitically
and culturally. For example, it is difficult to imagine suggesting to the
people of Helgoland or the Azores that they move to the mainland and
receive financial support, even if this would be cheaper in the long term
than implementing permanent structural policies. In Europe, and
especially in Germany, the State is more willing than in many other parts
of the world to counteract and mitigate the consequences.
Just transition for regions and generations | 152.2 Political intervention is necessary for balanced
regional development
Balanced Regional structural policy has traditionally pursued the goal of balanced
structural policy regional development motivated either by social policy or growth policy.
The aim of social policy is to ensure that everyone in all sub-regions has
equivalent living conditions. However, if growth is the goal, the main
question is to define where financial support generates the highest overall
economic return. From a growth policy standpoint, a balanced structural
policy can also be justified by the fact that the best possible economic
outcome is achieved by exploiting the full potential and resources in all
areas.
Equivalent living In Germany there is a prescribed legal requirement to create equivalent
conditions living conditions in all sub-regions. Article 72, paragraph 2 of the Constitu
tional Law formulates a statement on spatial equilibrium, thereby con-
ferring on the federal level the authority to act or legislate “if and to the
extent that the establishment of equivalent living conditions throughout
the federal territory or the preservation of legal or economic unity in
the national interest require regulation by the federal law.”
Article 106 of the Constitutional Law which determines the financial
equalisation among the federal states in the event of imbalanced develop-
ment also impacts regions. Germany’s Regional Planning Act also takes
a position in Section 1 (2) by requiring the establishment of “similar
standards of living in all regions”.
However, this position has been slightly revised. After the reunification,
the passage in Article 72 (2) of the Constitutional Law was changed from
uniformity to equivalence of living conditions 5, which creates greater
scope for interpretation and action. It is therefore not a question of the
same living conditions but equal living conditions.
Demand-driven In post-war Germany, the primary focus was to distribute growth and
approaches link the peripheral regions to the growth centres. In this traditional
structural policy which strived to achieve a regional balance, demand-
oriented approaches were mainly pursued, e.g. in the form of export base
theory (see Figure 4).
5 E.g. Eickhof 2005:2; Hahne 2005
16Figure 4: Income cycle according to the export basis model
Source: Gärtner 2008 based on Schätzl 2001
REGION
Export income Export activities
Expen-
Profit transfer, expenditures for imports ditures
for local
goods and
services
Local activities
Expenditures for imports Intraregional multiplier
GRW – Improving According to the theory, the engine of economic development is the
regional economic export of goods and services and the income generated by a region. A key
structure pillar of this policy is the Joint Federal/Länder Task for the Improvement
of Regional Economic Structures (GRW) which was introduced in 1969
for the purpose of coordinating the various levels involved in structural
policy (federal, state and local government). The GRW works with incen-
tives to encourage investments in certain regions. As part of this policy
to redirect investment, attempts were later made not only to generally
divert investments to structurally weak regions, but also to concentrate
them there on certain growth clusters 6. Since the 1980s, this policy has
been complemented – as part of a policy that relied less and less on large
corporations – by targeting the development of start-up and technology
centres and networking with universities and research institutes.
6 Becher / Rehfeld 1987
Just transition for regions and generations | 17After attempts were initially made to channel this investment primarily
to disadvantaged regions as part of an innovation-oriented regional
policy 7, since the 1990s research and education investments have been
channelled to regions where specific competitive cores already exist as
part of a policy that focuses more on regional competences. Even though
the GRW has been reoriented for the 2014–2020 funding period, is now
more strongly oriented towards Germany as a whole, makes individual
company support possible again and now also includes elements such as
the promotion of services of general interest and tourism8, it continues to
focus heavily on the traditional industrial economy.
Decentralised, As a counter model, decentralised, endogenous development has been
endogenous promoted since the 1970s,9 and concepts developed with a stronger focus
structural policy on endogenous development. This concept has experienced a renaissance
since 2007, on the one hand, due to the debate about environmental
transformation and, on the other hand, as a result of the financial crisis.
These approaches go hand in hand with a shift in political and social
values, relying more on a bottom-up rather than a top-down approach
and focus more on personal accountability than before. One of the
best-known bottom-up examples is the “Transition Town” movement
launched by Rob Hopkins in 2005 in the town of Totnes in south-west
England 10 where, in addition to environmental goals, the aim is to create
employment opportunities through regionalisation of value chains.
Monetary flows The starting point for such a consideration is a systemic understanding
of spatial economy. As shown in the figure below, different (monetary)
flows enter and leave a region. In the case of a residential area, this would
mainly involve income, transfer payments and investments. At the same
time, money flows out of an area in the form of spending for external
consumption (e.g. energy costs), taxes, social security contributions
and returns. The regionalisation of value chains incudes a significant
reduction of the money outflow.
Traditionally, however, regional structural policy focused on the opposite:
the aim was not to reduce the outflow of money, but to export goods and
services to a region as the engine of economic development.
7 See Bömer/Noisser 1981
8 Coordination Committee of the Joint Task 2016
9 See Friedmann/Weaver 1979; Hahne 1985; Hahne/von Stackelberg 1994; Kappel 1999: 434
10 Maschkowski/Wanner 2014
18Figure 5: Systemic analysis of regional economic processes
Source: Flögel/Gärtner 2011
Vacanc Income
i es, f
Image r ee
bu
External consumption
ild i
n gs
Reputation
Quality of life Returns
Work
L iv in g, E d u ca
Living
Investment
IDENTITY
tio n
State transfer payments
, Cu
e,
lt u
Lo c
r
al s u Taxes, social security
p ply contributions
IDENTITY
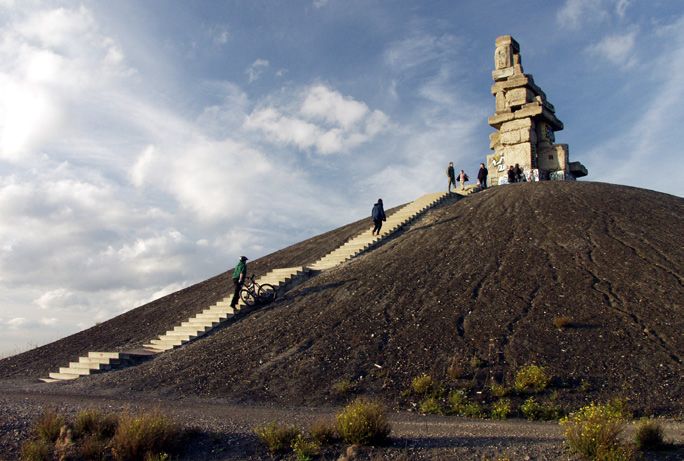
Just transition for regions and generations | 19The site of the former
Nordstern mine in
Gelsenkirchen was
rehabilitated and
transformed into a
landscape park after the
closure of the mine. The
Photo: Timo Beyl / pixelio.de
“Nordsternpark”, through
which the Rhine-Herne
Canal flows, hosted the
Federal Horticultural
Show in 1997.
2.3 Shaping change
Shape change, The example of the Ruhr area shows that, even if an initial attempt was
don’t prevent it made to change the framework conditions and stop structural change,
structural change cannot be stopped. Regional actors often do not try to
change the situation in the region and embrace structural change, but
instead try to change the prevailing conditions. The decline of a region
can therefore be exacerbated by stable, consensus-oriented relationship
structures 11. In some cases, the dominating industries and companies
are so powerful that they can exert influence. One notable example is
the introduction of the coal penny in Germany in 1974, which helped to
keep German hard coal subsidised and competitive. This does not just
apply to industries with long traditions.
Initiate discursive Strong industry identity and clinging to traditional structures (although
processes it is always difficult to identify what the industries of the future will be)
at an early stage can lead to a situation where change is prevented in the short term but
cannot be stopped in the long term. This may be particularly detrimental
to sectors and regions that do not have the power to permanently influence
national and international policies and the related regulations to their
own benefit in the long term or to which the harmful effects (e.g. climate
damage resulting from coal-fired power generation) can be clearly and
easily attributed. If it is not possible to prevent change in the long run,
it makes more sense to accept and embrace change at an early stage than
to fight it. For this insight to lead to action, a discursive process must
take place with the shareholders and stakeholders.
11 See Grabher 1990; Granovetter 1973
20A victim of the global
steel crisis in the 1970s:
the ironworks in
Völklingen, Saarland,
which closed down
in 1986. In 1994 the
Photo: picture alliance / BeckerBredel
ironworks’ pig iron
production was declared
a World Heritage Site
by UNESCO.
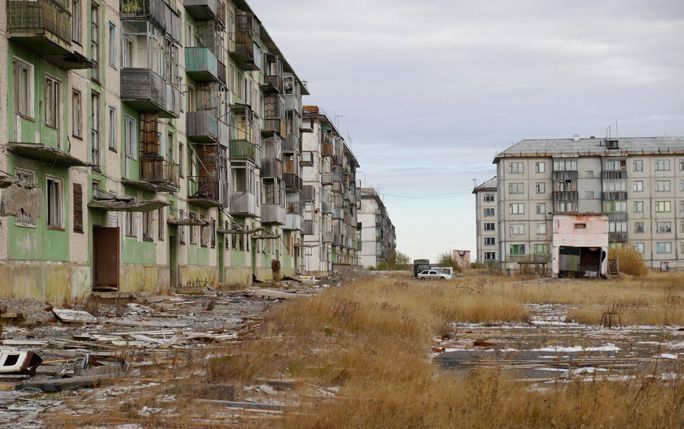
Structural weaknesses Old industrial cities and regions can also draw potential from their
offer potential, perceived structural weakness. In the context of structural and demo-
but also the risk of graphic change, for example, land and buildings frequently become
recurring crises vacant which can be used temporarily or permanently for cultural or
economic activities. For example, the old industrial architectural heritage
in the form of empty industrial buildings can be used as landmarks and
for identification with symbolic or cultural value. The importance of
these spaces for the hotspots of the creative scene has meanwhile been
acknowledged in the development of urban areas, but some potential is
also evident in more rural regions due to vacancies and economically
underused spaces 12. These are usually individual examples that cannot
trigger a self-sustaining economic upswing. And the dilemma here is that
areas become vacant mainly in monostructured old industrial areas on
the periphery 13 while new uses are quickly found for these kinds of spaces
or buildings in more prosperous areas. According to Kersten, Neu and
Vogel 14, the argument that special opportunities arise from cycles of
crises also runs the risk of deserted spaces being rebranded as “creative
zones”. In areas with particularly pronounced crisis cycles, civil society’s
involvement and the potential of skilled workers are eroding along with
economic developments. A reversal of this trend only seems realistic
with the help of external interventions. At the same time, however, there
must be an understanding that politics cannot solve everything and that
there will be regions that will shrink economically and demographically.
Potentially, peripheral industrial regions will be affected more strongly
than larger (old industrial) agglomerations.
12 Flögel/Gärtner 2011
13 Sandeck/Simon-Phillip 2008
14 2015a
Just transition for regions and generations | 212.4 Structural policy is almost always too late
Preventive Since the 1970s, debates have been taking place about a preventive
structural policy rather than a structural policy implemented in retrospect. One of the
early founders of this philosophy is Rembser from the German Federal
Ministry of Research and Technology, who spoke about initiating active
structural change15. Rembser’s concept of preventive structural change
was not concerned with building up forecasting capacities, but rather
with building networks and promoting research and innovation, since
“technology and scientific research can make a contribution to preventing
problems or crises from occurring in the first place”. According to the
concept, support measures should not focus on the industry, but on the
technologies, because they bring potential for the economy as a whole16.
Involve various actors The issue was also taken up under the label “forward-looking structural
from all social policy” by trade unions and employee representatives who were look-
backgrounds ing for an “innovation-oriented regional policy”. Innovation-oriented
regional policy, which sought to integrate state funding for science and
technology with regional structural policy and to increasingly channel
it to disadvantaged regions, should be expanded to become a forward-
looking structural policy17. Pfeiffer18, former managing director of the
German Trade Union Confederation (DGB), is critical of the fact that
global governance, which with the help of the German constitution and
the Stability and Growth Act seeks to keep the Federal Republic balanced
in a macroeconomic sense, “does not take regional development and
sectoral economic cycles and crises into account”. The trade union concept,
which Pfeiffer proposes instead, provides for institutionalised macro
economic and regional participation of the social groups in shaping
opinions and positions related to economic policy decisions. His solution
involves a forward-looking “structural policy that does not seek to rectify
sectoral and regional undesirable developments retrospectively, but
intends to avoid them in the first place” 19.
15 See Rembser 1977: 5
16 Gärtner 2014; Rembser 1977: 39
17 Bömer / Noisser 1981
18 1982
19 Pfeiffer 1982: 623
22High demand for Thoss and Ritzmann20 wanted their study “Informationsgrundlagen für
information about future die vorausschauende Strukturpolitik” (Informational basis for forward-
developments and trends looking structural policy) to contribute to qualitative growth, full employ-
ment of existing production factors and balanced development of supply
and demand also at regional level. Thoss and Ritzmann21 distinguish
between two structural policy strategies: first, the defensive strategy,
which aims to slow the pace of structural change without being able to
prevent it in the long term. They cite forward-looking structural policy
as a second and preferred alternative: “A policy of this kind would be
designed to prevent negative structural developments – i.e. imbalances
in supply and demand in sectors (and/or regions) well in advance – and
with a view to the future” 22.
Additionally, growth industries should be supported effectively and the
process of withdrawing from shrinking sectors should be started at an
early stage. “In this way, the risk of misguided investments in vocational
training and production facilities, which will no longer be needed in the
future, could be reduced and the necessary structural change achieved
with as little friction as possible”23. They underscore the fact that a
forward-looking structural policy requires a high level of information in
the form of analyses, forecasts and projections24.
Factor in forecasting The fact that this has not been implemented in the discussed form is
problems also due to the problem of forecasting, which is, however, less virulent in
the context of an imminent coal phase-out, in particular due to the high
climate damage of lignite-fired power generation. This has been reinforced
in international spacial science by misguided, regional forecast-based,
centralist planning by the French regional government as well as poor
forecasting results of macroeconomic forecasts. In addition, the fall of the
Berlin Wall, rapid reunification and the subsequent transformation took
everyday politics in Germany by surprise. This showed, on the one hand,
how quickly macroeconomic and geopolitical events can arise and, on
the other hand, it required ad hoc measures that do not create any scope
for a long-term perspective. In the course of the political transformation
of Eastern Europe and Russia and the global market-oriented economic
order, efforts were also made to avoid political concepts that had the
appearance of planning and control.
20 1984
21 1984: 4 ff.
22 Thoss / Ritzmann 1984: 5
23 Thoss / Ritzmann 1984: 5
24 Thoss / Ritzmann 1984: 6
Just transition for regions and generations | 23New support criteria It should also be kept in mind that structural policy is traditionally based
for preventive on a regional status quo, structurally weak regions, for example, were
structural policy supported in the past. In the case of preventive intervention, the structural
weakness of a region will only become apparent in the future and will
only come about if successful preventative action is not taken in advance.
This is the fundamental challenge of prevention: if successful preventive
action is taken, the original risk identified will not materialise. Policy-
makers would therefore have to be willing to finance structural change
in a region that, according to socioeconomic data, does not need funding
at the expense of a region that is currently structurally weak. Structural
change – unlike, for example, climate change (although implementation
in this area also lags far behind the targets) – is not a real existential
catastrophe for society as a whole. And the uncertainty as to whether
there will actually be a change prevents any action from being taken.
However, the finite nature of mineral resources, for example, can gener-
ally reduce uncertainties and lead to structural change being initiated
at an early stage by the stakeholders affected to create scope for action,
and the competences in the entire value chain can be developed into new
competitive sectors.
243 Structural change in To demonstrate the importance of coal produc-
Germany and the Ruhr area
tion in Germany, the following section will
first trace and analyse selected indicators of
lignite and hard coal production. The structural
change in the Ruhr area over the past decades is then presented and
analysed using selected indicators.
3.1 Development of coal production in Germany
Long tradition of Coal mining has a long tradition in Germany. In the southern Ruhr area,
hard coal mining in for example, the first coal deposits were already being excavated in the
West Germany Middle Ages for domestic consumption. Over the course of the advancing
industrialization it was also possible to penetrate and extract deeper coal
seams.
Figure 6 below shows the development of employees and coal production
in 1,000 tonnes in hard coal mining in West Germany from 1950/1957.
Figure 6: Development of hard coal production and employees
in West Germany, 1950–2017
Source: Statistik der Kohlewirtschaft e.V., author’s data
700,000
600,000
500,000
400,000
300,000
200,000
100,000
0
50
19 8*
19 0*
19 2*
*
70
80
90
00
10
17
64
5
6
6
19
19
19
19
20
20
20
19
Employees Hard coal production in 1,000 t
* Author’s estimates of hard coal employees based on trends
Just transition for regions and generations | 25»» Hard coal mining is very labour-intensive due to underground work.
At the end of the 1950s, nearly 600,000 people were employed in this
sector in Germany.
»» Due to high productivity gains in the 1960s, an above-average reduction
in the workforce can be observed in this decade. Between 1957 and
1968, the workforce decreased by more than half (-343,300, -56 %)
from over 607,300 to 264,000. The coal deposits produced during
this period fell by around 37.4 million tonnes (-25 %). One reason
for this was the various measures to stabilise demand for hard coal
through government subsidies (see below).
»» Only after the substantial staff cutbacks before 1968 is it possible
to speak of a slow and steady “structural change” by 2018, which is
evolving roughly in parallel to the declining trend of coal mining.
Since 2000, the number of employees has further decreased from just
under 45,400 to 5,800 in 2016. This represents a workforce reduction
of - 87.2 %.
High importance Historically, the origins of lignite use in Germany date back a long way
of lignite production to as early as the 17th century. While hard coal was only mined in West
in East Germany Germany, lignite plays an important role in energy production both in
West and East Germany (see Figure 7).
Welzow-Süd is one of
the four active opencast
lignite mining areas
in Lusatia. With 8,600
employees and a
production volume of
62.3 million tonnes
Photo: picture alliance / Andreas Frank
(2016), lignite mining is
still of great economic
importance for Lusatia.
26Figure 7: Development of lignite production and employees,
East and West Germany 1950–2017
Source: Statistik der Kohlewirtschaft e.V., author’s data
350,000
300,000
250,000
200,000
150,.000
100,000
50,000
0
50
60
70
80
90
20 00
*
10
17
02
19
19
19
19
19
20
20
20
Employees East Germany Employees West Germany
Lignite production in 1,000 t East Germany Lignite production in 1,000 t West Germany
* from 2002 employees in lignite mining incl. employees in lignite power plants
»» In the 1950s, lignite was much less important in West Germany than
in East Germany both in terms of the volume of coal produced as well
as the number of employees. In 1950, 37,600 people were employed
in the sector in West Germany, and coal production amounted to
75.8 million tonnes. While the number of employees peaked in 1958
at 38,700, the volume of lignite produced rose with slight fluctuations
until 1976, when it hit a high of 134.5 million tonnes in West Germany.
In 2016, the approximately 9,900 employees mined 91.5 million
tonnes of coal in West Germany which was processed in power plants.
»» In East Germany, on the other hand, lignite mining was of much
greater importance, with 106,000 employees and 137.1 million tonnes
of lignite produced in 1950. The number of employees rose continu-
ously to 152,000 by 1963 (+44,800, +42.3 %). Following a brief
decline in the late 1960s and early 1970s, the workforce peaked at
160,000 in 1985. Lignite production also continued to steadily
increase and peaked at 310.1 million tonnes at the end of the 1980s.
Just transition for regions and generations | 27Structural rupture »» The reunification of Germany resulted in a massive structural rupture
in East Germany in open-cast lignite mining in East Germany. The reason was the lack
after reunification of productivity: in 1989, 109.9 million tonnes of lignite were produced
in West Germany by 17,900 employees (or an average of 6.1 million
tonnes per employee). At the same time, 156,700 employees in East
Germany produced 300.8 million tonnes (or an average of 1.9 million
tonnes per employee). In the subsequent years – between 1989 and
1996, i.e. in only seven years – the number of employees in East Ger-
many fell from 156,700 to 18,900. This represents a loss of 137,800
(87.9 %) 25. Lignite production in East Germany fell by 310.1 million to
80.3 million tonnes (- 220.5 million tonnes, - 73.3 %) during the same
period. Only after this period does East German lignite production
stabilise to some extent, although this is marked by a continued slow
and steady decline in employment. In 2016, around 11,200 employees
were still working in this sector and producing around 80 million
tonnes of lignite. Productivity between West and East Germany has
thus largely converged. In West Germany, for example, an average of
9.2 million tonnes are produced per employee, while in East Germany
the average comparable value is 7.2 million tonnes.
High productivity Figure 8 shows the increase in productivity in lignite mining in East and
increases West Germany since the 1950s. The decline in development between
2001 and 2002 is due to a change in the number of employees as all
employees in the lignite-fired power plants are also included from this
point onwards.
25 The structural rupture in East Germany affected not only lignite mining, other economic
sectors also collapsed with reunification. This major upheaval was not accompanied by
specific programmes for individual sectors, but by programmes covering the whole of
East Germany. The exact fate of the many people affected by lignite mining cannot be
traced. Many older people took advantage of early retirement (covered by social sys-
tems). A study conducted by the German Institute for Economic Research (DIW) shows
the employment biography of former employees in the lignite sector. They are unem-
ployed longer than employees in other industries and the wage losses when starting a
new job are higher than average (Franke et al. 2017).
28Figure 8: Lignite production per employee in West and East Germany,
1950–2016
Source: Statistik der Kohlewirtschaft e.V., author’s data
10,000
9,000
8,000
7,000
6,000
5,000
4,000
3,000
2,000
1,000
0
50
60
70
80
90
20 0
*
10
16
02
0
19
19
19
19
19
20
20
20
Lignite production per employee East Germany
Lignite production per employee West Germany
* from 2002 employees in lignite mining incl. employees in lignite power plants
A lot of productivity gains were made in both West and East German
lignite production.
»» In West Germany, the volume of lignite produced per employee rose
from 2,000 tonnes in 1950 to 9,200 tonnes per employee in 2016.
This means that the volume of lignite produced per employee more
than tripled (358 %).
»» A structural rupture occurred in East Germany in the wake of the
reunification. While the volume of lignite produced per employee rose
from 1,300 tonnes to 2,200 tonnes between 1950 and 1989, there has
been a significant increase in productivity since 1990 due to the
unusually large reduction in employment, but also to a significantly
lower level of lignite mining. Since 1991, productivity has increased
from 2,100 tonnes to 7,100 tonnes per employee.
Just transition for regions and generations | 29Figure 9: Development of the use of hard coal in 1,000 t, West Germany
1984–2017
Source: Statistik der Kohlewirtschaft e.V., author’s data
70,000
60,000
50,000
40,000
30,000
20,000
10,000
0
84
86
88
90
92
94
96
98
00
02
04
06
08
10
12
14
20 6
17
1
19
19
19
19
19
19
19
19
20
20
20
20
20
20
20
20
Power plants Steel industry Other manufacturing sector Micro-consumption Other 20
In addition to the volume of coal produced and the changes in the numbers
of employees, it is interesting to analyse how lignite and hard coal were
and are used in Germany. Figure 9 shows the development of the use of
hard coal in West Germany.
In the case of West German hard coal, the continuous phase-out of hard
coal production, which was finally decided in 2007, becomes evident.
The production volume decreases from 60.6 million tonnes in 1984 to
4.7 million tonnes in 2017. In 1984, 45.9 million tonnes were used in
power plants which is equivalent to a share of 75.7 %. However, it is not
just the link between hard coal and electricity generation that becomes
visible, but also the link to the steel industry. 17.3 % of hard coal was
exported, with around half purchased by steel producers. The percentage
used by the domestic steel industry is also slightly increasing. Around
3.5 % of hard coal was used for micro-consumption in 1984 including use
for private purposes (household heating). The miners and their widows
received a lifelong supply of hard coal from Ruhrkohle AG (RAG).
30Figure 10: Development of the use of lignite in 1,000 t, East Germany
1989–2016
Source: Statistik der Kohlewirtschaft e.V., author’s data
350,000
300,000
250,000
200,000
150,000
100,000
50,000
0
89
90
91
92
93
94
95
96
97
98
99
00
01
02
03
04
05
06
07
08
09
10
11
12
13
14
15
16
19
19
19
19
19
19
19
19
19
19
19
20
20
20
20
20
20
20
20
20
20
20
20
20
20
20
20
20
Sales to power plants for general supply Sales to other Use for refinement including self-consumption
Figure 10 shows how East German lignite was used in 1,000 tonnes
between 1989 and 2016.
»» With respect to the use of East German lignite, it has stabilised at a
constant level of around 80 million tonnes after the structural rupture
in the wake of reunification.
»» It is also clearly evident, however, that lignite was still widely used for
personal consumption at the end of the GDR period until the early
1990s. The percentage here was still around 41.2 % in 1989 and then
fell to less than 10 % during the 1990s. Accordingly, the importance of
lignite use in power plants increased from 43.1 % to 92.1 % by 2016.
Just transition for regions and generations | 313.2 Structural change in the Ruhr area
High immigration rates With around five million inhabitants on an area of 4,400 km², the Ruhr
in the middle of is one of the most densely populated regions in Europe. This was not
the 19th century always the case: prior to industrialisation, which began in the middle of
the 19th century, there were still less than a million people living in the
Ruhr area26. As a result of industrialisation, the Ruhr area experienced an
enormous increase in population in a very short time due to immigration.
After a temporary peak of over 5.5 million inhabitants in the 1960s,
the number of inhabitants remains relatively constant at around 5 million.
Figure 11 shows the total of 15 districts and independent cities in the
Ruhr area, which are located in the heart of Europe and border the Rhine-
land with the cities of Dusseldorf and Cologne.
Figure 11: Counties and independent cities in the Ruhr area
Source: Author’s data
Recklinghausen
county Hamm
Wesel
county
Bottrop Unna
Gelsen county
kirchen Herne
Ober- Dortmund
hausen
Duisburg Bochum
Essen
Mülheim
a. d. Ruhr Ennepe-
Ruhr- Hagen
County
500,000 employees Since the mid-1950s, when the highest number of employees measured
in Ruhr mining in the 50s was 500,000, the Ruhr area has been phasing out hard coal. This means
that every tenth inhabitant in the Ruhr area was employed in mining.
This shows the immense importance of mining for this region and the
families living there, especially as it must be kept in mind that the
traditional “sole breadwinner model” still prevailed at the time, in which
men pursued gainful employment while women were responsible for
raising children.
The first coal crises, however, cut the number of jobs in half by the end of
the 1960s: the number of employees fell from 495,800 in 1957, the year of
26 Source: Statistics of the RVR
32Everyday life in the
Ruhr area in the 1950s.
Miners on the
“underground” road.
Photo: picture-alliance / KPA / Andres
the highest level of employment, to 210,300 in 1968, the year in which the
first specific structural policy programme for the Ruhr area was launched
(see below). This represents a decline of more than 285,600 employees
and thus a percentage employment loss of 57.6 % (see Figure 12).
Figure 12: Development of employee numbers in the coal mining
industry, Ruhr area 1950–2016
Source: Statistik der Kohlewirtschaft e.V.
700,000
600,000
500,000
400,000
300,000
200,000
100,000
0
50
60
70
80
90
00
10
16
19
19
19
19
19
20
20
20
Ruhr area Other regions
Just transition for regions and generations | 33Declining importance of In the 1970s, the transition to a service society got underway. Since then,
the manufacturing sector the share of the workforce employed in the service sector – with slight
cyclical fluctuations – has risen, while the share of those employed in the
manufacturing sector has declined. This trend can be observed for both
the federal state of North Rhine-Westphalia (NRW) and the Ruhr area
(see Figure 13). For the Ruhr area, it is important to keep in mind:
»» that the structural change towards a service-based economy (measured
in the percentage of employees) began about three years later than
in NRW due to the high significance of the coal and steel industry;
»» that the percentage losses of people employed in the manufacturing
sector were higher than in NRW in the period 1964–2014 (Ruhr area:
- 57.2 %, NRW: - 42.7 %), while the growth in the service sector with
an increase in employment of 84.2 % is lower than the national average
of 116.4 %;
»» that at 26.4%, the percentage of people employed in the manufacturing
sector in the Ruhr area is now below the national average of 27.4 %
Economic development thus lags behind development of NRW.
34Figure 13: Share of employees in the manufacturing and service sector,
Ruhr area and NRW, 1964–2014
Source: Employment statistics of the German Federal Employment
Agency, Calculation and representation: IAT
80 %
70 %
60 %
50 %
40 %
30 %
20 %
10 %
0%
64
70
80
90
00
10
14
19
19
19
19
20
20
20
Share in the manufacturing sector Ruhr area Share in the manufacturing sector NRW
Share in the service sector Ruhr area Share in the service sector NRW
Focus on lead markets As part of an analysis carried out on behalf of the business.metropole
Ruhr, eight leading markets were defined for the Ruhr area in 2008 27.
These fields of competences are characterised by regional competencies
and future viability. However, the Ruhr area only has above-average
employment percentages for 2013 in the lead markets of health with
17.1 %. (NRW: 15.7 %, Germany: 15.4), mobility with 10.1 % (NRW: 9.6 %,
Germany: 11.7 %) and resource efficiency with 6 % (NRW: 3.8 %, Germany:
3.5 %), which includes both renewable energy and traditional energy
suppliers. In the lead market of education and knowledge, the Ruhr
area (4.8 %) is at the same level as NRW (4.6 %) and Germany (4.7 %)
(see Figure 14).
27 Nordhause-Janz/Rehfeld
Just transition for regions and generations | 35Figure 14: Employees subject to social security contributions in the lead
markets as a percentage of all employees subject to social
security contributions 2013
Source: Employment statistics of the German Federal Employment
Agency, Calculation and representation: IAT
19.1 %
18.8 %
20 %
17.1 %
18%
16.5 %
15.7 %
15.4 %
16%
14%
11.7 %
11.7 %
11.6 %
11.3 %
12%
10.1 %
9.6 %
10 %
8.4 %
8.0 %
7.3 %
8%
6.3 %
6.0 %
5.6 %
6%
5.0 %
4.8 %
4.7 %
4.6 %
3.8 %
3.7 %
3.6 %
3.5 %
4%
2.8 %
2%
0%
co rial
lth
liv on
y
pt ble
ie rce
en d
le and
io l
at a
ilit
ev an
ic igit
ea
d cti
re
g
n
y
ts
e
n
st
um ina
fic u
ob
nc
in
io
dg
ef eso
e
ow n
un D
du
an tru
H
ur
kn atio
M
ns ta
In
ns
is
co us
R
Le
uc
co
S
Ed
m
an
m
rb
co
U
Ruhr area North Rhine-Westphalia Germany
With the decline of coal and steel in the Ruhr area, a change began which
is still ongoing today. This affects the northern Ruhr area in particular
because of the later onset of structural change due to the “northward
migration28 “ of coal mining. In the southern Ruhr area, the loss of coal
and steel was compensated more strongly due to the expansion of the
universities in Bochum, Dortmund, Essen / Duisburg, the private university
in Witten, the distance learning university in Hagen and several success
fully established technology centers. In single neighborhoods in the
southern Ruhr area, a new urban quality has emerged with high-quality
services and cultural centers.
28 Coal production started in the Muttental valley in Ennepe Ruhr country in the southern
Ruhr area and migrated north in order to extract the deeper coal there as technology
advanced.
36You can also read