Addressing brain drain: The local and regional dimension - Commission for Social Policy, Education, Employment, Research and Culture - European ...
←
→
Page content transcription
If your browser does not render page correctly, please read the page content below
Commission for
                            Social Policy, Education,
                    Employment, Research and Culture

                  Addressing brain drain:
SEDEC

        The local and regional dimension
© European Union, 2018
Partial reproduction is permitted, provided that the source is explicitly mentioned.

More information on the European Union and the Committee of the Regions is available online at
http://www.europa.eu and http://www.cor.europa.eu respectively.

Catalogue number: QG-06-18-125-EN-N; ISBN: 978-92-895-0991-6; doi:10.2863/280544
This report was written by Simona Cavallini (Fondazione FORMIT),
       Rossella Soldi (Progress Consulting S.r.l.), Lorenzo Di Matteo
  (Fondazione FORMIT), Mihaela Alina Utma (Fondazione FORMIT) and
      Beatrice Errico (Università degli Studi Internazionali di Roma).

  It does not represent the official views of the European Committee of the
                                    Regions.

    It does not represent the official views of the Committee of the Regions.
More information on the European Union and the European Committee of
the Regions is available online at http://www.europa.eu and
http://www.cor.europa.eu respectively.

© European Union, 2018
Partial reproduction is allowed, provided that the source is explicitly
mentioned.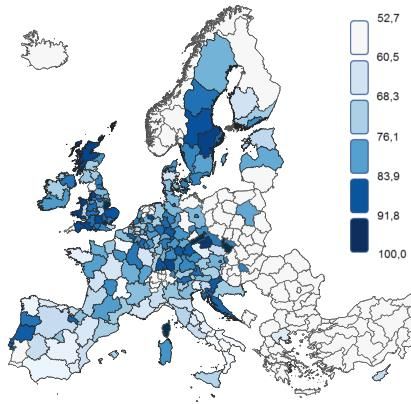
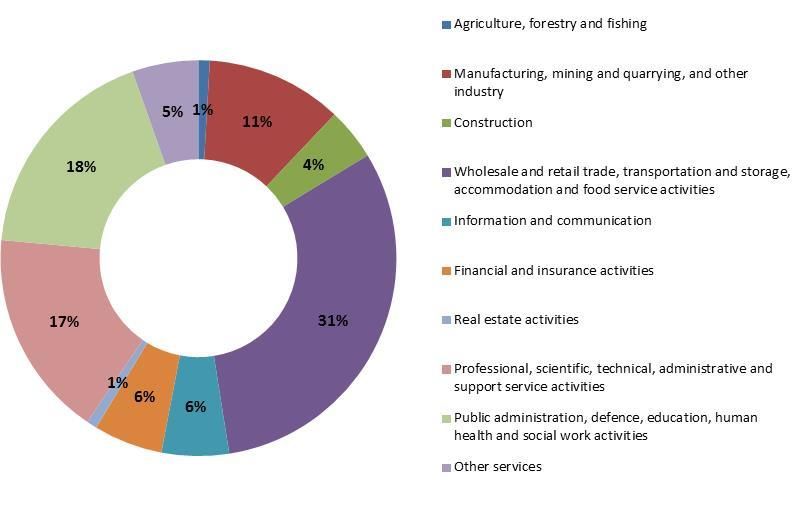
Table of contents
Executive summary ............................................................................................. 1
Part 1: Concise state of play of brain drain at local and regional levels ....... 5
1.1 Introduction ................................................................................................. 5
1.2 Migration flows at the regional level in Europe ......................................... 7
1.3 Intra-EU mobility of young and of highly educated people ..................... 11
1.4 Factors driving the mobility of highly skilled workers............................. 13
1.5 The socio-economic impact of brain drain at regional levels ................... 16
Part 2: Inventory of local and regional initiatives to address the negative
      effects of brain drain ............................................................................... 19
Part 3: Case studies of local and regional strategies ...................................... 41
3.1 BEWARE (BEcome a WAlloon REsearcher) Fellowships programme,
      Belgium (03_BE) ...................................................................................... 41
3.2 SOMOPRO – South Moravian Programme for Distinguished
      Researchers, Czech Republic (05_CZ) .................................................... 43
3.3 Ambitious talent strategy for the Copenhagen Region 2014-2017,
      Denmark (08_DK) .................................................................................... 46
3.4 Thessaloniki Creativity Platform, Greece (11_EL) .................................. 49
3.5 The Talent House of San Sebastián, Spain (13_ES) ................................. 51
3.6 URBACT CHANGE! Project, Hungary (17_HU).................................... 54
3.7 Brain Back Umbria, Italy (18_IT)............................................................. 57
3.8 Brainport’s strategy for talent attraction and retention, the Netherlands
      (21_NL) ..................................................................................................... 60
3.9 Entrepreneurially Into a Business World, Slovenia (25_SI)..................... 63
3.10 WOMEN - Realising a Transnational Strategy against the brain-drain
      of well-educated young women (30_CROSS) .......................................... 65
Part 4: Recommendations ................................................................................. 71
R01. Investigate and understand the needs of talent ......................................... 71
R02. Coordinate players and synergise resources for talent-based growth ....... 73
R03. Identify and support key driving sectors for retaining/attracting talent ... 74
R04. Stimulate the absorption of outside talent ................................................. 75
R05. Mitigate/remove structural impediments/barriers to attracting
      international talents ................................................................................... 77
R06. Cooperate with other authorities facing the same challenges with
      regards to highly skilled workers .............................................................. 78
Annex I – List of references .............................................................................. 81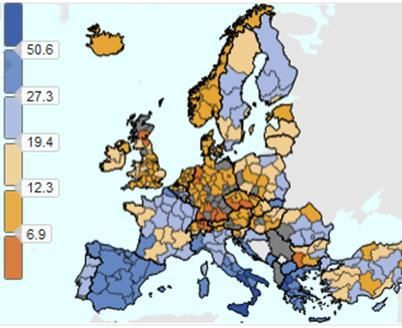
List of acronyms
CoR     European Committee of the Regions
CCIs    Cultural and Creative Industries
EC      European Commission
ERDF    European Regional Development Fund
ESPON   European Observation Network for Territorial Development and
EU      Cohesion
        European Union
EUR     Euro
GDP     Gross Domestic Product
ICT     Information and Communication Technology
ISCED   International Standard Classification of Education
LAU     Local Administrative Units
LRAs    Local and Regional Authorities
NACE    Nomenclature statistique des activités économiques dans la
        Communauté européenne (Statistical classification of economic
        activities in the European Community)
NUTS    Nomenclature of Territorial Units for Statistics
RCI     Regions and Cities Illustrated
RIS     Regional Innovation Strategy
R&D     Research and Development
R&I     Research and Innovation
SMEs    Small and medium-sized enterprises
SWOT    Strengths, Weaknesses Opportunities, Threats
USD     United States dollar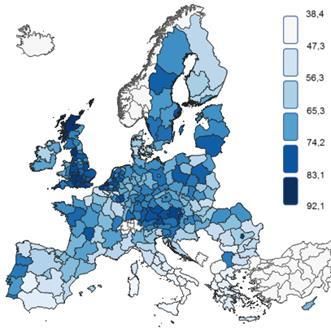
Executive summary
The free movement of workers, one of the fundamental rights enjoyed by
European citizens, has facilitated intra-EU labour mobility. However, in some
regions (‘sending regions’) this freedom has led to a significant out-migration of
their highly educated workforce to the advantage of other regions (‘receiving
regions’). This is determined by the growing competition for talent and the
limited capacity of sending regions to create attractive conditions for these
workers. Local and regional authorities (LRAs) in sending regions have to cope
directly with the socio-economic effects caused by the significant loss of talent
or brain drain. Addressing these effects may require the formulation of
appropriate policies and/or measures to retain, attract, or regain a highly
educated workforce.

In 2017, there were almost 17 million EU28 movers, of which about one-third
(32%) were in the 15-34 age bracket. The majority of EU28 movers head
towards Germany and the UK, which are also the two top destinations for
younger (15-34) European movers. Top countries of origin are Romania,
Poland, Italy and Portugal (EC-DG EMPL, 2018). In 2017, 25% of EU28
movers with a working age of between 15 and 64 have tertiary level education.
These highly educated European movers favour urban settings and northern
areas of the EU (Sweden, Ireland, Estonia, Denmark as well as several regions
in the UK). They also usually enjoy very high employment rates.

Using the data available, this study focuses on statistics at regional level
regarding cohorts of young and of highly educated EU28 movers (Part 1). It then
investigates successful local and regional level policies and/or measures used by
LRAs to tackle brain drain in sending regions through the prevention of brain
drain, the mitigation of brain drain, and the response to the negative effects of
brain drain. It also looks at ways to attract or retain talent in receiving regions.
This was done primarily by compiling an inventory of 30 initiatives undertaken
by LRAs from 22 Member States. Twenty of these initiatives are described in a
concise manner in Part 2 of the study. The other ten initiatives are developed in
the form of ‘case studies’ in Part 3. In the final part of the study (Part 4),
recommendations for LRAs are drawn from the findings highlighted in the case
studies as well as from the information gathered in all the other initiatives. These
recommendations are aimed at LRAs in sending regions and focus on outlining
measures/policies that have proved effective in some European regions. By
necessity, they are broad in nature since the transferability of these
measures/policies depends on many factors. These factors range from a region’s
policy development model (e.g. competencies of public authorities) to its
contextual conditions (e.g. labour policy and regulatory framework, economic

                                         1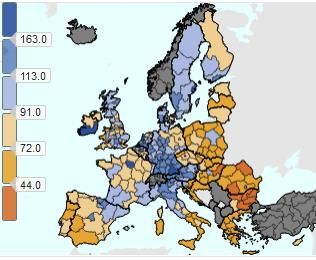
development, education system and demographic trends). In fact, there is a high
correlation between the socio-economic conditions of a region and its brain
drain/gain dynamic. Structural migration inflows, especially of young highly
skilled individuals, usually occur in regions that have a comparative advantage
and play a dynamic role in competing for international talents.

As a first recommendation (R1), it is fundamental for LRAs in sending regions
to become aware of the brain drain problem. LRAs should also identify the
talent they want/need to retain, attract or regain. Various intelligence
tools/measures can be utilized for this, ranging from SWOT and comparative
analyses to surveys. Notably, establishing a dialogue with the talent in question
appears to be essential. This is especially true for young talent. For receiving
regions, these intelligence and dialogue tools also become monitoring
instruments for measuring the satisfaction level of talent and for understanding
whether their needs are being met. A second recommendation (R2) relates to the
need for the coordination of players and the synergy of resources to focus on
talent-based growth strategies. These circumstances both occur, for example,
when a Smart Specialisation Strategy exists. Examples of other valid
instruments are physical spaces, virtual spaces, or quadruple/triple helix–based
approaches/mechanisms. Coordination among relevant players is also intended
to improve the local/regional matching of the demand and supply of talent.
Similarly, it is intended to strengthen the talent-producing capacity of a region
by nurturing its gifted youth. A third recommendation (R3) relates to the
opportunity to identify key driving sectors for retaining/attracting talent.
Examples show that the targeting of promising sectors by LRAs does not
necessarily relate to specialisation within the region. A fourth recommendation
(R4) is to stimulate the absorption of talent from outside. This could be achieved
by attracting international talent and/or regaining such talent that had previously
moved away. It may involve the setting-up of specific projects or medium-term
strategies as well as branding initiatives or initiatives aimed at rewarding talent.
A fifth recommendation (R5) is for LRAs to work on the removal of structural
impediments/barriers which may, for example, be related to infrastructure (e.g.
physical and/or technological), services and facilities, the reputation of the
locality/region and culture (e.g. gender-biased mentality). Finally, as brain gain
automatically leads to competition for the same resource (i.e. talent), it is
suggested (R6) that public authorities facing the same challenges should seek
cooperative and/or shared solutions.

                                         2
The sending/receiving status of a region can be viewed as dynamic and the
evidence of this is an incentive for LRAs in sending regions to adopt an active
approach to the intra-EU mobility of talent. Ad-hoc policies/measures
implemented locally/regionally may increase a region’s visibility and/or create
job opportunities for highly skilled workers and/or directly improve a regions’
attractiveness to talent.
3Part 1: Concise state of play of brain drain
at local and regional levels
1.1 Introduction
Brain drain is the result of growing competition for talent and is found in regions
where there are weak incentives for highly skilled workers (and students) to
remain. More specifically, the brain drain phenomenon refers to a region’s
permanent loss of skilled workers or students. Local and regional authorities
(LRAs) in these regions have to cope directly with the socio-economic effects
caused by the significant loss of talent. This may require formulating appropriate
policy and/or measures aimed at mitigating and/or preventing brain drain at
territorial levels.
In the European Union (EU), the free movement of workers is guaranteed by
Article 45 of the Treaty on the Functioning of the European Union. It is one of
the four economic freedoms to which EU citizens are entitled (together with the
free movement of goods, services and capital). This freedom has facilitated
intra-EU labour mobility. However, the uneven distribution of highly skilled
workers and the growing competition for talent has led to the brain drain
phenomena, with some regions (‘sending regions’) experiencing a significant
out-migration of their highly educated workforce to the advantage of other
regions (‘receiving regions’). Regions that attract skilled workers are more
promising in terms of labour opportunities (e.g. higher employment rates and
higher remuneration). They also may be more attractive places in which to live,
especially for young individuals (e.g. the reputation of education systems and a
good quality of life). However, the free movement of workers has not only
facilitated brain drain, it has also favoured related phenomena such as brain
regain, which is the return to a region of the same high skills and/or
competencies that were previously lost, and brain circulation, which is the
continuous gain-loss of high skills and/or competencies. These and other
mobility-related concepts used in this study are reported in Box 1.
5Box 1. Definitions used in this study
Brain drain: a region’s loss of individuals with high skills and/or competencies
(workers/students) due to permanent emigration.
Brain gain: a region’s gain of individuals with high skills and/or competencies
(workers/students) due to permanent immigration.
Brain regain: a region’s reacquisition of the same high skills and/or competencies
(workers/students) previously lost due to emigration which was supposed to be
permanent.
Brain circulation: the continuous and simultaneous gain-loss of high skills and/or
competencies (workers/students) in a region. Such high skills and/or competencies may
relate to the same or different sectors/domains.
Brain waste: the loss of high skills and/or competencies (workers/students) due to
emigration to regions where, for different reasons, such skills and/or competencies
cannot be properly exploited (e.g. highly skilled workers remain unemployed or are
employed in jobs not requiring their competencies)(Garcia Pires, 2015).
Sending regions: regions that are losing high skills and/or competencies (in one or more
sectors/domains) as a result of permanent emigration over a specific time period.
Receiving regions: regions that are gaining high skills and/or competencies (in one or
more sectors/domains) as a result of permanent immigration over a specific time period.
Permanent emigration/immigration: stable emigration/immigration which,
nevertheless, is still reversible.
EU28 movers: EU citizens who reside in an EU country other than their country of
citizenship (EC-DG EMPL, 2018).
Intra-EU mobility: the migration flows of EU28 movers within the EU borders.
Sources: the authors, unless otherwise specified.
Knowledge of the extent and type of movement by (young) highly skilled
workers makes it possible to formulate appropriate policy and/or measures
aimed at mitigating, preventing and/or reacting to the loss of human capital at
territorial level. Although statistics are becoming more and more comprehensive
and make it possible to distinguish migrating individuals on the basis of their
country of birth (for example, EU or non-EU countries), relevant data gaps still
exist at sub national level. This is especially evident when focussing on a
particular age group (i.e. young cohorts) with a specific level of education or
skills (i.e. high), as is the case in this study. Given these limitations, an
assessment of the state of play of brain drain at regional levels (NUTS2) with a
focus on highly educated talent can only be made by separate analysis of its
main components. The latest available data are presented here with regards to
the following specific aspects:
6 Migration flows at the regional level. This helps in understand the
overall demographic trend of a region (NUTS2 level), and whether it is
a sending or receiving region in terms of intra-EU mobility.
Characterisation of the mobility of young, and of highly educated
Europeans. In this study ‘highly educated’ refers to individuals with
tertiary level education (i.e. corresponding to ISCED11 levels 5-8)1.
Due to the lack of statistics allowing a further distinction, ‘highly
educated’ is considered equivalent to ‘highly skilled’.
1.2 Migration flows at the regional level in Europe
Migration of highly skilled individuals is not only driven by educational and
professional opportunities. There are many other reasons, including personal
ones, which cause people to move to another place. In addition, job-related
intra-EU migration contributes only partially to overall job-related
migration, and any region might also match its labour demand with an extra-EU
skilled workforce. The analysis of overall migration flows is primarily used to
understand whether or not a region is suffering from a population decline. The
‘crude rate of net migration plus statistical adjustment’ is the indicator that
measures this demographic change. It takes into consideration the change in
population determined by immigration and emigration as well as by live births
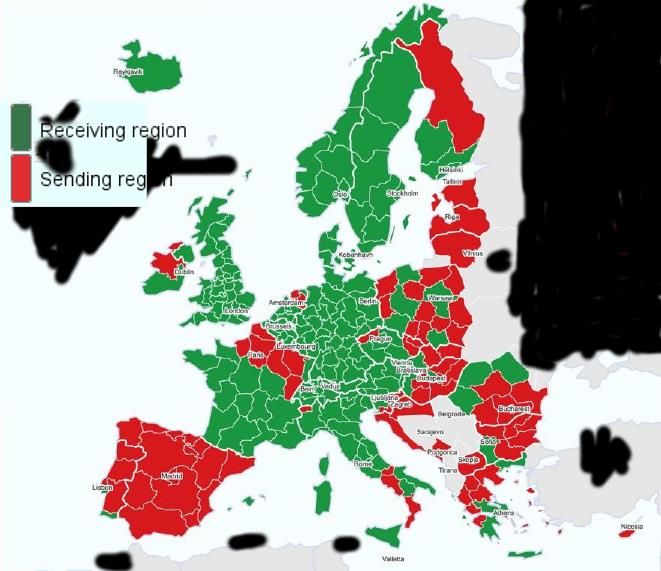
and deaths (natural change). In 2017, this indicator showed that at regional
levels in the EU (Figure 1):
Population loss occurs in most regions of Finland, Greece, Portugal and
Spain, in several regions of Italy, in north-eastern regions of France, in
most regions of Eastern European countries (including the three Baltic
states), in a few regions of central Germany, and in a few regions of
Belgium and of the Netherlands.
Population growth occurs in all regions of Austria, Luxemburg, Sweden
and Ireland as well as in Cyprus, in almost all regions of the UK, in
several regions of Germany, in several regions of Belgium and of the
Netherlands, in the southern and western regions of France, in the western
regions of the Czech Republic and in a few regions of Italy and Hungary.
Regional disparity is evident in several Member States.
1
Level 5: Short-cycle tertiary education. Level 6: Bachelor’s degree or equivalent. Level 7: Master’s degree or
equivalent. Level 8: A Doctorate or equivalent (UNESCO-UIS, 2012).
7Figure 1. Crude rate of net migration plus statistical adjustment, NUTS2, 2016
Source: Eurostat data ‘Regions and Cities Illustrated’ (RCI), based on demo_r_jind3. The indicator is defined as
the ratio of net migration during the year to the average population in that year and is expressed per 1000 persons
(EU Open Data Portal definition).
Eurostat identifies the main drivers of these demographic changes at national
levels. Population decline in Estonia and Italy is due to natural change – a
greater number of deaths than births – which is also the main cause for the
population decline in Bulgaria, Greece, Hungary, Portugal and Romania whilst
in Croatia, Latvia and Lithuania, it is mostly due to negative net migration.
Population gain is mostly determined by a greater number of births over deaths
(natural change) in Ireland, France, Cyprus and Slovakia, whilst it is mostly
determined by positive net migration in Austria, Belgium, the Czech
Republic, Denmark, Luxemburg, Malta, the Netherlands, Slovenia and
Sweden. Finally, it is only due to positive net migration in Germany, Spain,
Poland and Finland (Eurostat, 2017a).
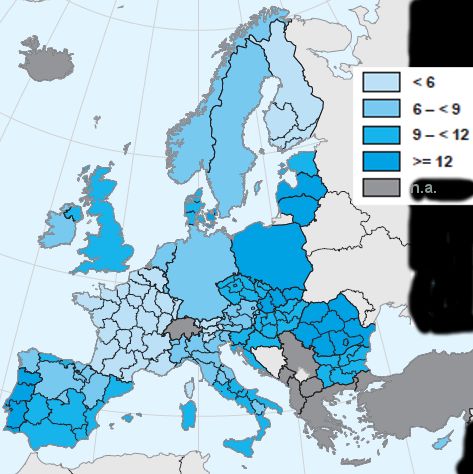
The crude rate of net migration does not distinguish the contribution made by
intra-EU mobility to overall mobility. Details on intra-EU migration flows can
be found in the results of the ESPON project, ‘The Geography of New
Employment Dynamics in Europe’. The project mapped sending and receiving
regions across the EU, concluding that, in 2014, there were 84 sending NUTS2
and 336 receiving NUTS2 in the EU28. Sending regions appear to be located in
most of Portugal and Greece, in Spain, the north-eastern parts of France, the
northern parts of Finland and Ireland, the Baltic States and in several parts of
Eastern Europe, as well as in Cyprus (Figure 2).
8Figure 2. Intra-EU mobility: receiving and sending regions, NUTS2, 2014
Source: extracted from ESPON (2017) and modified by the authors.
The project found that over a 10-year period (2004-2014) 28 regions (8%)
switched from ‘sending’ to ‘receiving’ and 60 regions (17%) switched from
‘receiving’ to ‘sending’ (Samek Lodovici, 2018). On a positive note, this
demonstrates that a region’s sending/receiving status can be viewed as
dynamic. However, it is evident that an increasing number of regions are facing
problems related to out-migration. The ESPON project also concluded that
(ESPON, 2017):
Sending regions have an average GDP per capita that is 64% of the EU28
average, whilst receiving regions have an average GDP per capita that is
108% of the EU28 average.
Migration flows follow east-west, south-north and rural-urban patterns.
Peripheral regions are mostly sending regions.
The knowledge economy is an important driver of intra-EU mobility and
in particular of the mobility of young people and of highly skilled
migrants. Regions relying on the knowledge economy (e.g. science-based
sectors, high-tech manufacturing and services) tend to be characterised by
the presence of both physical and technological infrastructures,
educational and cultural assets, good connectivity among development
players (e.g. businesses and universities) and accessibility. These regions
also provide high standards of living and good labour conditions.
9When investigating the main sectors that employ young (15-29 year old) and
highly skilled (with tertiary education) EU28 movers at regional levels, the
2011 Census database is the most comprehensive and updated source of
comparable information across the EU. The information, which covers 18 EU
countries, indicates that major employers are the ‘Wholesale and retail trade,
transportation and storage, accommodation and food service activities’ sectors
(31%). They are followed by ‘Public administration, defence, education, human
health and social work activities’ (18%) and ‘Professional, scientific, technical
administrative and support service activities’ (17%) (Figure 3).
Analysis of 2011 Census data makes it possible to identify regions (NUTS2)
where young and qualified EU28 movers prefer to relocate. It also identifies
which sectors are their major employers at regional levels. Without exception,
there is evidence that regions that are home to national capitals are the
preferred destination within each country (Région De Bruxelles-Capitale in
Belgium, Yugozapaden in Bulgaria, Praha in the Czech Republic, etc.).
Figure 3. Sectors of employment of young and highly skilled EU28 movers, 2011
Source: 2011 Census database of the European Statistical System, accessed in July 2018. No data available for
Denmark, Italy, Latvia, Finland, Germany, the Netherlands, Poland, Slovakia, Spain, and Sweden.
Using more recent information, preferred destinations across EU countries are
further detailed in the next section. Reasons for migration are further discussed
under section 1.4.
101.3 Intra-EU mobility of young and of highly educated
people
Intra-EU mobility concerns only a small percentage of Europeans. In 2017, out
of a total population of about 511 million citizens, there were almost 17 million
EU28 movers (i.e. about 3%). Two countries – Germany (33%) and the UK
(20%) – absorbed more than half of EU28 movers. Lagging far behind these top
destination countries were Spain (9%), France (7%), and a group of countries
comprising Italy, Austria, the Netherlands and Belgium (5% each). Top
countries of origin of EU28 movers were Romania, Poland, Italy and
Portugal. Germany and France also generated significant numbers of European
movers (EC-DG EMPL, 2018).
According to 2016 data, out of the 17 million EU28 movers, 3.5 million (21%)
were in the 15-29 age bracket, but when the 15-34 age group was taken in
consideration, that number rose to 5.5 million (32%). Figure 4 shows the
destination preferences of the young cohorts of EU28 movers aged between 15
and 34. Germany and the UK were also the leading destinations for the
young.
Figure 4. Destination country of young EU28 movers, by age class, 2016
Source: data are from Eurostat, migr_imm1ctz, accessed in July 2018. No data available for Austria, Greece,
Ireland, Malta, Slovenia and Romania. For the UK, the unit is not ‘Age reached during the year’ but is ‘Aged in
completed years’.
11In 2017, approximately 4.2 million of EU28 movers with a working age of
between 15 and 64 had a tertiary level of education (ISCED11, levels 5-8)2.
This represents 25% of the almost 17 million EU28 movers. The share of highly
skilled EU28 movers has been increasing regularly over the period 2014-2017,
with the largest increases being recorded, at country level, in Hungary (+51%),
Croatia (+46%), and Slovakia (+41%). In absolute terms, the highest number
of highly educated movers in 2017 was from Poland (576,300 individuals),
Germany (472,700), and Romania (467,500) (Eurostat data online, accessed in
July 2018).
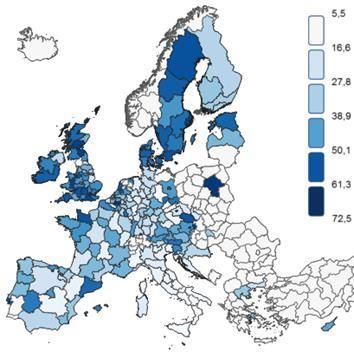
Regional distribution of highly educated EU28 movers is mapped in Figure 5.
These movers favour the northern parts of the EU (Sweden, Ireland, Estonia,
Denmark, and several regions in the UK) and urban settings. The less
attractive regions for highly educated movers appear to be mostly located in
Italy. With a few exceptions, employment rates of highly educated EU28
movers are very high across the entire EU (Figure 6). The lowest rate is found in
Campania (52.7%), Italy. The highest rate, equivalent to the full employment of
highly educated movers (i.e. 100%), is found in two Czech regions
(Severozápad and Stredni Morava), in Corsica (France), and in Lincolnshire
(UK).
Figure 5. Share of highly educated EU28 Figure 6. Employment rates of highly
movers, NUTS2, 2017 educated EU28 movers, NUTS2, 2017
Source: maps elaborated by the authors, based on Eurostat data edat_lfs_9917 and lfst_r_lfe2emprc, accessed in
July 2018.
2
This information is not available by age class.
12By comparing evidence on the preferred destinations of highly educated EU28
movers and prevailing sectors of employment at regional levels, it can also be
seen that the most attractive regions for EU28 movers are those with a high
regional employment share of the non-financial services economy (i.e.
wholesale and retail trade, transportation and storage, accommodation and food
service activities, information and communication, real estates, professional,
scientific and technical activities, administrative and support service activities)
(Eurostat, 2017b). Several of the most attractive regions are also ‘the most
specialised’ in specific NACE divisions3. For example, Inner London is the most
specialised region in ‘multimedia publishing’, ‘legal and accounting activities’,
‘activities of head offices’ and ‘advertising and market research’, whilst Praha is
the most specialised region in ‘other professional, scientific & technical
activities’ (Eurostat, 2017b).
1.4 Factors driving the mobility of highly skilled workers
Push factors causing workers’ mobility are those (unfavourable) structural
conditions (e.g. high youth unemployment) existing in a region that lead to the
emigration of human capital. Workers’ mobility pull factors are those
(favourable) structural conditions (e.g. high GDP per capita) that lead to the
immigration of human capital (Bana, 2016). According to Todisco et al. (2003),
when mobility concerns highly skilled workers, pull factors play a more relevant
role than push factors. Notably, highly skilled workers give great importance
to the types of job opportunities available. This makes their job-related
mobility to one place more likely to be temporary as it is partially
dependent on the attractiveness of the location. Even so, social and
economic structural conditions of receiving regions are amongst the most
relevant pull factors which determine the mobility of highly skilled
workers. Among these factors are active economic growth, higher wages,
robust social security, high per capita wealth, linguistic similarity, cultural
similarity, easier access to the labour market, higher employment rates (EC-DG
EMPL, 2018) and sector-specific strengths such as a well-established knowledge
economy (ESPON, 2017). Figure 7 maps examples of pull factors at regional
levels.
3
‘The Statistical classification of economic activities in the European Community, abbreviated as NACE, is the
classification of economic activities in the European Union (EU); the term NACE is derived from the
French ‘Nomenclature statistique des activités économiques dans la Communauté européenne’. Various NACE
versions have been developed since 1970. NACE is a four-digit classification providing the framework for
collecting and presenting a large range of statistical data according to economic activity in the fields of
economic statistics (e.g. production, employment and national accounts) and in other statistical domains
developed within the European statistical system (ESS)’ (Eurostat Glossary online).
13Figure 7. Examples of pull factors, NUTS2 level
GDP per capita, 2016 Youth (25-34) employment rate, 2017
Source: Eurostat data RCI, based on nama_10r_2gdp, Source: map elaborated by the authors, based on
accessed in September 2018. Eurostat data lfst_r_lfe2emprt, accessed in July
2018.
Box 2 reports on the most important pull factors identified at regional levels
within the framework of the Interreg IVC mini-programme ‘Brain Flow and
Knowledge Transfer fostering Innovation in Border Regions’ (2010-2014).
Box 2. Key factors for successfully attracting talent to the regions
The ‘BrainFlow’ project highlights a series of factors that are considered key to
successfully attracting talent to the regions. Among these factors are:
Quality of life, intended as affordability and availability of housing, cost of
living, quality of the education system and the availability of infrastructure,
leisure activities (e.g. culture), social life and a healthcare system.
Perception of the region from the outside (i.e. reputation and image).
The existence of a marketing or branding strategy that highlights the information
of interest to the talent targeted.
Labour conditions, intended as career opportunities and support for business
development (e.g. start-up incubators and office facilities).
Availability and accessibility of information on the above factors. This is
particularly important for facilitating cross border labour mobility between
neighbouring regions.
Availability of ‘welcoming services’ aimed at facilitating the relocation of talent
attracted to the region. A one-stop shop is usually the option preferred by
international migrants.
Furthermore, the project highlights how an integrated approach across the various
intervention areas, possibly coordinated by one entity, is more likely to be successful.
Source: Brain flow website and downloadable documents.
14In sending regions, negative labour market conditions (e.g. high unemployment
and low salaries) may exacerbate mobility, especially among young people, thus
becoming relevant push factors (ESPON, 2017). Among other push factors are
administrative barriers, economic depression (e.g. death of enterprises), and a
bad political environment. Figure 8 maps examples of push factors at regional
levels.
Figure 8. Examples of push factors, NUTS2 level
Youth (15-24 years) unemployment rate, Enterprise death rate
2017 in the business economy, 2013
Source: Eurostat data RCI, based on lfst_r_lfu3rt, Source: Eurostat (2017). Data relate to NACE Sections
accessed in August 2018. B–S, excluding Group 64.2.
Notwithstanding a regime of free movement of workers, impediments/obstacles
to labour mobility within the EU still exist. These obstacles are common to all
workers, regardless of their skill level. Among them, the linguistic barrier is key
(Barslund and Busse, 2014). This is demonstrated by the observed phenomenon
of higher mobility across neighbouring regions of different countries that share
the same language (EC-DG EMPL, 2018). Other obstacles include cultural
differences, lack of information on local labour demand and the absence of the
full recognition of qualifications.
151.5 The socio-economic impact of brain drain at regional
levels
Brain drain has a socio-economic impact on concerned regions. For the purpose
of this study, regions are classified into four broad types according to whether
this impact is positive or negative:
Type 1. Negative impact for sending regions.
This impact is the most researched in the academic literature on brain drain.
Among the negative effects are: reduction of the stock of human capital,
labour/skills shortage, limited capacity to innovate and adopt more advanced
technologies, labour market changes (e.g. reduction of wages), fiscal
consequences (e.g. reduction of tax income), market-size (e.g. reduction of
consumption), reduced economic growth, reduced productivity, higher costs of
public goods, and the loss of investment in human capital formation.
Type 2. Positive impact for receiving regions.
Positive effects for receiving regions include benefits such as an increase in
innovation potential, economic growth, competitive advantage and the
consumption of and demand for services (e.g. housing).
Type 3. Positive impact for sending regions.
Sending regions may also experience benefits with regards to brain drain such as
return migration, remittances, incentives for investment in education and
training and an improvement of governance (Bana, 2016).
Type 4. Negative impact for the entire system, meaning for both sending
and receiving regions.
The main effect is ‘brain waste’. This occurs when highly skilled workers
migrate to a region with bias/insufficient information on the labour/skills
demand and they end up in being unemployed or employed in a job not
requiring their high skills (Garcia Pires, 2015).
In order to make recommendations to LRAs in terms of policies/measures for
coping with brain drain, Part 2 (compilation of an inventory of initiatives
implemented by LRAs) and Part 3 (more detailed descriptions of ten of the
identified initiatives as case studies) focus on:
16 Successful initiatives that reduce the potential/actual negative
impact experienced by sending regions (Type 1) with examples of
measures/policies for addressing brain drain (i.e. prevention of brain
drain, mitigation of brain drain, and response to the negative effects of
brain drain) in order to transform it into brain regain, brain
circulation, or brain gain.
Successful initiatives that increase the current positive impact for
receiving regions (Type 2) with examples of measures/policies that
aim to facilitate brain gain (creation of brain gain and reinforcement
of brain gain).
17Part 2: Inventory of local and regional
initiatives to address the negative effects of
brain drain
The compiled inventory includes a total of 30 initiatives related to fighting brain
drain and/or favouring brain gain at the local and/or regional levels (Figure 9).
Out of these initiatives, 20 are described under this part of the study and the
remaining 10 are developed under Part 3 as ‘case studies’. The 30 initiatives
were identified on the basis of desk review of literature, documents, and web-
based information, including of EU-funded projects. Only initiatives
implemented by LRAs or by their agencies were considered. In addition, during
the selection process attention was given in order to guarantee a balanced
geographical coverage across the EU as well as a wide scope in terms of the
type of implementing public entity and of the approach used. Identified
initiatives are from 22 EU countries. They are carried out by authorities at the
local (i.e. LAU or NUTS3) and regional (i.e. NUTS2 or NUTS1) levels using a
variety of approaches, from strategies and programmes to projects and one-time
actions.
The initiatives included in this Part 2 are described using a format which reports:
Country label (the country where the initiative is implemented). The ‘CROSS’
label is used when involved authorities belong to more than one Member State.
Title of the initiative.
Implementing public authorities and/or agencies.
Target groups of the initiative.
Area type (Type 1 – sending, Type 2 – receiving) and objective of the initiative,
according to one or more of the following:
o Prevention of brain drain.
o Mitigation of brain drain/Response to the negative effects of brain drain.
o Creation of brain gain.
o Reinforcement of brain gain.
The implementation period of the initiative.
The approach used.
A short description of the initiative.
Results and/or evidence of impact.
Sources4 (websites/webpages included in the sources were all accessed over the
period July-August 2018).
4
The sources of the initiatives presented under Part 2 are indicated at the end of each initiative and are not
included in Annex I - List of references.
19Figure 9. Overview of the 30 initiatives included in the study’s inventory
Notes: Case studies are in bold print; BG = brain gain; BD = brain drain; Prev = Prevention of brain drain; Mitig
= Mitigation of brain drain; Resp = Response to the negative effects of brain drain; Creat = Creation of brain
gain; Reinf = Reinforcement of brain gain.
2001_AT: Your Region Your Future – YURA project
Authorities Regionalmanagement Südweststeiermark GmbH, a corporate
platform for the integrated and sustainable regional development
of the southwest of Styria.
Target groups Young people aged 14-30.
Area type and objective Type 1 – Prevention of brain drain; Mitigation of brain
drain/Response to the negative effects of brain drain.
Period of implementation 2010-2013.
APPROACH
Addressing the common problem of emigration of highly educated people within
the framework of European co-funded territorial cooperation.
The region of Styria is facing a shortage of scientists and technical universities graduates,
especially in the fields of mechanical engineering, electrical engineering, materials science,
metallurgy and chemical engineering. The Central Europe project ‘YURA – Developing
transnationally, transversal youth strategies for regions with migration’ was implemented with
a budget of EUR 2.02 million (of which EUR 1.58 million contributed by the ERDF) in six
regions: Saxony-Anhalt, Burgenland District, Germany; Ústí Region, the Czech Republic;
Lower Silesian Voivodeship, Poland; Northern Great Plain, Hajdú-Bihar County, Hungary;
Province of Novara, Piedmont, Italy; and Styria, South-West Styria, Austria. All these regions
shared the problem of emigration of (highly educated) young people. The aim of the project
was to develop strategies, measures and networks to keep young, qualified and highly
educated individuals in the regions. A series of pilot actions were implemented, categorised
into the following four main groups: 1) Learning Partnership - targeting better networking
between regional schools and companies and improving the cooperation between schools and
higher education facilities (e.g. universities, colleges etc.); 2) Business Academy – supporting
intellectually gifted pupils of higher educational school grades; 3) Future Laboratory –
focussing on the involvement of young people in decision-making processes for regional
development; and 4) Pupil Research Centre – aiming to develop and test vocational field-
oriented curricula and learning modules and to bring young people and regional companies
together.
During the implementation of the YURA project, 3,500 young people aged 14-30 years
IMPACT
(2,000 in the Styria region) and more than 50 companies (20 in Styria), schools and
extracurricular institutions as well as political representatives from all levels, were
involved.
Sources: Central2013.eu website; Regionalmanagement Südweststeiermark website; ISW Institut gGmbH
(2012), Project YURA: Transnational Benchmarking Study; Innovation Region Styria website.
2102_AT: Salzburg Model Region Pinzgau-Pongau-Lungau
Authorities Regional Government of Salzburg, Department of Spatial
Planning.
Target groups Young people, women.
Area type and objective Type 1 – Prevention of brain drain; Mitigation of brain
drain/Response to the negative effects of brain drain.
Period of implementation 2009-2012.
APPROACH
Preserving the region’s social cohesion and identity through pilot initiatives while
offering young people more attractive socio-economic conditions in terms of
housing and job opportunities.
The model region includes the three southern districts of province Land Salzburg. It covers an
area of 5,400 km2 and in 2010 had a population of 184,000 people. This population is ageing
and expected to change structurally in the medium term. Among the reasons for this change is
the emigration of young people who are attracted by better professional opportunities and
urban culture and lifestyle elsewhere. In order to anticipate the potential socio-economic
consequences of these demographic challenges, the region began implementing a series of
pilot initiatives aimed at preserving its social cohesion. These were part of the
DEMOCHANGE project, funded under the Alpine Space Programme. In particular, the focus
was a) on improving the quality of the location, by means of more participated housing and
spatial planning policies aimed at securing affordable houses, especially for young families;
and b) on improving labour market conditions. Job opportunities for the youth were increased
by better matching their educational careers with local labour market demand. Furthermore, a
Welcome-Service-Pinzgau was set up to fight brain drain by initiating a dialogue with the
young professionals living in the region and by actively inviting those who had already left to
return. These persons were provided with professional support to search for child care,
affordable housing and similar services.
IMPACT
According to Statistics Austria, migration in Salzburg has slightly improved in recent
years. Departures in 2017 were 15.292 against the 16.586 of 2016.
Source: DEMOCHANGE project (2011), Model Region Pinzgau-Pongau-Lungau poster.
03_BE: BEWARE (BEcome a WAlloon REsearcher) Fellowships programme
This initiative is described as a case study in Part 3.
2204_BG: Municipal Strategy of Varna
Authorities Municipality of Varna.
Target groups Young people.
Area type and objective Type 1 – Prevention of brain drain; Mitigation of brain
drain/Response to the negative effects of brain drain (+ Creation
of brain gain).
Period of implementation 2015-ongoing.
APPROACH
Confirming the municipality’s commitment towards youth and talent through the
setting of a local strategy based on partnerships with higher education institutions
as well as through the implementation of different youth-attracting activities.
Since 2010, the Municipality of Varna has been promoting the participation of young people
in the cultural and social life of the city. In 2015, as a result of its participation in the
URBACT II project ‘Partnership between Cities and Universities to Develop Sustainable City
Economies and Societies’, a ‘Municipal Strategy for cooperation with the institutions of
higher education and consolidation of Varna as an international university city’ was
developed. Under the strategic objective ‘Assisting the orientation of the local economy
towards a ‘knowledge economy’ as the main economic priority of Varna Municipality’,
expected result 2.4 focuses on the ‘Creation of preconditions to keep talented students in the
city after the completion of their higher education’. This result is tackled through: a) the
improvement of public spaces and of the overall attractiveness of Varna (including through
the organisation of major events which attract thousands of (young) participants such as the
yearly organised FUNCITY festival); b) the creation of a knowledge base of market supply
and demand of talent; and c) the enhancement of the dialogue of the municipality with
talented students. This is done by listening to the students’ feedback regarding what would
convince them to remain in the city after graduation, and by involving them as far as possible
in the activities of the municipality.
The rationale for the preparation of this strategy was the acknowledgement that
IMPACT
education, with 35,000 students yearly spending an amount equivalent to the
municipality’s annual budget, had become a significant sector for economic
development.
Sources: Municipality of Varna (2015), Municipal Strategy for cooperation with the institutions of higher
education and consolidation of Varna as an international university city.
05_CZ: SOMOPRO - South Moravian Programme for Distinguished Researchers
This initiative is described as a case study in Part 3.
2306_CY: JOBTOWN URBACT Project
Authorities City of Latsia.
Target groups Unemployed young people.
Area type and objective Type 1 – Mitigation of brain drain/Response to the negative
effects of brain drain.
Period of implementation 2013-2015.
APPROACH
Using a project framework to address youth unemployment as a cause of brain
drain and by developing partnership-based strategies.
The URBACT JOBTOWN project (total budget of EUR 709,597), aimed to address structural
youth unemployment through the establishment of Local Partnerships in 11 European cities
(Cesena, Latsia, Nagykálló, Kielce, Kaiserslautern, Thurrock, Enfield, Rennes, Avilés,
Gondomar, Aveiro). In Cyprus, the unemployment situation worsened as a result of the
economic crisis, ending up hitting the young people particularly hard: ‘2012 was the year that
was marked by the migration "explosion" of residents, which continued in 2013. Specifically,
in 2012, 18.100 residents of Cyprus (mostly young) left for abroad for a period longer than
one year. The migratory wave rose in 2013, when 25,200 people prepared their luggage
across borders’ (Latsia Municipality, 2015). Driven by city administrations and local
stakeholders in order to improve youth employment and job opportunities, the JOBTOWN
project in Latsia produced an integrated approach to the development and maintenance of a
competitive and sustainable local economy and social model. Partnership with local
stakeholders led to the identification and forecasting of the demand for skills and of the
worker profiles needed by local and regional markets. In this way job opportunities increased
as a result of better matching between supply and demand.
The JOBTOWN project produced a series of policy recommendations which are the
most significant results of three years of experience in developing responses to youth
unemployment. Among the recommendations addressed to local public authorities are
implementation of effective consultation processes; provision of support and guidance to
IMPACT
the unemployed; availability of labour market analyses and forecasts; identification of
examples of successful local approaches; clustering and coordination of those services
which address the same target groups (i.e. the ‘all under one roof’ approach); and
information spreading with regards to the professional opportunities offered by some
professions which often are perceived as unattractive because of the lack of adequate
information or of low awareness.
Sources: Goldring I. (2015), Local Approaches Doing it, Making it Work - JobTown, an URBACT Network 4
Youth Employment & Opportunity; Latsia Municipality (2015), Local Action Plan to tackle Youth
Unemployment; Goldring I. (2017), URBACT News ‘Here comes the JobTowns’; URBACT project website.
2407_DE: Chemnitz zieht an! (Chemnitz is booming!)
Authorities CWE – Economic Development Corporation, the business
development agency of the City of Chemnitz.
Target groups Highly skilled workers.
Area type and objective Type 2 – Creation of brain gain.
Period of implementation 2008-ongoing.
APPROACH
Undertaking an intermediary role in the local labour market and using online tools
to match the labour demand of local businesses with talent supply, including
through the development of initiatives specifically addressed to young people.
Chemnitz is a modern metropolis in the heart of Europe with a population of around 241,705
residents. It is one of the fastest growing cities in Germany and is characterised by a leading
position in R&D and by a high quality of life because of its excellent cultural services and a
charming natural environment. In 2008, CWE – Chemnitzer Wirtschaftsförderungsund
Entwicklungsgesellschaft mbH, the municipality’s business development agency, started an
online job platform called ‘Chemnitz zieht an!’ (Chemnitz is booming!), which helps
Chemnitz businesses looking for specialists. Two initiatives were specifically focussed on the
youngsters: 1) Chemnitz IT alliance for specialists – aimed at connecting graduates with
regional businesses; and 2) School-Business working group – acting as a platform for
exchanging information and experience among the Education Agency, the Employment
Agency, and Chemnitz’s chambers and businesses. The involvement of the municipal
business agency in the process of staff recruitment for private companies is a concept not
found anywhere else in Germany. The platform also provides information to specialists
interested in returning to their home region. Basically, the service’s target group includes
people wanting to return to Chemnitz, commuters, graduates from Chemnitz University of
Technology, and specialists having no previous connection with the city or region.
28 companies currently use the platform to place job advertisements for a wide range of
professionals, such as engineers, technical experts and software developers. In 2014,
there were 32 partner companies involved and the platform’s financing was equally
IMPACT
shared between the municipal agency and the private sector. In terms of numbers, more
than 1,700 qualified applications have been submitted to the respective companies via
the portal. Since its launch, the portal has been accessed more than 5 million times with
over 350,000 visitors, of whom half visit the platform on a regular basis. Since 2009,
more people moved to Chemnitz than moved away (Chemnitz Stadt, 2017).
Sources: Chemnitz-zieht-an.de website; CWE (2014), presentation on ‘Fachkräfteportal www.chemnitz-zieht-
an.de – ein Erfolgsmodell’; European business network website; Chemnitz Stadt (2017), Chemnitz Gute Idee.
08_DK: Ambitious talent strategy for the Copenhagen Region 2014-2017
This initiative is described as a case study in Part 3.
2509_EE: Tallinn’s Creative Strategy
Authorities City of Tallinn.
Target groups Creative people, including young talents.
Area type and objective Type 1 – Mitigation of brain drain/Response to the negative
effects of brain drain (+Creation of brain gain).
Period of implementation 2011-ongoing.
APPROACH
Designing and implementing a long-term sectorial strategy for improving the socio-
economic conditions of the territory and leveraging on the competencies of young
creative people.
Tallinn, the capital of Estonia, has about 420,000 inhabitants. A highly skilled labour force
with low wages and favourable tax regimes has attracted businesses, especially in the ICT
sector, which in turn has favoured the development of cultural and creative industries (CCIs).
Nevertheless, the city, as well as the whole country, continues to experience emigration to
Finland (where better socio-economic conditions including higher salaries are offered) and
brain drain of young and highly skilled workers, including to countries other than Finland.
The Tallinn Manifesto – a Tool for Strategic Development across the Creative Economy
(2011), the Tallinn Innovation Strategy 2009-2013, and the Tallinn Development Plan 2014-
2020, all focussed on CCIs as key elements to boost the city’s economy. Among their
priorities are mitigating brain drain, attracting talents, and attaining international visibility for
the city’s CCIs. Among the tools to achieve these goals are the Tallinn Creative Hub, a
physical space for creative people working on different activities related to new technologies,
communication, culture management, cultural tourism, and non-formal education; and the
Creative Incubator managed by the Business Support and Credit Management Foundation
(ESA), founded by the Tallinn City Council to help entrepreneurship in the city area.
In 2009, the Tallinn City Government allocated 30 million kroon (about EUR 1.9
million) for the development of the Creative Hub as one of the activities of the European
IMPACT
Capital of Culture 2011 award. In 2016, 290 events took place in the Tallinn Creative
Hub attracting some 200,000 people. Since the onset of its activities, the Creative
Incubator has hosted 170 enterprises and, at August 2018, there are 34 start-ups working
mainly in information technologies, web services, fashion, production and design.
Sources: CREATIVE SpIN-Creative Spillovers for Innovation URBACT II Thematic Network (2012), Baseline
Study; The Tallinn Manifesto (2011); Tallinn City Council (2013), Tallinn Development Plan 2014-2020; Tallinn
Creative Hub website; Creative Incubator website.
2610_EL: TRIGGER
Authorities Ministry of Macedonia and Thrace.
Target groups Young scientists.
Area type and objective Type 1 – Mitigation of brain drain/Response to the negative
effects of brain drain (+Creation of brain gain).
Period of implementation 2013-2015.
APPROACH
Cooperating in the framework of a EU co-funded project to make the cross border
area attractive to young scientists through a strong collaboration between academic
institutions and the business community.
‘TRIGGER - Transnational Initiative for guidance of graduated and entrepreneurship’ was a
project implemented within the European Territorial Cooperation Programme Greece –
Bulgaria 2007-2013. It had an overall budget of EUR 1,663,900 and was co-financed by the
ERDF and national funds of Greece and Bulgaria. The main objective of the project was the
investment on human capital for promoting economic growth through innovation in the cross
border region of Greece and Bulgaria. In practice, the project aimed at creating employment,
either in existing businesses or as self-employment. This was achieved through the creation of
opportunities derived from networking and the establishment of synergies between the
academic institutions and the business community. Businesses benefitted from the knowledge
and innovation capacity released from the academic institutions, while young scientists
benefitted from the upgrade of their skills and abilities. This in turn maximized their
possibility of entering the local labour market, thus avoiding migrating elsewhere.
IMPACT
Expected results include 200 young scientists employed in the local economy of the
Greece-Bulgaria cross border region, 30% of which are women. The Trigger ToolBox
Platform is available online at http://thetrigger-toolbox.eu as a supporting tool for
creating businesses and identifying job opportunities.
Sources: TRIGGER website; TRIGGER ToolBox; TRIGGER project (2015), Good Practices Guide On
Employment and Entrepreneurship, TRIGGER project Brochure, July 2015.
11_EL: The Creativity Platform
This initiative is described as a case study in Part 3.
12_ES: Regional Plan for Scientific Research and Technological Innovation 2016-2020
Authorities Comunidad de Madrid.
Target groups Young talented people working in R&D, in particular PhD
graduates.
Area type and objective Type 2 – Creation of brain gain; Reinforcement of brain gain.
Period of implementation 2016-2020.
APPROACH
Developing a long-term plan for the structural promotion of research and
innovation, and leveraging the effects of attracting/retaining young talents involved
in the academic world or employed in businesses.
27You can also read