The Australasian Journal of Disaster and Trauma Studies - VOLUME: 23, NUMBER 1 August 2019 - Massey University
←
→
Page content transcription
If your browser does not render page correctly, please read the page content below
August 2019

The Australasian Journal of
Disaster and Trauma Studies
 VOLUME: 23, NUMBER 1

Australasian Journal of Disaster and Trauma Studies Volume 23, Number 1

Contents:
Volume 23, Number 1

Research Papers
The low-likelihood challenge: Risk perception and the use of risk modelling for destructive tsunami
policy development in New Zealand local government
 Miles H. Crawford, Wendy S. A. Saunders, Emma E. H. Doyle, Graham S. Leonard, & David M. Johnston 3
 URL: http://trauma.massey.ac.nz/issues/2019-1/AJDTS_23_1_Crawford.pdf

Surabaya Resilience Index for potential earthquakes: An institutional perspective
 Adjie Pamungkas, Mega Utami Ciptaningrum, Lalu Muhamad Jaelani, & Data Iranata 21
 URL: http://trauma.massey.ac.nz/issues/2019-1/AJDTS_23_1_Pamungkas.pdf

 ISSN: 1174-4707
 Published by:
 School of Psychology
 Massey University
 New Zealand

 This work is licensed under a Creative Commons
 Attribution-NonCommercial 3.0 Unported License.

 Copyright notice

 1
trauma.massey.ac.nz
Volume 23, Number 1 Australasian Journal of Disaster and Trauma Studies

 the changing
 climate of
 emergency
 medicine

 Keynote Speakers
 Professor Helen Berry
 The University of Sydney, NSW

 Associate Professor David Caldicott
 Calvary Hospital, Australian National
 University & University of Canberra, ACT

 Professor Diana Egerton-Warburton
 Monash Health & Monash University, VIC

 Dr Fiona Kerr
 The NeuroTech Institute,
 The University of Adelaide & SAHMRI, SA

 R EG ISTE R N OW
 @acemonline #acem19 acem2019.com

2
 trauma.massey.ac.nz
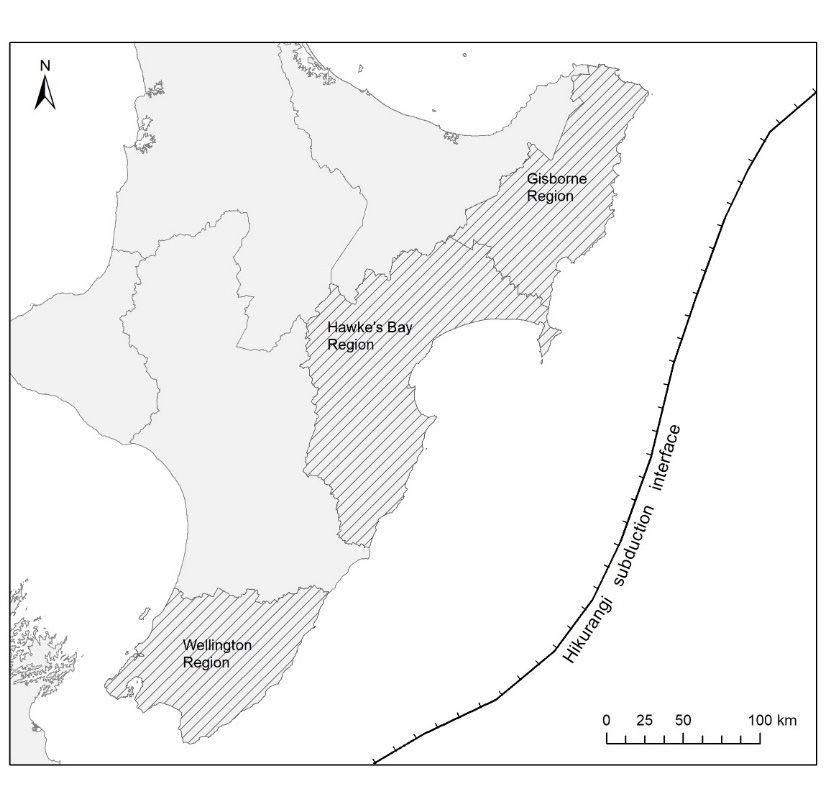
Australasian Journal of Disaster and Trauma Studies Volume 23, Number 1

The low-likelihood challenge: Risk perception and the use of risk
modelling for destructive tsunami policy development in New
Zealand local government

 match tsunami risk management policy with tsunami risk
Miles H. Crawford¹
Wendy S. A. Saunders2, 3 through further developing local government provisions
Emma E. H. Doyle1, 3 for risk management, the influence of cognitive biases,
Graham S. Leonard2
 risk modelling, and policy flexibility.
David M. Johnston1, 3
1
 Joint Centre for Disaster Research, Massey University, New Keywords: Tsunami, risk perception, policy
 Zealand. development, risk modelling, cognitive bias, local
2
 GNS Science, New Zealand
 government
3
 QuakeCoRE, New Zealand

© The Author(s) 2019. (Copyright notice) The Hikurangi Subduction Interface is capable of
Author correspondence: producing an all-of-interface megathrust earthquake
M.H. Crawford, ranging in magnitude from M7.5 – 9.0 (Power, 2013).
Joint Centre for Disaster Research,
 Figure 1 sets out the location of the Hikurangi Subduction
Private Box 756,
Wellington 6140 Interface off the east coast of New Zealand’s North
New Zealand. Island, presenting how a tsunami generated within the
Email: M.Crawford1@massey.ac.nz
 interface could affect 200-300 kilometres of the nearby
URL: http://trauma.massey.ac.nz/issues/2019-1/AJDTS_23_1_Crawford.pdf
 coast, potentially impacting on the Gisborne, Hawke’s
Abstract Bay, and Wellington regions, along with a small amount
The Hikurangi Subduction Interface, located 50 to of the Manawatu region (excluded from this study). Table
100 kilometres off the east coast of New Zealand’s 1 provides the modelled median tsunami wave heights
North Island, has the potential to generate the most and direct losses, derived using the RiskScape model
destructive tsunami New Zealand is likely to encounter (King & Bell, 2005; King & Bell, 2009), that each of
over a 1000-year timeframe. Yet, while such a severe these regions could expect from a M9.0 rupture along
risk hangs over the area, the number and detail of the length of the Hikurangi Subduction Interface.
tsunami risk management policies do not match this
risk. This article presents research on the influence
of low-likelihood on perceptions for developing
destructive tsunami risk management policy. It explores
the thoughts and opinions of natural hazard risk
practitioners in regards to tsunami risk management
policy, along with the use of risk modelling (RiskScape)
for tsunami policy development. Results highlight risk
perceptions associated with the low-likelihood of a
destructive tsunami, including such an event being
perceived as “not happening here” and the development
of tsunami risk management policy perceived as sitting
in the “too hard basket’”. We discuss how these risk
perceptions could be influenced by cognitive biases
due to their seemingly illogical nature and how risk
modelling can be used as a communication tool to help
overcome these perception challenges. We conclude Figure 1. The Hikurangi Subduction Interface and the Gisborne,
with some recommendations for how we could better Hawke’s Bay, and Wellington regions.

 3
trauma.massey.ac.nz

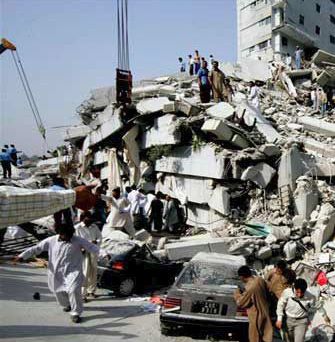
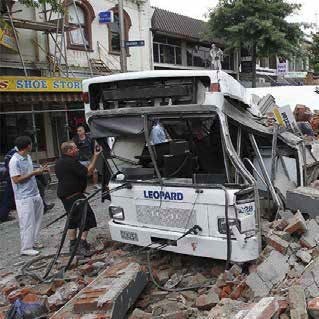
Crawford et al. Australasian Journal of Disaster and Trauma Studies
 Volume 23, Number 1

Table 1. lessons into natural hazard risk management policy
Modelled median wave height and direct losses from M9.0 rupture
on the Hikurangi subduction interface.
 (Basher, 2016; Lawrence, 2018; Local Government
 New Zealand, 2014).
 Location Wave Deaths Injuries Economic
 height (m) loss ($m) This research aims to understand how tsunami risk
 Wellington 7.4 2198 1792 5,556 management policy and procedure relates to tsunami
 Hawke’s Bay 8.4 4895 3752 5,211 risk in Gisborne, Hawke’s Bay, and Wellington. It explores
 Gisborne 8.0 982 829 1,734 practitioners’ perceptions of low-likelihood, destructive
Note. Table adapted from Gill, Clough, and Webb (2015) and tsunami, their views on tsunami risk management policy,
Horspool, Cousins, and Power (2015).
 and the use of risk modelling as a communication tool for
With such severe consequences impacting these tsunami risk management. The rest of the introduction
regions, it is understandable that tsunami have been describes the complex legislative structure for how
identified as potentially New Zealand’s most severe tsunami risk management is achieved in New Zealand
natural hazard (Department of the Prime Minister and and introduces risk modelling as a communication tool
Cabinet, 2007). However, considering the comparatively for tsunami risk management. The method section
high risk from tsunami, New Zealand spends relatively explains the mixed method approach of qualitative
little on mitigation. This is evidenced in Table 2, which interviews and document analysis used to gain a deeper
presents public spending on tsunami risk management understanding of practitioners’ views on tsunami risk
compared to other risks. management policy distribution and how tsunami policy
 is corroborated by practitioners’ perceptions of tsunami
Table 2. risk. The findings presented in the results section
Public spending on tsunami risk management compared to other
 highlight a paucity of tsunami risk management policy
risks.
 across the study area and sets out three key themes
 Event Government Average annual Spending per
 that emerged from analysis of the qualitative interviews:
 spending individual fatality unit of risk $m
 2008/9, $m risk/100,000 disassociation from tsunami risk, reduced motivation
 Assaults $122 1.3 $93.85 for developing policy, and risk modelling challenges.
 Workplace $85 4.1 $20.73 Following these results, we discuss how cognitive
 accidents biases associated with low-likelihoods influence tsunami
 Vehicle $854 9.2 $92.83 risk perceptions and challenge motivation for tsunami
 accidents
 policy development. We propose that risk modelling is a
 Tsunami $2.55 2.8 $0.910
 valuable tool that can help address this challenge. In the
Note. Table from Gill et al. (2015; p.4).
 discussion section we also provide recommendations
 for how risk modelling can work in combination with risk
Our capacity to withstand and recover from the impacts
 management, cognitive debiasing techniques, and long-
of destructive tsunami is achieved through a combination
 term planning to overcome the low-likelihood challenge
of scientific research to build our understanding of the
 for tsunami risk management policy development in
hazard and local government policy which enables
 New Zealand local government. However, we argue that
the risk to be assessed, communicated, and managed before this is achieved, fundamental challenges for how
within our communities. However, natural hazard risk natural hazard risk is governed need to be addressed.
management in New Zealand local government is
challenged by a complex legislative environment, lack Natural Hazard Risk Management, Tsunami Risk
of data, misconceptions and biases, limited resources, Management, and Risk Modelling in New Zealand
and the differing requirements of numerous actors Natural hazard risk management. We view risk as
(Crawford, Crowley, Potter, Saunders, & Johnston, “uncertainty about and severity of the consequences of
2018; Glavovic, Saunders, & Becker, 2010; Kilvington an activity with respect to something that humans value”
& Saunders, 2016; Saunders, Grace, & Beban, 2014). (Aven, Renn, & Rosa, 2011, p. 1074). Risk is managed
While the devastating impacts of recent tsunami in the through arrangements for designing, implementing,
Indian Ocean, 2004, Samoa, 2009, Japan, 2011, and monitoring, reviewing, and continually improving
Indonesia, 2018, have raised awareness and spurred activities for its control (International Organization
tsunami policy development (Johnston et al., 2014; King, for Standardization, 2009). When applied to natural
2015), local government has been slow to integrate such hazard management in New Zealand, risk management

4
 trauma.massey.ac.nz
Australasian Journal of Disaster and Trauma Studies Crawford et al.
Volume 23, Number 1

sits within a complex, interrelated system of devolved government functions which often have limited integration
legislation (Local Government New Zealand, 2014). and effectiveness for natural hazard management. This
Figure 2 sets out the relationship across New Zealand is reflected in Saunders, Grace, Beban, and Johnston’s
legislation for the management of natural hazards. (2015) review of local government natural hazards
Within this breadth of legislation, four key statutes management, where they note that collaborations
provide a framework of responsibilities for how natural across different natural hazard practitioner roles are not
hazard risk management is applied: commonly encouraged for sharing information, good
 practice, and understanding of roles.
1) The Local Government Act (LGA) – A local authority
 must manage risks to infrastructure from natural Tsunami risk management. Tsunami risk management
 hazards (Section 101B (3)(e); New Zealand sits within this challenging policy environment. While
 Government, 2002b). it would ideally be a joint responsibility across the
2) The Resource Management Act (RMA) – A local government land use planning, emergency
 local authority shall manage risks for the use, management, and building control functions, it has
 development, and protection of resources (Section historically sat within emergency management for
 6 (h); New Zealand Government, 1991).
 application (Johnston et al., 2008; Johnston et al.,
3) The Civil Defence Emergency Management Act
 2014; King, 2015; Saunders, Prasetya, & Leonard,
 (CDEMA) – A local authority shall encourage and
 2011; Webb, 2005). Webb (2005) explains that while
 enable communities to achieve acceptable levels
 all tsunami risk can be managed through land use
 of risk (Section 3 (b); New Zealand Government,
 2002a). planning arrangements, “due to a public desire to use
4) The Building Act (BA) – A local authority must coastal areas and the relatively long return period of
 manage consent for construction or alteration of damaging tsunami, regulations and land use planning
 buildings subject to natural hazards (Section 71; are in reality unlikely to provide effective mitigation for
 New Zealand Government, 2004). the entire risk” (Webb, 2005, p. 64). As such, the residual
While intending to work seamlessly together, each risk is managed through a readiness and response
piece of legislation is applied through separate local approach of public education, warning, and evacuation

Figure 2. Relationships between legislation for the management of natural hazards (The Resource Management Act Quality Planning
Resource, n.d.).

 5
trauma.massey.ac.nz
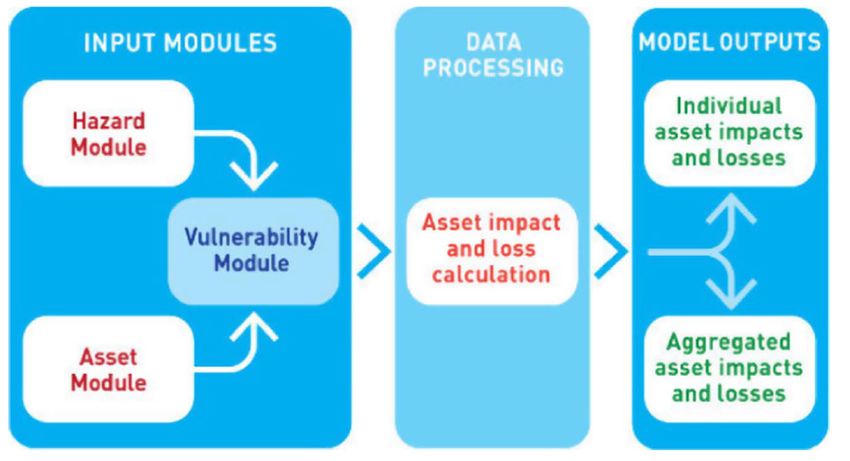
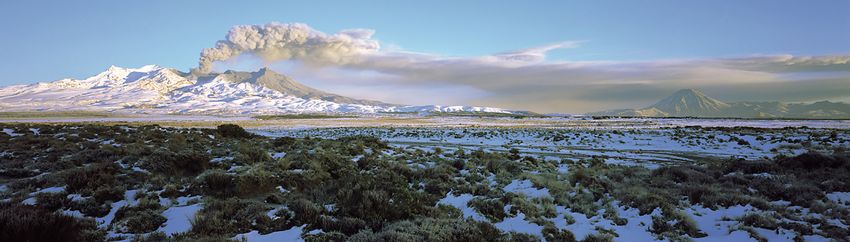
Crawford et al. Australasian Journal of Disaster and Trauma Studies
 Volume 23, Number 1

measures, which are commonly regarded as emergency are assessing risk. The RiskScape asset database holds
management functions. data on buildings but also includes data for electricity
 cables, roads, and reticulated water services. The
However, over time the growing recognition of risk
 hazard and asset data are then combined with a fragility
reduction for natural hazard management has called
 function which calculates the probability or severity of
for greater involvement of land use planning and
 damage for the asset given the intensity of the specific
building control (Beban & Saunders 2013; Glavovic
 hazard. The output is an estimated loss or consequence
et al., 2010; Saunders & Beban, 2012; Saunders et
 as illustrated in Figure 3.
al., 2015; Saunders, Forsyth, Johnston, & Becker,
2007; Saunders et al., 2011). This is reflected through
specific reference to tsunami risk management in Policy
25 of The New Zealand Coastal Policy Statement
(Department of Conservation, 2010), and also with
the recent amendments to Section 6 of the Resource
Management Act (New Zealand Government, 1991),
where the management of “significant risks” from natural
hazards is now a matter of national importance.
Natural hazard risk modelling: RiskScape. One
avenue for assessing and communicating natural hazard
 Figure 3. RiskScape modelling framework for how natural hazard
risk is through the use of risk modelling. Quantitative risk and asset modules are combined with a vulnerability module to
modelling combines deterministic or probabilistic hazard produce quantitative risk information. From Crawford, Crowley, et
 al. (2018).
models with data detailing the type and location of assets
that are exposed to the hazard, along with models that
 The results from RiskScape modelling are presented
assess the vulnerability of that asset to the hazard. The
 in spreadsheet or map form, as shown in Figure 4, and
result is an assessment of consequence, most often
 can be aggregated. The results can also be exported
depicted as economic loss, but that can also be depicted
 into geographic information system (GIS) applications
through infrastructure or societal impacts dependent
 for further application and integration with other risk
on the risk management objectives. Risk modelling
 assessment and decision-making or planning tools.
then acts as an assessment and communication tool
that presents the risk information in a way that assists
decision makers and communities to better understand
their risk and make more informed risk management
decisions (Global Facility for Disaster Reduction and
Recovery, 2014a; Global Facility for Disaster Reduction
and Recovery, 2014b; Global Facility for Disaster
Reduction and Recovery, 2014c; Pondard & Daly, 2011).
The risk modelling software used in this research is
RiskScape1. RiskScape has been developed through
scientific collaboration between NIWA and GNS
Science2 to meet the demand for a natural hazard impact
and loss modelling tool for New Zealand conditions (King
& Bell, 2009). RiskScape allows its users to assess
tsunami-related risk through existing scenarios saved
within the application, or to upload their own hazard Figure 4. RiskScape modelling results shown in map form. The
 map shows a scenario of individual building exposure to tsunami
scenario. Users then apply the hazard scenario to an inundation in Napier City following a M 8.9 earthquake generated
asset database dependent on the asset for which they in the Hikurangi Subduction Interface. The blue colours (located
 amongst the dots) represent the extent of tsunami inundation, the
1 https://www.riskscape.org.nz/
 red dots represent buildings that have been impacted by tsunami
2 The National Institute of Water and Atmosphere (NIWA) and the
 Institute of Geological and Nuclear Science (GNS Science) are New inundation, and the black dots represent buildings that have not
 Zealand Crown Research Institutes charged with promoting the been impacted. (R. Paulik, personal communication, June 06,
 transfer and dissemination of research, science, and technology. 2018).

6
 trauma.massey.ac.nz
Australasian Journal of Disaster and Trauma Studies Crawford et al.
Volume 23, Number 1

Methods tsunami warning arrangements are relatively well
 advanced, but wider risk management documentation
Risk perception is subjective, involving people’s feelings,
 is either still needed or in development.
beliefs, attitudes, and judgements about the harm and
loss associated with the consequences of an event Fifty-eight national and local policy documents were
(Aven et al., 2011; Barnes, 2001; Mileti & O’Brien, 1992; identified via a combination of internet searches
Slovic, 1987). However, it is also framed by culture and and documents provided by participants. Examples
society (Doyle, McClure, Paton, & Johnston, 2014), include The New Zealand Coastal Policy Statement
with our risk perception contextualised and informed by (Department of Conservation, 2010), The Hawke’s
local values and norms and dependent on disciplinary Bay Regional Council - Long Term Plan 2012 – 2022
frameworks (World Social Science Fellows on Risk (Hawke’s Bay Regional Council, 2012), and the City of
Interpretation and Action, 2014). As such, this research Lower Hutt District Plan (Hutt City, 2016). A full list of
is based on a social constructionist epistemology, where the documents is given in the Appendix.
our meaning of reality is informed by creating models
 The documents were analysed using deductive analysis
of the social world and sharing these models through
 in accordance with predetermined criteria (Stemler,
communication (Young & Collin, 2004). The research
 2001). Previous analyses of New Zealand local
follows a qualitative methodology, used because it
 government natural hazard policy were considered in
examines the “why” and “how” of decision making,
 determining criteria (Becker & Johnston, 2000; Glavovic
seeking to understand the depth and variety of people’s
 et al, 2010; Kilvington & Saunders, 2016; Lawrence &
feelings and perspectives, rather than quantities
 Haasnoot, 2017; Saunders & Beban, 2012), with the
and distributions as studied through a quantitative
 criteria for this study primarily based on Saunders et al.’s
methodology (Creswell, 2007).
 (2015) evaluation of the use of land use and emergency
Two methods were used in this research. Document management policy documents for natural hazards in
analysis was used to gain an overview of the extent of New Zealand local government. In their study, a plan
tsunami risk-based policy, which was then corroborated was considered to be best practice based on eight
with qualitative interviews. Qualitative interviews were indicators including hazard identification, the inclusion
used to gain a better understanding of subjective views of hazard specific rules, and the use of risk management
towards tsunami risk management policy and of risk language (e.g., consequence and likelihood). This
modelling as a communication tool. Each method is study adapted Saunders et al’s. (2015) best practice
described in the following sections. indicators to explore four objectives: the distribution
 pattern for natural hazards policies in general, the
Document Analysis distribution pattern for tsunami policies specifically, the
Document analysis is a systematic procedure for distribution pattern for risk-based policies in general, and
reviewing or evaluating documents. When used the distribution pattern for tsunami risk-based policies
qualitatively, this method requires data be examined specifically. Table 3 sets out these four objectives along
and interpreted in order to elicit meaning, gain with the predetermined criteria which inform each of
understanding, and develop empirical knowledge them.
(Bowen, 2009). Document analysis has been used in
 Limitations for this method are that relevant policy
this research to gain an overview of the distributions or
 documents or references within the documents may
patterns of local government tsunami risk management
 have been missed from the analysis. Considering 58
policy to corroborate the findings from the qualitative
 documents were analysed covering central government
interviews. It does not seek to analyse the strength or
 legislation and local government strategy and planning
significance of the policy.
 policy, we are confident that our data reached the
New Zealand national legislation, local strategy, and point of saturation (Patton, 2015), and that any missed
planning policy documents were analysed for their documents or references would not have significantly
provisions relating to natural hazards, risk management, altered the patterns identified from the analysis.
and tsunami. Documents selected were required to be
operational at the time of analysis and refer to natural Qualitative Interviews
hazard risk management within the Wellington, Hawke’s Exchange of dialogue, fluidly structured, and covering
Bay, or Gisborne regions. It is recognised that national certain issues are common features of the qualitative

 7
trauma.massey.ac.nz
Crawford et al. Australasian Journal of Disaster and Trauma Studies Volume 23, Number 1 Table 3. structured approach to the interview, to ensure that the Document analysis criteria with objectives. same general areas of information are collected from Criteria Objectives each interviewee. “This provides more focus than the The document analysed: conversational approach, but still allows a degree of • has a section on natural freedom and adaptability in getting information from the hazards Explores patterns • has a definition for natural generally associated interviewee” (McNamara, 2009). hazard with natural hazard Objective 1: Encourage participants to express their • includes natural hazard management policies. policies thoughts, feelings and experiences on natural hazard • lists tsunami as a natural risk management policy in NZ local government, hazard especially what they think are the barriers for its • refers to tsunami as potentially affecting that Explores patterns specifically focussing development, and what the enablers are. Start by district/region on tsunami hazard asking how natural hazard policy works in that Council. • includes tsunami policies management policies. Capture discussion on: • refers to tsunami inundation • Its level of importance; maps • has a definition of risk • How often policy is developed; • sets out a risk based • How policy is applied; Explores patterns management model • The local governance environment/mandate for • includes risk based policies generally associated with • links to risk management risk based policies. policy development; policies in other documents • RMA amendments to include risk focus; • refers to tsunami risk – e.g. • Risk based policy; likelihood and consequences Explores patterns specifically focussing • Tsunami risk management; and of certain magnitude events on tsunami risk based • Links across council for tsunami risk management. • includes tsunami risk based policies. policies Objective 2: Review participants’ views on the use of risk modelling software (RiskScape), compared to interview, where meanings and understandings are without the use of risk modelling. Try to elicit thoughts co-produced through interaction (Edwards & Holland, and feelings on whether they think risk modelling can 2013). Interview participants were identified and invited better communicate tsunami risk to influence decision by a gatekeeper within each region who was able maker perceptions, and willingness to engage in to transfer external information to colleagues within improved policy and procedure. Capture discussion on: their organisation (Macdonald & Williams, 1993). The • Whether risk modelling changes the way participants gatekeepers were all council staff who worked with the perceive this risk; participants of this research. The gatekeepers were • Whether risk modelling better communicates the known to the lead author of this article, who had worked risk, why and why not; with them in previous, related research (Crawford, • Whether participants think risk modelling is better Crowley, et al., 2018; Crawford, Saunders, Doyle, & at creating motivation for developing more risk Johnston, 2018). informed policy and procedure; Twenty-three participants were interviewed across the • What participants think are the barriers for the Gisborne, Hawke’s Bay, and Wellington regions, whose communication, perception, and motivation for this roles included the following functions: risk; and • policy making; • What participants think are the enablers for the • environmental science; communication, perception, and motivation for this • land use planning; risk. • building control; Each interview lasted between one and one and a half • emergency management; hours with data captured through recordings which • asset management; were transcribed and thematically analysed; thematic • engineering; and analysis “provides a flexible and useful research tool, • hazard modelling. which can potentially provide a rich and detailed, yet The qualitative interview guide used in the interviews complex account of data” (Braun & Clarke, 2006. p.5). is presented below. The guide provides a semi- Themes were identified using an inductive bottom-up 8 trauma.massey.ac.nz
Australasian Journal of Disaster and Trauma Studies Crawford et al.
Volume 23, Number 1

approach, where the themes emerge from the data itself Results
(Patton, 2015). The NVivo software package (Bazeley
 The results section is separated into two parts
& Jackson, 2013) was used to assist with the analysis,
 reflecting the two different research methods used.
categorisation, and organisation of the data into main
 The first section gives results for the policy document
themes with contributing subthemes.
 analysis, highlighting a paucity in local government risk-
Limitations for this method are that participants may based tsunami policy. The second section (including
feel uncomfortable revealing certain information, or the its subsections) gives results from the qualitative
interviews may not capture the intended data. These interview analysis, identifying three emergent themes:
were respectively managed via participants being “Disassociation and inability to internalise tsunami risk”,
assured that all data collected was anonymous and “Reduced motivation for developing destructive tsunami
pooled across locations in the study area, and through policy”, and “Risk modelling is valued but challenging”.
the guidance of the qualitative interview guide to capture
the intended data. Document Analysis

It is important to acknowledge the lead author’s own Fifty-eight central and local government policy
positionality, having worked in risk and local government documents across the Wellington, Hawke’s Bay, and
emergency management, and how this background Gisborne regions were analysed for their policies
has influenced his interpretation of the interview data relating to natural hazard, tsunami, and tsunami risk
(Landström et al., 2011; Whitman, Pain, & Milledge, management. Our findings have been grouped in
2015). When conducting the interviews, the lead author accordance with the four objectives of the document
automatically adopted the position of participant as analysis as presented in Table 3: natural hazard policy
observer (Bryman, 2008) where he interacted with distribution, tsunami policy distribution, risk based policy
the participants and expressed his own views from distribution, and tsunami risk-based policy distribution.
experiences working in local government natural hazard Table 4 presents an overview of the distribution of
risk management, while participants were also aware of natural hazard policy and risk-based policy across the
his status as a researcher. documents, both in general and specifically.

Table 4.
Distribution for natural hazard, tsunami, and risk-based policy across central and local government policy documents.

 Central Government Local Government
 Regional / Unitary District Council
 Objectives & Criteria Council
 (13 documents (17 documents (28 documents
 reviewed) reviewed) reviewed)
 Natural hazard Has a section on natural hazards 1 12 2
 management policies Has a definition for natural hazard 5 10 5
 Includes natural hazard policies 9 13 14
 Tsunami hazard Lists tsunami as a natural hazard 5 14 16
 management policies Refers to tsunami as potentially affecting 0 15 17
 that district/region
 Includes tsunami policies 2 5 2
 Refers to tsunami inundation maps 0 2 0
 Risk-based policies Has a definition of risk 2 6 1
 Sets out a risk based management model 2 8 4
 Includes risk based policies 9 12 17
 Links to risk management policies in 3 3 2
 other documents
 Tsunami risk-based Refers to likelihood and consequence for 0 1 0
 policies certain magnitude tsunami events
 Includes tsunami risk based policies 1 1 1

 9
trauma.massey.ac.nz
Crawford et al. Australasian Journal of Disaster and Trauma Studies
 Volume 23, Number 1

Table 4 shows that natural hazard management is Zealand Government, 2002a) and the National Civil
important for local government. This was stated by Defence Emergency Management Strategy (Department
participants in the interviews and is reflected by the of Internal Affairs, 2008), defining it as the likelihood
wide distribution of policy referring to general natural and consequences of a hazard. This scarcity of risk
hazard management across long-term strategic plans, definition is reflected in local government documents,
environmental policy statements, resource management with only a few defining natural hazard risk as a
plans, emergency management plans, and plans combination of likelihood and consequence of a certain
with specific focus areas such as coastal hazard magnitude hazard. Of these documents, the majority
management. The majority of resource management are emergency management plans and coastal hazard
and emergency management plans for regional councils strategies. When referring to risk, most local government
contain natural hazard-focussed sections, where long- policy documents are high-level and all-hazard, calling
term strategic plans tend not to specifically focus on for the identification, assessment, communication,
natural hazards but refer to their general management avoidance, and reduction of risks in general. While the
throughout the document. While the documents contain documents contain policy requiring the management of
policy specific to certain natural hazards, the majority risks, there is a paucity of policy setting out frameworks
of policies within and across the different document for how this is achieved. Of the documents that do
types take an all-hazards approach, where policies are contain risk management frameworks, the majority focus
designed to manage a generic range of hazards. Of on frameworks for asset management, followed by water
the specific hazard policies, the majority focus on more quality, hazardous substances, and contaminated site
frequent, experienced, and escalating hazards such as management. Only three of these documents refer to
flooding, erosion, and sea level rise. These findings are natural hazard risk management; these are contained
similar to those presented by Saunders et al. (2015). in either emergency management or coastal hazard
 management plans.
At the central government legislative level, tsunami
is listed as a hazard or emergency in the Resource Of the 58 national and local policy documents that were
Management Act (New Zealand Government, 1991), analysed, three contain specific tsunami risk-based
the Civil Defence Emergency Management Act (New policy. The New Zealand Coastal Policy Statement
Zealand Government, 2002a), the Local Government (Department of Conservation, 2010) does so at the
Act (New Zealand Government, 2002b), the New central government level, with The Tairawhiti Civil
Zealand Coastal Policy Statement (Department of Defence Emergency Management Group Plan 2016 –
Conservation, 2010), and the National Tsunami Advisory 2021 (Gisborne District Council, 2016) at the regional
 council level (as a unitary authority3) and The City of
and Warning Supporting Plan (Ministry of Civil Defence
 Lower Hutt District Plan (Hutt City, 2016) at the district
and Emergency Management, 2017). Interestingly,
 council level. Whilst some further documents contain
and somewhat problematically, is how tsunami is not
 risk-based policies specific to coastal hazards, they
listed as a natural hazard within the Building Act (New
 are generic and do not specifically relate to tsunami
Zealand Government, 2004), which instead refers to
 risk management.
the less specific description of inundation. At the local
government level, tsunami is recognised as a hazard Qualitative Interview Analysis
across the majority of the policy documents analysed.
 Disassociation and inability to internalise tsunami
While many of the documents state that tsunami could risk. Interview participants commonly used return
significantly impact their region, many rate other hazards periods to describe tsunami likelihood, ranging from 500
such as earthquake or flooding as posing a greater risk. to 3000 years. They stated that these numbers were
Of the 45 local government policy documents analysed, unrealistic, or not something they would probably see
only seven documents contain policy addressing in their lifetime. In general, participants conveyed that
tsunami management. Of those seven documents, the the likelihood of destructive tsunami was so remote that
majority of policy is general, for example “contingency its risk was hard to understand:
plans shall be implemented for emergency events such
as… tsunami” (Wairoa District Council, 2015, p. 48). It’s not been in my lifetime, why would I worry about
 it? Therefore, when you start getting shown maps it’s
The only central government documents that define risk 3 A unitary authority is a territorial authority that has the responsibilities,
are the Civil Defence Emergency Management Act (New duties, and powers of a regional council.

10
 trauma.massey.ac.nz
Australasian Journal of Disaster and Trauma Studies Crawford et al.
Volume 23, Number 1

 like the whole area’s new and it’s like...It’s not real. term policy focus, participants found it easier to talk
 (Participant). about risk management measures in place for more
 frequent, experienced hazards such as noise pollution,
While participants logically understood that a destructive
 flooding, and erosion. Participants conveyed that these
tsunami could impact at any time and that the
 hazards were more pertinent issues that policy makers,
consequences would be severe, they had difficulty
 decision makers, and the community could see every
internalising what the consequences would mean
 day, happening in front of their eyes. As such, policy
for them. Instead, participants chose to disassociate
 for managing these more frequent hazards was well
themselves from the risk, preferring to assure themselves
 understood and received greater acceptance within the
that a destructive tsunami was very rare and that a
 community. Participants stated that while tsunami was a
tsunami “won’t happen here”:
 coastal hazard, it was easier to separate tsunami from
 I think ever since the Indonesian event in 2004, and coastal hazard policy development and deal with more
 then that big follow up by what happened in Japan immediate concerns:
 in 2011, there’s a real fear and perception out there
 It’s pretty easy to deal with some short-term stuff,
 that if we get a decent tsunami it’s going to create
 you know, don’t build on that hillside because it’s in a
 devastation, huge devastation, but at the same time
 slip zone, but tsunami is… you know… you’re talking
 there is this, just this general thing “oh well but what
 about hundreds and hundreds of years, so how do
 is the chance of that happening, it won’t happen here”
 you identify what the risk is, how do you identify the
 sort of thing. (Participant).
 policy response? (Participant).
Common across participant discussions was how
 Participants also stated that the cost of implementing
important the coastal area was for their community to
 tsunami risk management policy would outweigh
use and enjoy. Many participants lived in coastal areas
 its benefits, especially when viewed in conjunction
and stated that, despite awareness of tsunami risk,
 with shorter-term planning timeframes for natural
living on the coast was preferable to living outside of a
 hazard management. They believed that while highly
tsunami inundation area:
 concentrated populations, such as Japan, may have the
 I live at Westshore, a big tsunami zone and I’m not means to reduce tsunami risk by relocating their built
 going to move. I like living on the coast. It’s worth my assets or through building large protective structures,
 while, I think, to have that enjoyment as a trade-off New Zealand did not have the population concentration
 for the risk that I think about. (Participant). or economic means to make that option realistic.
 Furthermore, participants referred to where tsunami
As such, even though the consequences of destructive
 protection walls were overtopped in the Great East
tsunami are severe, participants stated that the “un-
 Japan earthquake and tsunami of 2011, stating that
realness” of the likelihood and consequences in
 even if there were means to build protective structures,
combination with people’s affinity for living on the coast
 this did not guarantee community protection. They
meant that they are prepared to accept the risk, believing
 thought that considering the “extremely unlikely” event
that destructive tsunami will not happen to them:
 of a large, destructive tsunami, they would deal with
 People are willing to take a bit more risk around those the consequences if they occurred, rather than pay for
 areas and just accept the fact that there is tsunami, protective structures which could fail anyway.
 or these one-off major events, which have a return
 Similar to their views on the cost-benefit of applying
 period of I think, two and a half thousand years, which
 policy for tsunami protection, participants stated
 is the largest modelled one. So most people go “well
 that a precautionary policy approach for destructive
 two and a half thousand years, I’ll take my chances”.
 tsunami risk management would effectively prohibit
 (Participant).
 community development and economic benefit. Given
Reduced motivation for developing destructive that community and economic development is central
tsunami policy. Participants stated that currently to the objectives of local government (New Zealand
there was not the same degree of focus within policy Government, 2002b), prohibiting development to
frameworks to cover the extremely rare events such manage tsunami risk “just doesn’t stack up”. This is
as destructive tsunami, which are spaced out over especially relevant given that the major cities in the
hundreds or thousands of years. In-line with this short- Gisborne, Hawke’s Bay, and Wellington regions are

 11
trauma.massey.ac.nz
Crawford et al. Australasian Journal of Disaster and Trauma Studies
 Volume 23, Number 1

already located within tsunami inundation areas. valuable communication tool for community awareness
Participants stated that policy which limited development campaigns, for media use, and for increasing decision
of existing buildings in tsunami inundation areas was makers’ risk awareness.
an issue that would potentially affect too much land
 Participants also valued the ability of risk modelling
and too many assets (built and human). Given the
 to provide loss estimates for planning purposes.
low-likelihood of destructive tsunami, participants were
 They stated that the ability of modelling to tabulate
uncertain as to how policy could be developed where
 comparisons of loss, depending on differences in
the benefit from applying the policy would be greater
 exposure and vulnerability of assets, made it useful
than the cost. Participants stated that there were more
 for Section 32 analyses (New Zealand Government,
options for applying policies to manage development in
 1991), where benefits and costs, and considerations
greenfield areas where no existing building had taken
place; however, they doubted whether policies that of alternatives, are required to be considered for the
restricted greenfield development could be applied development of policies. They also referred to the value
without property developer, community, and jurisdictive of risk modelling for emergency management, where
resistance: modelled estimates of consequences can be used to
 inform readiness arrangements and pre-event recovery
 The uncertainty of tsunami risk sits in the really planning.
 hard basket when you’re looking at established
 development areas, obviously when you’re planning Almost all participants believed, especially in the case
 new ones you can take those things into account, but of low-likelihood hazards such as destructive tsunami,
 if you’re looking at managing existing areas it’s really that modelled outputs which clearly and succinctly set
 difficult. (Participant). out aggregated economic and infrastructural losses
 were beneficial for communicating risk and influencing
 It just doesn’t stack up and I doubt whether we will,
 decision makers’ risk perceptions. However, participants
 as an organisation, head to the Environment Court4
 expressed uncertainty as to whether risk modelling
 to try and fight for those provisions and I don’t think
 would actually change how decision makers would act.
 the Environment Court would be very receptive.
 Some participants told of previous experiences where
 (Participant).
 decision makers had rejected risk modelling outputs.
Because of the low-likelihood of destructive tsunami and These participants stated that officially, decision makers
the uncertainties that they entail, policy development to did not want to act because they were unsure of the
manage tsunami risk is perceived as being in the “too quality of the modelled results; whereas unofficially,
hard basket”. As such, planning and policy initiatives decision makers may not have wanted to act on the
to reduce tsunami risk are less explored. One option modelled results because of political reasons:
for better communicating low-likelihood, destructive
tsunami risk is through the use of risk modelling. I don’t think anyone politically wants to say “yeah, the
However, as pointed out in the following section, risk legacy I left in my tenure was to make sure that there
modelling comes with its own challenges when applied were protection and policies in place to hamper the
within local government. growth of a city because it exists in a tsunami zone...”
 (Participant).
Risk modelling is valued but challenging. While
some participants were not as familiar with the use of In line with this, participants held reservations over
tsunami risk modelling as others, they all agreed that risk the assumptions and uncertainties inherent within risk
modelling was beneficial, especially as it can produce a modelling. They expressed that risk modelling needed
visual representation of the risk with which people can more transparency, rather than being a “black box”, so
more easily identify. Some participants referred to the that users could see how data was manipulated within
colloquialism that “a picture is worth a thousand words”. the model and have more confidence in what it was
They added that the ability of risk modelling to spatially telling them. They expressed that the assumptions of
distribute natural hazard risks on maps made it a the models and lack of transparency were the first things
4 The Environment Court of New Zealand works to solve issues relating that get contested by decision makers and the judicial
 to the Resource Management Act 1991. The court largely deals with
 system (e.g., Environment Court) when risk modelling
 appeals about the contents of regional and district plans and appeals
 arising out of applications for resource consents. had been used in the past to defend policy proposals.

12
 trauma.massey.ac.nz
Australasian Journal of Disaster and Trauma Studies Crawford et al.
Volume 23, Number 1

Further concerns that participants had regarding risk policy documents that were analysed, only three contain
modelling was that input data, in a usable format and specific tsunami risk-based policy.
quality, was very scarce, that data generation was very This paucity of tsunami risk management policy
costly, and that their councils did not have the spare reinforces similar findings on the need for more specific
capacity or capability to support in-house risk modelling. hazard policy in New Zealand local government
Consequently, risk modelling had not yet been able to (Becker & Johnston, 2000; Glavovic et al, 2010; Local
provide the specific level of information needed to inform Government New Zealand, 2014; Saunders et al.,
detailed land use and urban planning: 2014). The tendency to refrain from developing hazard-
 The thing with planning is that it requires pretty specific risk policy in favour of an all-hazards approach
 detailed information in order to justify putting in those could be attributed to policy makers trying not to miss
 policy constraints at the end of the day. You have to hazards out, as well as resource issues pushing them
 absolutely have it backed up 100 percent because to achieve the greatest policy coverage with limited
 you will be fighting it through councils, politicians budgets. However, given the qualitative interview results
 themselves are not going to approve something where participants logically understand tsunami risk
 unless it’s fully sound. (Participant). but choose to disassociate from it, we propose that the
 paucity in specific risk-based tsunami policy could also
As such, while participants saw risk modelling as
 be attributed to cognitive biases.
beneficial, they were clear to state that it could only ever
be a support tool for decision-making. Many referred Cognitive biases are a human condition where heuristics
to risk modelling as a communication tool, capable can sometimes cause us to behave in contrary or
of conveying information in a way that influences risk seemingly illogical ways. Over 100 cognitive biases have
awareness and perception, to help start decision maker been recognised (Ehrlinger, Readinger, & Kim, 2016),
discussions for policy development: with many acting in contradictory ways to others. While
 the following discussion focusses on how cognitive
 That’s probably a nice turn of phrase “as a
 biases can influence people to under-perceive risk, other
 communication tool” because I’m a firm believer
 types of cognitive bias can influence people to over-
 that any model is there to support decision making
 perceive risk (Notebaert, Clarke, & MacLeod, 2016).
 not to make decisions. Only humans can do that in
 full judgement of the information available. So as a While the results show that participants logically
 communications tool risk modelling is still quite valid. understand that an unlikely, destructive tsunami can
 (Participant). occur at any time and that the consequences will be
 severe, their difficulty in internalising the consequences
 from such an event shows a disassociation from the
Discussion
 risk: that “tsunami won’t happen to us”. Research
 [Natural hazard preparedness] involves understanding
 has established a number of reasons for this. People
 how people construe the relationship between
 tend to have a poor understanding of low likelihoods
 themselves, the hazard and the protective measures
 (Doyle & Potter, 2015; Shoemaker 1980; Slovic,
 available to them and assisting their protective
 Fischoff, & Lichtenstein, 1982). Slovic et al. (1982)
 decision making within this socio-ecological context.
 found that people are insensitive to differences in very
 (McIvor, Paton, & Johnston, 2017. p.45)
 low probabilities and that below a certain threshold,
The results from the policy document analysis show that low probabilities are perceived as the same and tend
while natural hazard management is important for local to zero. Shoemaker (1980) stated that people either
government, there is a paucity of risk-based policy for ignore low probabilities or are unable to make rational
tsunami management. Factors contributing to this are decisions involving low probabilities. Henrich, McClure,
that the majority of policy takes a generic all-hazards and Crozier (2015) reported that people have difficulty
approach, that existing policy tends to focus on more perceiving low-likelihood disaster risk especially when it
frequent, experienced, and escalating hazards, that the is framed as a recurrence interval (e.g., 1/ 1000 years).
majority of tsunami-specific policy is unclear and non- McClure, Allen, and Walkey (2001), Khan, Crozier, and
prescriptive, and that risk-based policy is high-level and Kennedy (2012), and Baytiyeh and Naja (2016) stated
lacks reference to frameworks for how risk management that people are less likely to prepare for disasters due
would be achieved. As such, of the 58 national and local the belief that disasters are too destructive to prepare

 13
trauma.massey.ac.nz
Crawford et al. Australasian Journal of Disaster and Trauma Studies
 Volume 23, Number 1

for successfully. Fraser et al. (2016), Mileti and O’Brien • Identification of the consequences associated with
(1992), and Solberg, Rossetto, and Joffe (2010) referred the risk;
to how warning fatigue and normalisation bias can drive • Provision of alternative scenarios and
people to underestimate the risk of natural hazards. counterexamples; and
 • Use of diverse expert information.
Cognitive biases which can influence practitioners to
disassociate themselves from tsunami risk include: We propose that risk modelling can reduce the impact of
 • The Ostrich Effect: a tendency to disbelieve or ignore these types of cognitive bias and therefore support the
 something that has a negative emotional effect, even development of tsunami risk-based policy. The model
 if there is evidence to the contrary; used in the interviews (RiskScape) visually presents
 • The Optimism Bias: a tendency to underestimate information in map form, which participants found easy
 the likelihood that negative consequences will occur to understand and with which to identify. The framework
 from future threats; for the RiskScape model has been developed using
 • The Confirmation Bias: a tendency to search for, robust science (Schmidt et al., 2011), is populated
 interpret, favour, and recall information in a way with diverse expert information for hazard and fragility
 that confirms one’s own pre-existing beliefs or models (Bell, Paulik, & Wadwha, 2015; Cousins, 2015;
 hypothesis; and Kwok, 2016; Uma, 2009), and is capable of presenting
 • The Amnesia Bias: a tendency to forget too quickly modelled consequences in map form and as numerical
 the lessons of past disasters. tables.
The results show that because of the low likelihood of The results highlight how participants thought “a picture
destructive tsunami and the uncertainties they entail, is worth a thousand words”, implying that the risk
practitioners perceive that developing policy to manage model visually communicated risk in a way that they
tsunami risk sits in the “too hard basket”, which results in found more informative and easily digestible than other
a paucity of tsunami risk management policy. Cognitive traditional methods. Furthermore, even though they had
biases which can influence practitioners’ motivations not personally experienced the low-likelihood tsunami
towards developing policy include: scenario depicted in the risk model, they stated that after
 • The Myopia Bias: a tendency to focus on overly short seeing the results, they were better inclined to act on the
 future time horizons when appraising costs and the information presented. Participants also thought that the
 potential benefits of protective investments; aggregated economic and infrastructural consequences
 • The Availability Heuristic: a tendency to act on presented in the numerical tables was beneficial for
 threats which have previously been experienced, influencing decision makers’ risk perceptions. As such,
 or are easy to imagine; participants agreed that the ability of RiskScape to
 • The Inertia Bias: a tendency to maintain the communicate consequences visually and numerically
 status quo or adopt a default option when there is could help reduce misperceptions associated with a
 uncertainty about the potential benefits of investing tendency to forget the lessons from similar disasters or
 in alternative protective measures; and underinvest in risk reduction measures. Participants also
 • The Bandwagon Effect or Groupthink: a tendency valued the ability of RiskScape to provide alternative
 for people to do something primarily because other scenarios. While this enables them to perform cost-
 people are doing it, regardless of their own beliefs, benefit analyses for different risk reduction measures,
 which they may ignore or override. it also provides more certainty around investing in those
 measures, thus enabling decision makers to move past
The types of cognitive biases that influence policy
 biases associated with maintaining the status quo.
development for low-likelihood, destructive tsunami
are difficult to overcome. This is because these biases However, even though participants see risk modelling
tend to be resistant to logic, deconstruction, or the use as beneficial for communicating past cognitive biases
of training tools (Montibeller & von Winterfeldt, 2015; and risk perceptions for low-likelihood tsunami, this
Weinstein & Klein, 1995). Debiasing measures that has not yet been achieved. Concerns relating to data
can improve decision maker risk perceptions include availability, quality and cost, the capacity and capability
(Montibeller & von Winterfeldt 2015; Parkhurst, 2017; to use risk models, and trust in modelled results mean
United States Government, 2009): that modelling is not widely used in New Zealand local
 • Clear, easily digestible communication of the risk; government (Crawford, Saunders et al., 2018). Also

14
 trauma.massey.ac.nz
Australasian Journal of Disaster and Trauma Studies Crawford et al.
Volume 23, Number 1

of concern are participants’ views that while decision 3) Co-develop risk modelling through a bottom-up,
makers may correctly perceive the risks communicated participatory approach to enhance the usefulness
through risk modelling, they may not act upon them for and usability of the models (Newman et al., 2017).
political reasons. This approach would enable local government
 users to influence model development so that
Recommendations models can process a wider range of data formats
 (therefore increasing data availability), have a
This research reveals a number of challenges for low-
 more intuitive user interface, and have increased
likelihood, destructive tsunami risk management:
 quality of information output (Global Facility for
 • A paucity of tsunami risk based policy;
 Disaster Reduction and Recovery, 2014a; Global
 • Cognitive biases influencing tsunami risk perception;
 Facility for Disaster Reduction and Recovery, 2016).
 • Challenges for how easily risk modelling can be
 This would tie in with initiatives to increase local
 used within local government; and
 government understanding of risk management
 • Concerns about decision maker motivation to enable
 so that practitioners and decision makers have a
 tsunami risk management policy development.
 better understanding of the capability and value
As such, we recommend the following solutions to further of risk models and greater confidence in modelled
develop a pathway forward for how local government information.
could better match tsunami risk management policy with 4) Review the flexibility of natural hazard policy
low-likelihood, destructive tsunami risk: instruments to enable policy for low-likelihood
1) Further resource national risk management hazards that have intervals over thousands of
 initiatives, for example the Local Government Risk years, thus providing a way forward for long, long-
 Agency5, to better enable the development and term planning instruments (Lawrence et al., 2015).
 application of natural hazard risk management These long, long-term planning instruments could
 frameworks within local government. This could operate outside of shorter-term planning cycles and
 be achieved through structured collaboration and apply policy across 100 – 500 years, incrementally
 training across the different local government reducing community exposure and vulnerability to
 functions responsible for natural hazard risk natural hazards over generations. A long, long-term
 management (Crawford, Saunders et al., 2018; plan would separate low-likelihood, destructive
 Saunders et al., 2014). One option is regular risk tsunami risk management from the more immediate
 management workshops to assess risks and what political, financial, and community development
 can be done to reduce them. The result is a shared issues which currently influence decision makers to
 understanding of each other’s risk management perceive it as sitting in the “too-hard-basket”.
 roles (Doyle & Paton, 2018), greater integration Furthermore, we propose that these challenges arise
 across functions, and an improved ability to develop from more fundamental issues relating to how natural
 specific risk-based policy for destructive tsunami, hazard risks are governed in New Zealand and other
 rather than an all-hazard policy approach. countries. When discussing this with practitioners in the
2) Include debiasing techniques as part of natural interviews, they referred to:
 hazard risk management workshops so that • A complex natural hazard management legislative
 practitioners and decision makers are better environment;
 informed about how innate cognitive biases • Limited national-level clear, structured guidance;
 influence their perceptions that destructive tsunami • Lack of any mandate within local government to lead
 “won’t happen here”. While increased awareness of cross-council natural hazard management functions;
 cognitive biases may not change risk perceptions, • Misperception or lack of integration across natural
 it provides greater context when considering hazard management functions;
 how acceptable the risk information is, allowing • The scarcity of available natural hazard data and
 practitioners and decision makers to make more information;
 informed decisions. • A disconnect between science and policy;
5 Local Government New Zealand (LGNZ) has proposed a Local • Mismatched policy and planning timeframes across
 Government Risk Agency that pools and coordinates local government
 resources to lower the risk and cost of disaster. https://www.lgnz.co.nz/
 land use planning, emergency management, building
 our-work/local-government-risk-agency/ codes, and local government responsibilities;

 15
trauma.massey.ac.nz
You can also read