HSI targets 30,000 on post-pandemic recovery - Strategy Report
←
→
Page content transcription
If your browser does not render page correctly, please read the page content below

Strategy Report

         HSI targets 30,000 on
         post-pandemic recovery

PLEASE READ THE ANALYST CERTIFICATION AND IMPORTANT DISCLOSURES ON LAST PAGE   1
22 Dec 2020

Contents

     2021 China Economic Outlook .................................................................................3
     2021 HK Market Outlook ...........................................................................................5
     China Internet (OUTPERFORM) ...............................................................................7
     China Technology (OUTPERFORM) ........................................................................9
     China software & IT services(OUTPERFORM) .....................................................11
     China Consumer Staples (OUTPERFORM) ...........................................................12
     China Consumer Discretionary (OUTPERFORM).................................................13
     China Education (OUTPERFORM) .........................................................................19
     China Banking (OUTPERFORM) ............................................................................20
     China Insurance (OUTPERFORM)..........................................................................22
     China Brokerage (OUTPERFORM) .........................................................................24
     China Property (OUTPERFORM) ............................................................................26
     China Construction Machinery / Commercial Vehicles (OUTPERFORM).................33
     China Solar Power Equipment (OUTPERFORM) ..................................................36
     China Solar (OUTPERFORM)..................................................................................38
     China Wind (OUTPERFORM) ..................................................................................43
     China Gas (OUTPERFORM) ....................................................................................48
     China Express Delivery (MARKET PERFORM).....................................................56
     China Auto (MARKET PERFORM)..........................................................................58

PLEASE READ THE ANALYST CERTIFICATION AND IMPORTANT DISCLOSURES ON LAST PAGE                                               2
22 Dec 2020
2021 China Economic Outlook
Economist: Wenjie DING, PhD – dingwenjie@cmbi.com.hk
Growth spurred by both demand and supply
Key macro themes in 2021
1) Demand-side catchup. While production resumed faster in time of COVID-19 this year,
the demand-side lagged behind. There remains sizable room for improvement in 2021
regarding consumption and service sector development as economic growth picks up.
2) Unbalanced recovery. In post-pandemic period, divergence shows up between
sectors, industries and various participants of the economy. For example, traditional
industries (or the old-economy sectors) may straggle from slower rebound; medium
and small firms face greater challenges and low-income households are likely to suffer
from more negative wealth shocks.
3) Evolving US-China relations. While in the near term, US and China may find more
common ground for cooperation and tariff wars may cease, strategic competition
prevails in the longer run. The U.S. may reestablish its ties with allies under the Biden
Administration and pressure China using multilateral mechanisms.
We forecast real GDP to grow 8.8% YoY in 2021
Consumption expansion to accelerate
We believe consumption will be one of the primary drivers of economic recovery in 2021
thanks to gains in employment and wage, and alleviating pandemic impact on consumer
behaviors. We believe expenditures on service and durable goods are likely to rebound to
a greater extent given this year’s low base and more positive anticipation for future income
growth.
Investment may strengthen further
Manufacturing investment likely beat, on back of 1) demand recovery in both domestic
and overseas markets, 2) growing profit of manufacturing firms, 3) supportive policies for
high-tech & emerging industries, and for R&D activities.
Infrastructure investment will keep its pace. Without the pandemic and disastrous
weather conditions impeding construction progress, infrastructure investment may record
higher YoY growth in 2021. We also expect incremental growth coming from New
infrastructure and green energy projects.
Real estate investment likely edge down. Housing sales and new house starts are
stabilizing and may lack rebound momentum. Land transaction also cooled due to
tightening financing criteria for developers. Both would weigh on real estate investment in
2021.
Trade
Trade would rebound on global recovery in 2021. We forecast export and import to increase
10% and 8% YoY, respectively. RCEP countries are playing a more important role,
accounting for 27.0%/37.7% of China’s export/import in Jan-Nov 2020.
PLEASE READ THE ANALYST CERTIFICATION AND IMPORTANT DISCLOSURES ON LAST PAGE 3
22 Dec 2020
Inflation
We expect firming up of core CPI and PPI in 2021 on back of demand recovery across the
economy and increase in oil prices. Food price growth may decelerate due to less
contribution from pork, thereby weighing on headline CPI growth. PPI growth would return
to positive growth trajectory at the end of 1Q21 according to our estimates.
RMB
We expect RMB appreciation against USD to continue into 2021, since 1) China’s
economic delivery is more visible and on a clearer path; and 2) PBoC is progressing
prudently toward normalization, thus keeping interest rate spread between China and the
U.S. at relatively high levels.
However, we expect the appreciation trend would be modest and USDCNY could fluctuate
within a wider band, namely 6.40-6.70. First, monetary authorities in China are reluctant to
see rapid appreciation of RMB. Second, promising economic rebound of the U.S. and
tensions between the two nations may weaken RMB against USD.
Post-pandemic policies - steady normalization and accurate support
In post-pandemic period, monetary and fiscal policies will gradually return normal on
condition that they continue to support economic development and provide insurance
against future risks. While ensuring credit supply, monetary expansion would slow down.
We expect M2, RMB loans and TSF to increase 9.2%, 11% and 11.4% YoY, respectively,
in 2021. On the fiscal front, we expect moderate dialing back of stimulus. But given still
divergent and imbalanced recovery across entities, we think structural and accurate fiscal
supports should last for a longer period of time.
Figure 1: Forecast of major economic indicators
2017A 2018A 2019A 2020E 2021E
Real GDP (YoY growth, %) 6.9 6.6 6.1 2.3 8.8
Nominal GDP (YoY growth, %) 11.2 9.7 7.8 2.7 10.1
CPI (YoY growth, %) 1.6 2.1 2.9 2.9 1.3
PPI (YoY growth, %) 6.3 3.5 -0.3 -2.0 1.2
Value-added industrial output (YoY growth, %) 6.6 6.2 5.7 2.4 8.7
Fixed asset investment (YTD YoY growth, %) 7.2 5.9 5.4 2.6 7.4
Infrastructure 19.0 3.8 3.8 1.0 7.0
Manufacturing 4.8 9.5 3.1 -3.2 9.4
Real estate development 7.0 9.5 9.9 6.8 4.5
Retail sales (nominal, YoY growth, %) 10.2 9.0 8.0 -3.0 13.0
Export (in USD, YoY growth, %) 7.9 9.9 0.5 2.0 8.0
Import (in USD, YoY growth, %) 15.9 15.8 -2.8 -1.1 10.0
M2 (YoY, %) 8.2 8.4 8.7 10.4 9.2
Total social financing (TSF) balance (YoY %) 13.4 9.8 10.7 13.8 11.4
RMB loans outstanding (YoY, %) 12.7 13.5 12.5 12.9 11.2
1-year LPR (%) 4.30 4.31 4.15 3.85 3.85
5-year LPR (%) n/a n/a 4.80 4.65 4.65
1-year MLF operating rate (%) 3.25 3.30 3.25 2.95 2.95
USD/CNY (range) 6.46-6.96 6.26-6.97 6.68-7.18 6.60-7.10 6.40 -6.70
USD/CNY (end of period) 6.51 6.88 6.96 6.60 6.50
Fiscal deficit ratio (%) 3 2.6 2.8 3.7 >3.0
Local government special bond (RMB tn) 0.91 1.35 2.15 3.75 >3.0
Source: Company data, CMBIS estimates
PLEASE READ THE ANALYST CERTIFICATION AND IMPORTANT DISCLOSURES ON LAST PAGE 4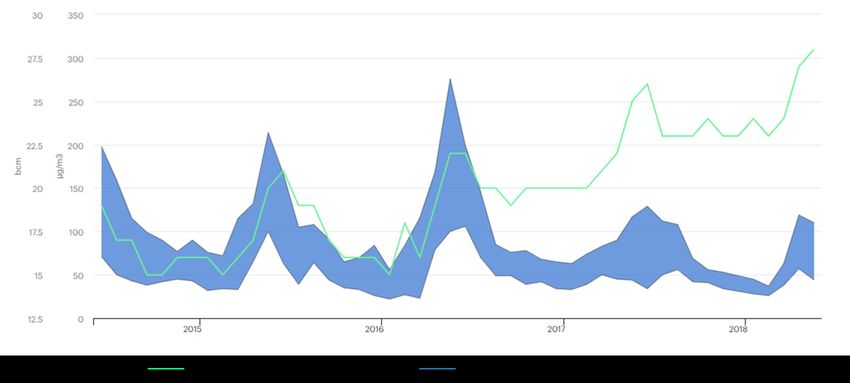
22 Dec 2020
2021 HK Market Outlook
Strategist: Daniel SO, CFA – danielso@cmbi.com.hk
Value stocks to catch up in medium term;
Growth stocks still prevail in the long run
Vaccination strengthens the case for global recovery
There have been a series of positive news of COVID-19 vaccines since Nov 2020, and
some countries have already begun vaccination. For months investors have been looking
forward to a global economic recovery, and mass vaccination is strengthening the case for
a strong recovery. Major central banks are going to remain highly accommodative in 2021.
Cyclical indicators such as PMIs, copper price, shipping rate, as well as inflation
expectations have been rebounding strongly. Corporate earnings are expected to follow
suit, with consensus forecasting ~20% earnings growth in the U.S., China A-shares and
HK stock markets.
Figure 3: China PPI slightly leads HSI earnings
Figure 2: HSI yearly earnings growth
Source:Bloomberg, CMBIS Source:Bloomberg, CMBIS
Strong CNY bodes well for HK stocks’ earnings and valuation
We expect CNY to stay strong and appreciate mildly against the USD in 2021. A strong
CNY typically boosts the earnings of HK stocks / H-shares, and also support their
valuations.
H-shares attractive as AH premium surged to decade-high
A-shares’ premium over H-shares have surged to over 40%, a decade high. When AH
premium is relatively high (>25%), Southbound net buying tends to increase and help H-
shares’ performance. History also suggests that when AH premium was high, the
probability of H-shares outperforming A-shares in the next three months increased slightly.
PLEASE READ THE ANALYST CERTIFICATION AND IMPORTANT DISCLOSURES ON LAST PAGE 5
22 Dec 2020
Figure 4: HSCEI earnings positively correlated with Figure 5: Southbound net buying tends to be higher
CNY strength when A/H premium is high
Source:Bloomberg, CMBIS Source:Bloomberg, CMBIS
Index target ranges:HSI 23,600 – 30,000,HSCEI 9,200 – 12,000
We apply a target P/E range on both the HSI and the HSCEI, based on an average of
2021E and 2022E consensus earnings, as we believe investors would look through the
unusually low earnings in 1H 2021 which would still be heavily affected by the pandemic.
The low end of the P/E range of the HSI is set at 10.0x, slightly higher than the trough levels
9.5x in the past decade, as the HSI has recently included more growth stocks such as
Alibaba (9988 HK), Meituan (3690 HK), Xiaomi (1810 HK), and thus should enjoy a higher
P/E multiple.
Figure 6:HSI & HSCEI target ranges
Consensus earnings CMBIS target Index target*
2020E 2021E 2022E P/E range
HSI 1,854 2,204 2,523 10.0 – 12.7 23,600 – 30,000
HSCEI 995 1,127 1,271 7.7 – 10.0 9,200 – 12,000
Source:Bloomberg, CMBIS *based on average of 21E & 22E earnings
Sector rotation: Value stocks to outperform in Q1/1H 2021
We believe value stocks (aka cyclical / old-economy stocks) is more likely to outperform in
1H 2021, as they are more sensitive to economic cycles, and thus usually stage a stronger
rebound after an economic recession and during the first phase of recovery.
However, beware of a potential pullback in the broad market in Q2 2021, as both the U.S.
and HK stock markets typically had corrections in the fourth quarter of economic recovery.
Given the global economic began recovery in Q3 2020, Q2 2021 could be a tricky period.
Looking further ahead, when the pandemic’s impact fades away, and economic growth
returns to a more normal level, investors would probably still prefer growth stocks which
have higher growth and earnings visibility. Seize any pullback opportunities during mid-
2021 to accumulate structural growth stocks such as internet giants and top consumer
brands.
PLEASE READ THE ANALYST CERTIFICATION AND IMPORTANT DISCLOSURES ON LAST PAGE 6
22 Dec 2020

 China Internet                                                   OUTPERFORM

                                        Analysts: Sophie HUANG – sophiehuang@cmbi.com.hk
                                                          Miriam LU – miriamlu@cmbi.com.hk

   Eyes on structural opportunies
Evolving and Expanding: Three themes to see
Internet sector benefit from "stay-at-home effect", with rising MAU & time spent shift from
offline entertainment and consumption. Noted that net adds of Internet users in 1H20
exceeded that of 2019. In post-epidemic period, we expect sector to ride on the following
structural changes: 1) younger generation: rising ACG culture and experiential
consumption with Gen Z to become the mainstream traffic. 2) video-content penetration:
ads and streaming media shift toward video-based content, and short videos continued to
gain share in time spent. 3) lingering regulatory: as China celebrates the 100th
anniversary of CCP's founding in 2021, tightening regulation on pan-entertainment industry
would continue. We expect the anti-trust law on platform economy to optimize competition
landscape and promote healthy development in the long run.

We expect 2021 eyes on three themes: short videos, community group-purchase, and
industrial Internet. 1) Short videos to continously gain traction: we expect 2021 to
embrace a wave of short video listings. Apart from user & content expansion, short videos
will accelerate diversified monetization (e.g. ads, livestreaming, e-commerce, etc),
indirectly affecting those subsectors' competitive landscape. 2) community group-
purchase TAM to be unlocked: bullish on TAM of CGP, and expecting CGP to be next
growth enginer for ecommerce/lifestyle players. Stepping-up investment continues, and
supply chain & fullfilling capability would be key factors. 3) Industrial Internet to embrace
real economy: Internally, competition focus gradually shifts from traffic to supply side
resources (e.g. logistics, supply chain); externally, 2B business models (e.g. cloud, FinTech)
continue to penetrate with tech upgrade.

Subsectors: Solid ecommerce & entertainment; ads recovery in sight
Ecommerce: We reiterate our confidence on ecommerce secular growth, backed by
structural benefit from COVID-19, low-tier cities penetration, livestreaming initiatives and
enhanced monetization. Despite short-term headwinds from anti-trust laws, ecommerce’s
long-term organic growth keeps intact. We like Meituan (3690 HK, BUY) and Pinduoduo
(PDD US, BUY), given solid results and expanding TAM of community group-purchase.

Entertainment: We expect entertainment momentum to continue, with enhanced
momnitization (e.g. price hike of online video platforms) and Gen Z’s potential. With game
& online video industrial growth tapering off, we believe content matters more to users,
than traffic or subsidies. More eyes on short-video ecosystems and Gen Z’s opportunities.
Our top pick is Bilibili (BILI US, BUY), given faster growth, sizable young users, enhanced
monetization and multiple catalysts.

Advertising: With gradual macro recovery, ads would bottom out, supported by rising ads
demand, enriched ads format and higher ROI with algotithm optimization. Suggest to eyes
on Tencent (700 HK, BUY), Baidu(BIDU US, BUY) and Bilibili.

PLEASE READ THE ANALYST CERTIFICATION AND IMPORTANT DISCLOSURES ON LAST PAGE                     7
22 Dec 2020
Figure 7:CMBI coverage of Chinese Internet companies
Stock CMBI CMBI Makt cap EPS PE (Based on TP) EPS
Company Ticker Currency Upside PEG
price TP rating (US$ mn) FY1E FY2E FY3E FY1E FY2E FY3E CAGR
Tencent 700 HK HKD 577.5 669.0 BUY 16% 713,511 12.8 15.9 19.2 45.0 36.1 29.9 23% 1.60
Alibaba BABA US USD 260.0 358.6 BUY 38% 703,466 66.9 80.9 99.5 35.7 29.6 24.0 22% 1.35
Baidu BIDU US USD 192.7 173.0 BUY -10% 65,722 63.1 66.0 75.9 18.3 17.5 15.2 10% 1.81
Pinduoduo PDD US USD 149.4 160.0 BUY 7% 183,819 -2.2 2.6 9.5 NA 415.4 112.6 22% 1.44
Meituan 3690 HK HKD 279.8 348.0 BUY 24% 212,487 1.0 2.3 4.4 300.8 127.8 67.6 111% 1.15
Bilibili BILI US USD 84.7 61.7 BUY -27% 29,421 -7.7 -4.9 0.2 NA NA 1788.4 NA NA
YY YY US USD 82.3 130.0 BUY 58% 6,663 27.2 32.8 45.0 31.8 26.4 19.2 29% 0.92
Momo MOMO US USD 13.8 15.5 HOLD 13% 2,872 11.5 12.3 14.5 9.0 8.4 7.1 12% 0.68
Tongcheng-Elong 780 HK HKD 14.9 19.0 BUY 28% 4,178 0.46 0.87 1.10 35.7 18.7 14.9 55% 0.34
FriendTimes 6820 HK HKD 2.0 4.0 BUY 102% 557 0.2 0.3 0.4 14.1 10.8 9.3 22% 1.44
CMGE 302 HK HKD 3.1 4.4 BUY 43% 991 0.3 0.4 0.5 10.8 8.6 7.5 20% 0.42
Duiba 1753 HK HKD 2.4 4.1 BUY 74% 328 0.6 0.5 0.4 6.1 7.8 9.0 -18% -0.44
Perfect World 002624 CH CNY 27.8 48.9 BUY 76% 8,231 1.3 1.5 1.8 37.8 31.8 26.5 19% 1.64
Sanqi Interactive 002555 CH CNY 28.3 30.0 BUY 6% 9,122 1.4 1.6 1.9 22.0 18.5 15.6 19% 1.00
Average 24.2 19.5 16.2 33% 1.12
Source: Bloomberg, CMBIS, as of 21 Dec 2020
Figure 8:Internet peers valuation
Company Ticker Mkt.Cap Rating TP Currency Price P/E P/S EV/EBITDA FY20-22 FY20-22
(USD mn) FY20E FY21E FY22E FY20E FY21E FY22E FY20E FY21E FY22E EPS PEG
Leaders
Tencent 700 HK 713,511 BUY 669 HKD 578 38.1 30.6 25.4 12.4 9.6 7.8 34.9 27.1 22.3 23% 1.36
Alibaba BABA US 703,466 BUY 359 USD 260 25.5 21.1 17.1 6.6 5.0 4.2 20.6 16.3 13.4 22% 0.96
Baidu BIDU US 65,722 BUY 173 USD 193 20.0 19.1 16.6 4.0 3.5 3.1 13.7 12.3 10.4 10% 1.98
JD JD US 127,586 NR NA USD 82 49.5 34.8 24.7 1.1 0.9 0.8 35.3 24.3 17.3 42% 0.84
Meituan 3690 HK 212,487 BUY 348 HKD 280 237.6 101.0 53.4 12.2 8.0 6.0 150.3 71.4 40.8 111% 0.91
Pinduoduo PDD US 183,819 BUY 160 USD 149 NA 381.0 103.3 23.2 14.8 10.8 NA 804.6 85.3 NA NA
NetEase NTES US 65,502 NR NA USD 95 25.7 22.1 19.0 5.8 4.9 4.3 20.7 17.8 15.1 16% 1.36
Average 31.8 25.5 20.6 9.3 6.7 5.3 45.9 139.1 29.2 37% 1.24
Ecommerce
Alibaba BABA US 703,466 BUY 359 USD 260 25.5 21.1 17.1 6.6 5.0 4.2 20.6 16.3 13.4 22% 0.96
JD JD US 127,586 NR NA USD 82 49.5 34.8 24.7 1.1 0.9 0.8 35.3 24.3 17.3 42% 0.84
Pinduoduo PDD US 183,819 BUY 160 USD 149 NA 381.0 103.3 23.2 14.8 10.8 NA 804.6 85.3 NA NA
Vipshop VIPS US 17,170 NR NA USD 25 19.7 16.2 13.9 1.1 0.9 0.9 14.0 11.5 8.8 19% 0.85
Baozun 9991 HK 2,956 NR NA HKD 93 15.3 11.0 9.1 2.1 1.7 1.4 24.4 17.3 13.3 30% 0.37
Average 27.5 92.8 33.6 6.8 4.7 3.6 23.6 174.8 27.6 28% 0.75
OTA
Ctrip TCOM US 20,526 NR NA USD 35 NA 38.0 22.4 7.3 5.0 3.7 786.8 39.5 20.5 NA NA
Tongcheng-Elong 780 HK 4,178 BUY 19 HKD 15 27.4 14.4 11.5 4.5 3.1 2.5 17.5 9.4 7.4 55% 0.26
Average 27.4 26.2 16.9 5.9 4.0 3.1 402.1 24.5 13.9 55% 0.26
Game
Tencent 700 HK 713,511 BUY 669 HKD 578 38.1 30.6 25.4 9.6 7.8 6.5 27.1 22.3 18.6 23% 1.36
NetEase NTES US 65,502 NR NA USD 95 25.7 22.1 19.0 5.8 4.9 4.3 20.7 17.8 15.1 16% 1.36
Kingsoft 3888 HK 7,419 NR NA HKD 42 11.4 35.5 27.3 8.5 6.9 5.8 14.3 12.5 10.6 -35% -1.00
IGG 799 HK 1,266 NR NA HKD 8 6.2 7.3 7.0 1.8 1.8 1.7 3.5 3.9 3.7 -6% -1.25
FriendTimes 6820 HK 557 BUY 4 HKD 2 6.9 5.2 4.5 1.6 1.2 1.1 4.8 3.8 3.3 23% 0.23
CMGE 302 HK 991 BUY 4.4 HKD 3 7.4 5.9 5.1 1.5 1.2 1.0 7.2 5.4 4.5 20% 0.29
Perfect World 002624 CH 8,231 BUY 49 CNY 28 21.5 18.1 15.1 5.1 4.3 3.8 19.1 16.0 14.1 19% 0.93
Sanqi Interactive 002555 CH 9,122 BUY 30 CNY 28 20.7 17.5 14.7 3.8 3.1 2.7 17.3 13.9 11.5 19% 0.94
Giant Interactive 002558 CH 5,374 NR NA CNY 17 NA NA NA NA NA NA NA NA NA NA NA
Average 18.1 15.2 13.0 4.2 3.5 3.0 14.2 11.9 10.1 16% 0.55
Live streaming
MOMO MOMO US 2,872 HOLD 16 USD 14 7.8 7.3 6.2 1.3 1.2 1.0 4.3 4.6 3.7 12% 0.60
YY YY US 6,663 BUY 130 USD 82 19.8 16.4 12.0 1.7 1.5 1.3 10.3 9.0 6.3 29% 0.57
Inke 3700 HK 269 NR NA HKD 1 11.9 6.8 4.6 NA NA NA NA NA NA 60% 0.11
Huya HUYA US 4,962 NR NA USD 21 26.4 19.9 14.8 3.0 2.4 2.0 21.7 13.5 9.5 34% 0.59
Average 16.5 12.6 9.4 2.0 1.7 1.5 12.1 9.0 6.5 34% 0.47
Entertainment
Tencent Music TME US 31,303 NR NA USD 19 41.6 33.6 26.4 7.0 5.7 4.8 40.3 30.1 23.1 26% 1.31
iQiyi IQ US 13,499 NR NA USD 17 NA NA NA 3.0 2.6 2.3 NA NA 40.5 -62% NA
China Literature 772 HK 7,521 NR NA HKD 57 NA 36.7 27.9 6.2 4.7 4.0 NA 34.4 24.2 NA NA
Bilibili BILI US 29,421 BUY 62 USD 85 NA NA NA 16.3 11.2 8.3 NA NA 155.3 NA NA
Average 41.6 35.1 27.2 8.1 6.1 4.8 40.3 32.3 60.8 -18% 1.31
Ads
Baidu BIDU US 65,722 BUY 173 USD 193 20.0 19.1 16.6 4.0 3.5 3.1 13.7 12.3 10.4 10% 1.98
Weibo WB US 10,469 NR NA USD 46 23.2 18.6 16.3 6.4 5.6 5.2 19.9 15.5 13.6 19% 0.96
Sina SINA US 2,540 NR NA USD 43 19.1 16.6 16.3 1.2 1.1 1.0 7.0 5.4 4.3 8% 2.02
Mobvista 1860 HK 780 NR NA HKD 4 13.4 10.8 NA 1.3 1.1 0.9 11.8 8.7 NA NA NA
Duiba 1753 HK 328 BUY 4 HKD 2 3.4 4.4 5.1 1.2 0.9 1.0 2.8 1.6 2.1 -18% -0.25
Average 15.8 13.9 13.6 2.8 2.4 2.3 11.0 8.7 7.6 5% 1.18
Total Average 20.5 18.0 14.9 4.2 3.3 2.8 51.4 14.6 18.5 15.8% 0.64
Source: Bloomberg, CMBIS, as of 21 Dec 2020
PLEASE READ THE ANALYST CERTIFICATION AND IMPORTANT DISCLOSURES ON LAST PAGE 822 Dec 2020
China Technology OUTPERFORM
Analysts: Alex NG – alexng@cmbi.com.hk
Lily YANG – lilyyang@cmbi.com.hk
Domestic substitution, 5G+AIoT and digitization
to drive growth
Positive on structural growth amid uncertainties
In 2020, China technology sector outperformed against the backdrop of Covid-19 impact,
new infrastructure support and US-China tensions. Performance of A/H tech sector
delivered 39%/27% YTD, ahead of CSI/HSI of +9%/+7%. While tech sector outperformed
in 1H20 thanks to rising expectations on domestic substitution and 5G upgrade cycle, we
saw more volatility in 2H20 due to pessimistic sentiment on slower 5G rollout and US-China
tensions, but overall upward trend continued into 4Q20. Valuation of A/H tech stocks also
increased from 36.4x/16.0x FY21E P/E in 3Q20 to 40.7x/23.0x P/E now. For 2021E,
although we expect US-China tension will become normal, we remain positive on this
sector given favourable policies, positive industry upgrade trend, global 5G deployment
and surging demand for 5G-related products/services. We believe technology upgrade and
innovations will remain the key investment themes for next year.
Global tech decoupling to accelerate domestic substitution
The US-China trade friction reshapes the global supply chain, and domestic substitution
accelerates industry upgrade and transormation. We believe US-China tensions will
continue in medium term, such as relocating factories and R&D bases overseas. At the
same time, Chinese companies are poised to accelerate supply chain localization in next
few years. We believe industry leaders will accelerate integration and localization,
especially in the upstream subsectors, which will benefit domestic technology leaders.
5G+AIoT to kick off new cycle of innovation
After industry slowdown in the past few years, we saw increasing consolidation of
technology brands and its supply chains. We believe leading technology companies will
significantly benefit from 5G+AI innovation cycle starting from next year. 1) Smartphone
brands: We expect global smartphone recovery following the pandemic. After Huawei event,
we expect global smartphone landscape to reshuffle and we are optimistic on Apple iPhone
12 cycle and Xioami’s market share gain; 2) AIoT: As 5G construction continues, we believe
AIoT will be the main growth driver in the next decade, especially for wearable devices
(TWS/VR/AR), smart home and smart car industry; 3) Components: We expect
smartphone market to rebound next year, driving higher adoption of wireless trend and
camera innovation (multi-camera, 3D), which will benefit leading companies in related
supply chain.
China 5G deployment to maintain a moderate pace to promote the
development of a digital ecosystem
We expect recent US restrictions will have limited impact on China 5G rollout roadmap
thanks to Huawei’s inventory build-up, accelerated semi localization and ZTE share pick-
up. Although there is still no "killer" application, a wide coverage 5G network is a
prerequisite for promoting the development of the 5G ecosystem. We forecast China 5G
BTS net-adds to reach 600k/800k/1.0mn in FY20/21/22E, and domestic leaders are well
PLEASE READ THE ANALYST CERTIFICATION AND IMPORTANT DISCLOSURES ON LAST PAGE 922 Dec 2020
placed to capture this multi-year opportunities. We expect upcoming 3rd phase of 5G BTS
tenders and new infrastructure policy will be positive catalysts in near term. We are
optimistic about subsector such as optical modules and RFFE. Benefiting from the demand
for 5G upgrades, relevant companies will be the first to enjoy 5G dividends.
Investment themes: 5G/AIoT supply chain and domestic substitution
Looking into 2021, driven by domestic substitution, 5G+AIoT and digitization, we are
optimistic on investment opportunities in domestic supply chain. We suggest to focus on
Apple/Xiaomi supply chain, network equipment, AIoT and related sectors. Meanwhile, we
also recommend to focus on semiconductor localization and information security sector.
We suggest to accumulate sector leader with high growth visibility, including Xiaomi 91810
HK, BUY), BYD Electronics (285 HK, BUY), Sunny Optical (2382 HK, BUY), Luxshare
(002475 CH, BUY), Goertek (002241 CH, BUY), ZTE (763 HK, BUY), Innolight (300308
CH, BUY), Sunway (300136 CH, BUY) and Shengyi Tech (600183 CH, BUY).
Figure 9: 5G smartphone supply chain
3D Sensing Antenna Metal/plastic Casing Glass Casing Fingerprint Module
Lens
(FPM)
O-film (002456 CH) Amphenol (APH US) BYDE (285 HK) BYDE (285 HK) Sunny Optical (2382 HK)
BYDE (285 HK)
Truly (732 HK) Sunway (300136 CH) Tongda (698 HK) Tongda (698 HK) Q-tech (1478 HK)
Q-tech (1478 HK)
Largan (3008 TT) Foxconn (2354 TT) Lens Tech (300433 CH) AAC (2018 HK)
O-Film (002456 CH)
Win Semi (3105 TT) Waterproof Catcher (2474 TT) Biel Crystal (private) O-film (002456 CH)
Goodix (603160 CH)
LG Innotek (011070 KS) Jabil (JBL US) Synopsys (SNPS US) Largan (3008 TT)
Tongda (698 HK)
Sharp (6753 JT) Casetek (5264 TT) TDK (6762 JT) Kantatsu (private)
Jabil (JBL US)
AMS/Heptagon (AMS SW) Genius (3406 TT)
Lumentum (LITE US)
Tong Hsing (6271 TT)
Compact Camera Module
ST Micro (STM US)
(CCM)
Himax (HIMX US)
Viavi (VIAV US)
Sunny Optical (2382 HK)
Q-tech (1478 HK)
LCD/OLED Display Truly (732 HK)
Cowell (1415 HK)
BOE (000725 CH) O-Film (002456 CH)
Tianma (000050 CH) HonHai (2317 TT)
Truly (732 HK) LG Innotek (011070 KS)
Rouyu Tech (private) SEMCO (009150 KS)
SEC (005930 KS) Sharp (6753 JT)
LG Display (034220 KS)
Sharp (6753 JT)
JDI (6740 JT)
Acoustic
Battery Pack Connector AAC (2018 HK)
Touch Panel Wireless Charging Haptics
BYDE (285 HK) Luxshare (002475 CH) Goertek (002241 CH)
O-film (002456 CH) Desay (000049 CH) Broadcom (AVGO US) AAC (2018 HK) FIT Hon Teng (6088 HK) Luxshare (002475 CH)
Truly (732 HK) Sunwoda (300207 CH) TSMC (2330 TT) Luxshare (002475 CH) Foxlink (2392 TT) Merry (2439 TT)
TPK (3673 TT) Simplo (6121 TT) Luxshare (002475 CH) Alps (6770 JT) Hirose (6806 JT) Knowles (KN US)
GIS (6456 TT) Samsung SDI (006400 KS) FIT Hon Teng (6088 HK) NIDEC (6594 JT) JAE (6807 JT) Cirrus Logic (CRUS US)
Source: Company data, CMBIS
Figure 10: 5G network supply chain
Transmission & Core network Radio Access Network (RAN) Operators Terminals
Smartphone
Optical Module RF Equip. Vendor Operators Antenna
Accelink (002281 CH) Murata (6981 JT) ZTE (763 HK)
Sunway (300136 CH)
Innolight (300308 CH) TDK (6762 JT) Fiberhome (600498 CH) China Mobile (941 HK) Speed (300322 CH)
Hisense (600060 CH) Qorvo (QRVO US) Huawei (private) China Unicom (762 HK) Luxshare (002475 CH)
Eoptolink (300502 CH) Skyworks (SWKS US) Nokia (NOK US) China Telecom (728 HK)
HG Genuine (000988 CH) Molex (MOLX US) Ericsson (ERIC US) Vodafone (VOD US)
O-net (877 HK) Amphenol (APH US) Samsung (005930 KS) AT&T (T US)
DSBJ (002384 CH) RF
II-VI (IIVI US) SKM (017670 KS)
AAOI (AAOI US) Fingu (002194 CH)
Tatfook (300134 CH) Small Cell DSBJ (002384 CH)
Lumentum (LITE US) Fingu (002194 CH)
Caiqin Tech (private)
Comba (2342 HK) Tatfook (300134 CH)
Sunsea AIoT(002313 CH) Tower
Optical Fibre Antenna
China Tower (788 HK)
YOFC (6869 HK) FRD (300602 CH)
Baseband chips
ZTT (600522 CH) Comba (2342 HK)
Fibrehome (600498 CH) Mobi (947 HK) Hisilicon (private)
Hengtong (600487 CH) Tongyu (002792 CH) Meditek (2454 TW)
Huawei (private) Unisoc (private)
Kathrein (private) Sanechips (subsi. of ZTE)
Qualcomm (QCOM US)
PCB
SCC (002916 CH)
SY Tech (600183 CH)
WUS (002463 CH)
Source: CMBIS
PLEASE READ THE ANALYST CERTIFICATION AND IMPORTANT DISCLOSURES ON LAST PAGE 1022 Dec 2020
China software & IT services OUTPERFORM
Analyst: Marley NGAN – marleyngan@cmbi.com.hk
New infrastructure, new opportunities
Tech infrastructure investment to drive long term growth
As software and IT services industry is less affected by Covid-19, sector largely
outperformed the market in 1H20. In May 2020, the valuation premium between sector
average PE and CSI 300 widened to 10x difference. Since the end of 2Q20, software sector
has corrected over 30%. With New Infrastructure investment taking place, we are positive
on three technology innovation areas: Cloud computing, SaaS and AI. These new drivers
should support long-term sector revaluation. We like GDS, Chinasoft, Glodon, Ming Yuan
Cloud and Hikvision in this sector.
Strong rebound in enterprise software and IT servicess in 2021
According to Gartner, China IT spending will reach Rmb3.04tn in 2021, up 7.2% YoY. To
support remote working, learning and other virtual services, enterprises are accelerating
digital transformation. Among all IT spending, enterprise software and IT services will show
the fastest growth at +10.4% YoY to Rmb120.7bn and and +11.9% YoY to Rmb377.2bn
respectively.
Cloud computing is the core of New Infrastructure Plan
New Infrastructure Plan is a key policy in the 14th Five-Year Plan. Alibaba and Tencent
have announced investment plans in the next 3-5 years (Rmb200bn and Rmb300bn
respectively). We expect China Internet Data Center (IDC) sector to maintain +30% YoY
growth in 2021. Meanwhile, cloud computing has also created a new market in Managed
Cloud Services (cloud consulting, migration, operating and management). We expect MCS
market to grow at 54.7% cagr between 2019 and 2023 to a size of US$3.21bn.
Enterprise to accelerate digital transformation post pandemic
We believe enterprises will accelerate SaaS adoption in order to lower IT cost and ensure
business continuity. According to IDC, by end of 2021, 60% of enterprises in China will
migrate IT infrastructure and applications to cloud-based at a pace that is 2x faster before
the pandemic. We expect China SaaS market to increase at +33% YoY in 2021 to
Rmb34.2bn.
AI to help intelligent upgrade in traditional industries
In 2019-2024, China AI industry will grow at 49% cagr to reach a size of Rmb800bn. We
assume that US-China tech war will continue and bring uncertainty to upstream AI chip
R&D and manufacturing. However, China will continue to apply downstream AI algorithm
and applications to promote safe city, intelligent transportation, smart retail etc.
Investment strategy
In 2021, we are positive in cloud computing, SaaS and AI. Although US-China tech war
remains the largest downside risk to the sector, this will also push China to increase R&D
in cloud and AI infrastructure to accelerate import substitution.
PLEASE READ THE ANALYST CERTIFICATION AND IMPORTANT DISCLOSURES ON LAST PAGE 1122 Dec 2020
China Consumer Staples OUTPERFORM
Analyst:Albert YIP, CFA – albertyip@cmbi.com.hk
Consumption upgrade trend backed by
recovering buying power
Consumption supported by recovering demand and low base
Unemployment rate declined and growth of disposable income rebounded post pandemic.
Our Economist estimates GDP and retail sales to climbed 8.6% and 13.0% in 2021. The
recovery of purchasing power should support consumption upgrade trend. We are positive
on ASP growth of beer and white wine sector. Our top picks are CR Beer (291HK, Buy)
and Moutai (600519CH, Buy). We lifted CR Beer’s TP from HK$73.10, based on 51x
FY21E P/E as we raised FY20-22E adj. NP by 2-6% on higher sales mix of high-end beer.
Beer sector: Premiumization, efficiency gain and sector consolidation
From overseas market experience, we see China beer sector leaders like CR Beer and
Tsingtao Brewery have large room to increase EBITDA margins through sector
conosolidation and continuing premiumization.
Room for premiumization. China’s market share of premium and super-premium
categories was 16.4% in 2018, lower than 33.4%/25% of Vietnam/Korea, respectively.
Sector players focus on premiumization rather than price competition.
According to CADA, premiumization is accelerating as beer sector profit per unit
growth rose from double-digit in Mar 2020 to 47.4% growth in Sep 2020. CADA
estimates sector PBT to grow at 15% CAGR from 2020 to 2025.
Increase production efficiency. Beside factory closure, companies can optimize
production capacities and raise sales mix of canned-beer and bottled-beer with
returnable bottles concept.
Further room for sector consolidation. China’s top five players shared 70.4% of
sales volume in 2018. Such ratio is less than 90% seen in Korea, India and Vietnam.
White wine sector: ASP increase and sector consolidation
High-end white wine sector has a favorable industry landscape given Moutai is the
dominant leader and top two players take 80-85% market share. Moutai and Wuliangye
could post 16% CAGR of revenue from FY19 to FY22E through volume and ASP growth.
Sector consolidation accelerating. Consumers are drinking better but less. There
is oversupply in low to mid-end. No. of above scale enterprises dropped from 1,593
to below 1,000 in 2020. On the other hand, quality high-end white wine accounts for
less than 1% of sector volume. Top ten players’ market share rose from 27% in 2017
to 40% in 2019.
Expect Moutai to lift ex-factory price in 1Q21. Many high-end peers already lifted
ex-factory prices in 2020. Now Moutai distributors’ gross profit per bottle is much
greater than Moutai’s gross profit per bottle. Past experience shows Moutai usually
raised ex-factory in first year of FYP. We forecast Moutai to raise ex-factory price by
24% to RMB1,199 in 1Q21. This should provide room for Wuliangye to raise ex-
factory price.
PLEASE READ THE ANALYST CERTIFICATION AND IMPORTANT DISCLOSURES ON LAST PAGE 1222 Dec 2020
China Consumer Discretionary OUTPERFORM
Analyst:Walter WOO – walterwoo@cmbi.com.hk
A likely recovery is bound to be with high valuation
Strong rebound in 1H21E but challenges exist in 2H21E.
2020 review: Gradually recovering since 2Q20E while home appliances,
sportswear, luxury and exports outperformed in the stock market.
Domestic consumption was dragged by the outbreak of covid-19, but recovery rapidly in
2Q20E and resumed positive growth in Aug 2020. Consumer Discretionary begun to
outperform the overall stock market in 2H20E, while home appliances, sportswear, luxury
and exports performed the best.
Valuation is at all-time high, but we expect that to linger in 1H21E and
investors should stay cautious in 2H21E.
MSCI Consumer Discretionary valuation had increased from to 30.7x in Dec 2020, from
23.6x in Dec 2019, in our view, due to: 1) downward revisions of net profit forecasts, 2)
surge in overall liquidity, too much capital chasing too few quality stocks, 3) leaders in each
industry are actually benefiting from consolidation amid the covid-19 outbreak. Noted that
8 years historical average P/E is at 16.6x, while max and min are 30.7x and 8.4x. We expect
the high valuation to stay in 1H21E, as the economic recovery is highly certain and
investors sentiment should robust. But we should become more cautious in 2H21E, due to
the risks of slower than expected growth and covid-19 drags to last longer than expected.
Reiterating our positive view on FY21E, due to short and long run catalysts.
1) Short run: Late CNY, colder winter and re-shoring.
We are optimistic on the upcoming retail sales growth in 1H20E, thanks to: 1) later than
usual CNY in 2021 (3 weeks later vs 2020), 2) greater chance of a cold winter, 3)
consumption to stay in mainland China as outbound travels are highly limited.
2) Long run: Income and profit growth recovery, wealth effect and industry
consolidation.
We are structurally positive for FY21E, thanks to: 1) both income and industrial earnings
are likely to have a stronger rebound, especially when unemployment rate to further
normalize, 2) wealth effect to sustain, as stock and property prices are still going up in
FY20E, 3) industry leader could further consolidate the industry, given its better financial
strength, better labour resources, management and executions, and its more advanced
digital channel capability.
Our top sectors for FY2021E are:
1) Catering, 2) Sportswear, 3) Luxury goods, 4) Tourism & hotels and 5) Home
appliances and furniture.
Our top picks for FY2021E are:
1) Jiumaojiu (9922 HK), 2) Haidilao (6862 HK), 3) Anta (2020 HK), 4) Li Ning (2331 HK), 5)
Prada (1913 HK), 6) China Tourism Group Duty Free (601888 CH), 7) Samsonite (1910
HK), 8) JS Global (1691 HK), 9) Haier Smart Home (600690 CH) and 10) Man Wah (1999
HK).
PLEASE READ THE ANALYST CERTIFICATION AND IMPORTANT DISCLOSURES ON LAST PAGE 1322 Dec 2020
Focus Charts
Figure 11: 2020 consumer sub-sector YTD returns Figure 12: Forward 2 years vs 5 years avg. valuation
110 (%) (x) 35
77 30
80 25
50 20
24 17 15
20 12 8
10
(10) 5
(6) (9)
(17) (17) (24)
(40) (25)
2年预测市盈率 中位数
1年预测市盈率 中位数 - 5年平均
Source: Bloomberg, CMBIS estimates Source: Bloomberg, CMBIS estimates
Figure 13: Consumer Discretionary sector valuation
35.0 (x) Nov-20, 30.7
Dec-19, 23.6
30.0
28.8
25.0 Jul-17, 20.9
22.7
20.0 Jan-13, 12.6
16.6
15.0
10.0
Aug-15, 8.4 Oct-18, 14.1
5.0
-
Dec-19
Dec-12
Aug-13
Dec-13
Dec-14
Dec-15
Dec-16
Dec-17
Dec-18
Aug-14
Aug-15
Aug-16
Aug-17
Aug-18
Aug-19
Aug-20
Apr-13
Apr-14
Apr-15
Apr-16
Apr-17
Apr-18
Apr-19
Apr-20
12个月预测市盈率 +2 标准差 +1 标准差
8年平均 -1 标准差 -2 标准差
Source: Bloomberg, CMBIS estimates
PLEASE READ THE ANALYST CERTIFICATION AND IMPORTANT DISCLOSURES ON LAST PAGE 1422 Dec 2020
Figure 14: Consumer confidence indices Figure 15: Urban survey unemployment rate
135 (%)
6.1 Oct-20,
Dec-19,
5.3
125 5.7 Dec-18, 5.2
4.9
5.3
115
4.9
105
4.5
Jul-18
Jan-19
Jul-19
Jan-20
Jul-20
Mar-19
Mar-20
Nov-18
Sep-19
Nov-19
Sep-18
Sep-20
May-19
May-20
95
Dec-16 Sep-17 Jun-18 Mar-19 Dec-19 Sep-20
消费者信心指数:就业 消费者信心指数:收入
城镇调查失业率
消费者信心指数:消费意愿 消费者信心指数
Source: NBS, CMBIS estimates Source: NBS, CMBIS estimates
Figure 16: Stocks and property indices’ returns Figure 17: Household savings and consumer credit
40 (%) 36 100
88
30 25 81 +8%
22 24
80
20
11 11 10
10 6 6 7 4 60
0
0
40
-10 -3 -5
-11 -14 20 10 8
-20 -22%
-19
-30 -25 0
2015 2016 2017 2018 2019YTD Dec 2019 Mar 2020
2020
国企指数 沪深300 中国70城房价 中国家庭存款余额 中国消费贷款/消费者信贷余额
Source: Bloomberg, CMBIS estimates Source: NBS, CMBIS estimates
Figure 18: China retail sales growth and online mix Figure 19: Major home appliances’ exports growth
25.0 (%) 24.2 (%)
20.7 60.0
20.0 18.4
35.0
15.0
15.0 13.1
10.9 10.0
10.0 8.1
5.8 -15.0
5.0 2.7 3.5 3.5
1.4 2.4 2.2 1.9 2.3 -40.0
0.0
家用空调出口量同比 冰箱出口量同比
网上零售占总销售 占比增加 洗衣机出口量同比
Source: NBS, CMBIS estimates Source: China IOL, CMBIS estimates
PLEASE READ THE ANALYST CERTIFICATION AND IMPORTANT DISCLOSURES ON LAST PAGE 1522 Dec 2020
Figure 20: Occupancy rate by brand Figure 21: Number of tourist arrival to Hainan
(%) 40%
95 18% 13% 17% 21% 17% 22%
83 11%
79 20%
80 74
70 70
63 0%
65 55 58
50 -20% -36%
48 45 47
50
-40% -54%
34 34
35 -60%
20
华住酒店 首旅集团 锦江国际 - 锦江国际 - 格林酒店
国内 海外
接待游客总人数(万人次)增长
1Q19 2Q19 3Q19 4Q19 1Q20 2Q20 3Q20 旅游总收入(亿元)增长
Source: Bloomberg, Company data, CMBIS estimates Source: Department of Culture Radio Television Publication and
Sports of Hainan, CMBIS estimates
Figure 22: China retail sales growth by sub-sectors
23.0 16.9 18.3 16.7
15.1
12.8 10.4 11.7 8.1 10.8 11.7 12.0 12.2
11.0 8.8 7.4 7.3 6.7 5.9 4.5 2.6 4.2 2.7 1.3 0.8
-1.0
-4.5 -6.2
-13.0 -7.0 -8.7 -9.7 -9.8 -11.0
-16.1
-25.0 -21.0
1-10月 10月
Source: NBS, CMBIS estimates
Figure 23: Stage of recovery, by sub-sectors
1Q20 2Q20 2H20E 1H21E 2H21E
During
Stages pandemic Recovery stage Post pandemic Remarks
Food & beverage Thanks to city lock downs
Small appliances Thanks to city lock downs and stay home demand
Home appliances Thanks to stay home demand and habit built
Furnitures Thanks to stay home demand and habit built
Catering Thanks to delivery demand and return of traffic
Sportswear Thanks to greater interest on exercising
Luxury goods Thanks to wealth effect and rehsoring
Exporters Benefiting from pandemic overseas
Tourism & hotels Thanks to gradual return of traffic and reshoring
Apparel Benefiting from cold winter
Textile Benefiting from colder winter and pandemic overseas
Entertainment Thanks to gradual return of traffic and reshoring
Department stores Thanks to gradual return of traffic and reshoring
HK retail Thanks to gradual return of traffic and strong CNY
Source: CMBIS estimates
PLEASE READ THE ANALYST CERTIFICATION AND IMPORTANT DISCLOSURES ON LAST PAGE 1622 Dec 2020
Peers Valuation
Figure 24: Peers Valuation 1
Price Mkt cap Rating TP Year PER (x) PBR (x) PEG (x) Yield (%)Net gearing YTD
Company Ticker L.C. HK$ mn L.C. End FY1 FY2 5yrs avg. FY1 FY2 5yrs avg. FY1 FY1 FY0 performanc
Tourism
Shanghai Jin Jiang Capital-H 錦江資本 2006 HK 1.29 7,180 - - Dec-19 10.9 12.1 14.3 0.8 0.8 1.2 (1.9) 1.2 92.3 (19.4)
Hongkong & Shanghai Hotels 大酒店 45 HK 7.20 11,876 - - Dec-19 n/a 69.2 18.3 n/a n/a 0.4 0.0 0.0 25.1 (13.8)
Shangri-La Asia Ltd 香格里拉(亞洲)69 HK 7.40 26,533 - - Dec-19 n/a 954.6 32.7 0.6 0.6 0.8 0.0 0.0 76.2 (9.1)
Huazhu Group Ltd-Adr 華住酒店集團 HTHT US 51.43 127,780 - - Dec-19 n/a 48.3 40.4 10.0 9.2 8.0 0.0 0.1 426.9 28.4
Btg Hotels Group Co Ltd-A 首旅酒店 600258 CH 24.60 28,699 - - Dec-19 n/a 25.7 38.0 2.8 2.5 2.9 0.0 0.1 6.6 19.4
Fosun Tourism Group 復星旅遊文化 1992 HK 7.90 9,757 - - Dec-19 n/a 11.7 n/a 1.3 1.2 n/a 0.0 0.0 158.6 (29.3)
China Travel Intl Inv Hk 香港中旅 308 HK 1.10 6,090 - - Dec-19 n/a 19.3 20.9 0.4 0.4 0.8 0.0 0.0 (16.7) (20.3)
Average 10.9 163.0 27.5 2.6 2.5 2.3 (0.3) 0.2 109.8 (6.3)
Median 10.9 25.7 26.8 1.0 1.0 1.0 0.0 0.0 76.2 (13.8)
HK retail
Chow Tai Fook Jewellery Grou 周大福 1929 HK 10.12 101,200 - - Mar-20 22.0 18.4 19.9 3.7 3.5 2.2 0.7 3.5 64.1 35.8
Luk Fook Holdings Intl Ltd 六福集團 590 HK 19.42 11,402 - - Mar-20 13.4 10.1 11.7 1.1 1.0 1.4 0.9 4.9 (4.3) (13.5)
Chow Sang Sang Hldg 周生生 116 HK 9.38 6,354 - - Dec-19 9.9 6.7 10.7 0.6 0.5 0.9 0.5 4.1 27.7 (3.2)
Sa Sa International Hldgs 莎莎國際 178 HK 1.28 3,972 - - Mar-20 n/a 29.1 n/a 2.6 2.4 3.5 0.0 0.0 26.3 (27.3)
Lifestyle Intl Hldgs Ltd 利福國際 1212 HK 6.46 9,702 - - Dec-19 18.6 9.5 9.3 2.4 2.0 4.8 (1.3) 0.1 222.4 (27.7)
Cafe De Coral Holdings Ltd 大家樂集團 341 HK 17.08 10,004 BUY 18.37 Mar-20 21.4 21.6 39.5 3.3 3.2 3.5 0.2 2.7 84.4 (7.5)
Wharf Real Estate Investment 九龍倉置業 1997 HK 36.90 112,037 - - Dec-19 14.8 14.0 n/a 0.5 0.5 n/a 0.5 4.3 19.3 (22.4)
Average 16.7 15.6 18.2 2.0 1.9 2.7 0.2 2.8 62.8 (9.4)
Median 16.7 14.0 11.7 2.4 2.0 2.9 0.5 3.5 27.7 (13.5)
Apparel
Bosideng Intl Hldgs Ltd 波司登 3998 HK 3.31 35,647 BUY 4.23 Mar-20 19.5 15.8 14.3 2.8 2.6 1.1 0.7 3.7 (21.5) 17.8
I.T Ltd I.T 999 HK 1.94 2,320 - - Feb-20 n/a n/a n/a n/a n/a 1.1 0.0 n/a 121.2 3.7
Giordano International Ltd 佐丹奴國際 709 HK 1.25 1,972 - - Dec-19 n/a 15.6 14.0 0.9 0.8 2.0 0.0 4.0 (3.0) (46.8)
Esprit Holdings Ltd 思捷環球 330 HK 1.04 1,963 - - Jun-20 n/a n/a n/a 0.4 0.4 0.6 0.0 n/a 43.4 (33.8)
Cosmo Lady China Holdings Co 都市麗人 2298 HK 1.30 2,924 - - Dec-19 31.4 15.7 n/a 1.0 0.9 1.9 (0.2) 0.0 (1.7) 18.2
Jnby Design Ltd 江南布衣 3306 HK 8.91 4,622 BUY 9.57 Jun-20 9.0 8.2 n/a 2.4 2.3 n/a 0.5 8.0 (31.6) (14.8)
China Lilang Ltd 中國利郎 1234 HK 5.27 6,311 BUY 5.89 Dec-19 7.8 6.2 9.2 1.4 1.3 1.9 1.6 8.3 (48.5) (14.3)
Shanghai La Chapelle Fashi-H 拉夏貝爾 6116 HK 0.38 796 - - Dec-19 n/a n/a n/a n/a n/a 1.1 0.0 n/a 325.1 (73.6)
Global Brands Group Holding 利標品牌 787 HK 0.19 191 - - Mar-20 n/a n/a n/a n/a n/a n/a 0.0 n/a 205.3 (70.9)
Average 16.9 12.3 12.5 1.5 1.4 1.4 0.3 4.8 65.4 (23.8)
Median 14.2 15.6 14.0 1.2 1.1 1.1 0.0 4.0 (1.7) (14.8)
Restaurant
Haidilao International Holdi 海底撈 6862 HK 52.60 278,780 BUY 53.56 Dec-19 235.6 51.0 n/a 19.2 14.0 n/a 5.9 0.2 30.0 68.1
Jiumaojiu International Hold 九毛九 9922 HK 17.30 25,144 BUY 20.88 Dec-19 418.5 44.4 n/a 9.4 7.8 n/a 9.1 0.1 595.0 n/a
Xiabuxiabu Catering Manageme 呷哺呷哺 520 HK 17.20 18,606 - - Dec-19 1120.2 30.6 23.2 6.6 5.6 4.2 35.4 0.3 47.0 70.1
Cafe De Coral Holdings Ltd 大家樂集團 341 HK 17.08 10,004 BUY 18.37 Mar-20 21.4 21.6 39.5 3.3 3.2 3.5 0.2 2.7 84.4 (7.5)
Tai Hing Group Holdings Ltd 太興集團 6811 HK 1.38 1,383 - - Dec-19 36.3 8.6 n/a 2.8 2.6 n/a 1.1 1.5 126.4 (15.9)
Ajisen China Holdings Ltd 味千(中國) 538 HK 1.09 1,190 - - Dec-19 4.9 n/a n/a n/a n/a 1.0 0.0 n/a (25.0) (60.6)
Fairwood Holdings Ltd Fairwood Hold 52 HK 18.36 2,378 - - Mar-20 39.9 13.3 21.1 3.5 2.9 4.6 0.0 1.7 131.8 (7.6)
Hop Hing Group Holdings Ltd 合興集團 47 HK 0.05 483 - - Dec-19 n/a n/a 12.6 n/a n/a 2.6 0.0 n/a 56.0 (53.4)
Tsui Wah Holdings Ltd 翠華控股 1314 HK 0.29 402 - - Mar-20 n/a n/a n/a n/a n/a 1.3 0.0 n/a 75.4 (33.7)
Yihai International Holding 頤海國際 1579 HK 88.65 92,808 - - Dec-19 75.7 55.0 n/a 21.6 16.3 n/a 2.1 0.3 (57.6) 94.6
Yum China Holdings Inc 百勝中國 YUMC US 58.17 189,092 BUY 72.60 Dec-19 39.1 29.0 n/a 4.3 3.9 n/a 5.9 0.5 17.5 21.2
Average 221.3 31.7 24.1 8.8 7.0 2.9 5.4 0.9 98.3 7.5
Median 39.9 29.8 22.2 5.5 4.8 3.1 1.1 0.4 56.0 (7.6)
Textile
Shenzhou International Group 申洲國際 2313 HK 133.20 200,229 - - Dec-19 31.9 26.7 24.6 6.0 5.3 4.8 2.2 1.6 (27.4) 16.9
Crystal International Group 晶苑國際 2232 HK 2.50 7,132 - - Dec-19 9.5 7.0 n/a 0.8 0.7 n/a (13.7) 2.5 3.7 (22.1)
Regina Miracle International 維珍妮 2199 HK 3.09 3,783 - - Mar-20 31.5 12.1 35.0 1.3 1.2 2.9 1.9 0.8 108.5 (37.7)
Pacific Textiles Holdings 互太紡織 1382 HK 5.26 7,423 - - Mar-20 9.9 8.7 12.2 2.4 2.3 3.4 1.0 8.5 (2.2) (1.7)
Nameson Holdings Ltd 南旋控股 1982 HK 0.50 1,140 - - Mar-20 n/a n/a n/a n/a n/a n/a 0.0 n/a 61.1 (18.0)
Best Pacific International H 超盈國際控股 2111 HK 1.29 1,341 - - Dec-19 5.5 4.1 11.1 0.5 0.5 1.9 0.7 3.6 64.9 (41.4)
Texwinca Holdings Ltd 德永佳集團 321 HK 1.53 2,114 - - Mar-20 10.9 7.7 13.3 0.4 0.4 1.0 0.4 6.5 2.5 (20.7)
Win Hanverky Holdings Ltd 永嘉集團 3322 HK 0.35 450 - - Dec-19 n/a n/a 11.7 n/a n/a 0.6 0.0 n/a 46.4 (32.7)
Eagle Nice (Intl) Hldgs Ltd 鷹美 2368 HK 3.88 2,064 - - Mar-20 n/a n/a 8.1 n/a n/a 1.1 0.0 n/a 15.4 27.6
Texhong Textile Group Ltd 天虹紡織 2678 HK 6.92 6,332 - - Dec-19 22.9 6.1 7.1 0.7 0.7 1.2 2.0 1.4 82.1 (21.1)
Yue Yuen Industrial Hldg 裕元集團 551 HK 16.38 26,408 - - Dec-19 n/a 13.6 14.2 0.9 0.8 1.3 0.0 1.4 32.9 (28.8)
Stella International 九興控股 1836 HK 8.78 6,978 - - Dec-19 51.5 10.9 15.8 1.0 0.9 1.4 10.3 1.8 (6.1) (29.8)
Average 21.7 10.8 15.3 1.5 1.4 2.0 0.4 3.1 31.8 (17.4)
Median 16.9 8.7 12.8 0.9 0.8 1.3 0.5 1.8 24.1 (21.6)
Source: Bloomberg, CMBIS estimates
PLEASE READ THE ANALYST CERTIFICATION AND IMPORTANT DISCLOSURES ON LAST PAGE 1722 Dec 2020
Figure 25: Peers Valuation 2
Price Mkt cap Rating TP Year PER (x) PBR (x) PEG (x) Yield (%)Net gearing YTD
Company Ticker L.C. HK$ mn L.C. End FY1 FY2 5yrs avg. FY1 FY2 5yrs avg. FY1 FY1 FY0 performanc
Sports
Anta Sports Products Ltd 安踏體育 2020 HK 110.20 297,907 BUY 101.84 Dec-19 48.5 31.9 24.4 10.6 8.5 6.1 2.0 0.7 (13.0) 58.0
Li Ning Co Ltd 李寧 2331 HK 42.05 104,660 BUY 36.52 Dec-19 54.9 40.1 n/a 10.4 8.6 3.2 2.3 0.5 (70.3) 80.1
Xtep International Holdings 特步國際 1368 HK 3.29 8,337 BUY 3.63 Dec-19 14.4 9.9 12.4 1.0 0.9 1.4 2.9 4.2 (6.3) (20.5)
Topsports International Hold 滔搏 6110 HK 11.36 70,446 - - Feb-20 24.3 19.4 n/a 5.6 4.8 n/a 1.7 5.3 32.6 20.6
Pou Sheng Intl Holdings Ltd 寶勝國際 3813 HK 1.98 10,607 - - Dec-19 22.7 8.2 15.5 1.1 1.0 1.3 1.1 0.6 73.3 (19.5)
Average 33.0 21.9 17.4 5.7 4.8 3.0 2.0 2.2 3.3 23.7
Median 24.3 19.4 15.5 5.6 4.8 2.3 2.0 0.7 (6.3) 20.6
Department stores
Lifestyle Intl Hldgs Ltd 利福國際 1212 HK 6.46 9,702 - - Dec-19 18.6 9.5 9.3 2.4 2.0 4.8 (1.3) 0.1 222.4 (27.7)
Golden Eagle Retail Group 金鷹商貿集團 3308 HK 7.04 11,688 - - Dec-19 10.3 7.6 18.4 1.3 1.1 2.4 0.0 n/a 15.7 (18.9)
Maoye International Hldgs 茂業國際 848 HK 0.31 1,594 - - Dec-19 n/a n/a 20.9 n/a n/a 0.3 0.0 n/a 109.8 (42.6)
Springland International Hol 華地國際控股 1700 HK n/a n/a - - Dec-18 n/a n/a 8.3 n/a n/a 0.7 0.0 n/a 26.1 n/a
New World Dept Store China 新世界百貨中國 825 HK 1.20 2,023 - - Jun-20 n/a n/a n/a n/a n/a 0.5 0.0 n/a 105.4 (11.8)
Average 14.4 8.6 14.2 1.8 1.6 1.7 (0.3) 0.1 95.9 (25.2)
Median 14.4 8.6 13.9 1.8 1.6 0.7 0.0 0.1 105.4 (23.3)
Luxury products
Prada S.P.A. 普拉達 1913 HK 39.95 102,225 BUY 32.82 Dec-19 n/a 63.9 32.9 3.8 3.6 3.1 0.0 0.2 94.4 24.1
Samsonite International Sa 新秀麗 1910 HK 12.76 18,307 - - Dec-19 n/a 126.6 19.9 3.2 3.2 2.7 0.0 0.0 97.1 (31.8)
L'Occitane International Sa L'Occitane 973 HK 19.56 28,889 - - Mar-20 39.9 23.3 20.4 2.6 2.3 2.4 3.2 0.8 62.1 6.0
Chow Tai Fook Jewellery Grou 周大福 1929 HK 10.02 100,200 - - Mar-20 21.8 18.2 19.9 3.6 3.5 2.2 0.7 3.6 64.1 34.5
Luk Fook Holdings Intl Ltd 六福集團 590 HK 19.44 11,413 - - Mar-20 13.4 10.1 11.7 1.1 1.0 1.4 0.9 4.9 (4.3) (13.4)
China Tourism Group Duty F-A 中國中免 601888 CH 196.43 455,097 - - Dec-19 78.7 41.9 35.5 16.4 12.5 6.1 2.1 0.4 (53.4) 120.8
Emperor Watch & Jewellery 英皇鐘錶珠寶 887 HK 0.11 719 - - Dec-19 n/a n/a n/a n/a n/a 0.4 0.0 n/a 26.2 (32.5)
Oriental Watch Holdings 東方表行集團 398 HK 2.61 1,272 - - Mar-20 n/a n/a n/a n/a n/a 0.5 0.0 n/a (30.7) 29.5
Average 38.5 47.3 23.4 5.1 4.3 2.3 0.9 1.6 31.9 17.1
Median 30.9 32.6 20.1 3.4 3.3 2.3 0.4 0.6 44.2 15.0
Home appliances & furniture
Haier Electronics Group Co 海爾電器 1169 HK 38.60 108,736 - - Dec-19 24.1 20.3 13.4 2.9 2.6 2.1 (2.2) 1.2 (60.6) 58.5
Js Global Lifestyle Co Ltd Js環球生活 1691 HK 16.30 56,873 BUY 19.57 Dec-19 26.0 20.4 n/a 5.3 4.3 n/a 0.5 0.6 45.0 211.4
Hisense Home Appliances Gr-H 海信家電 921 HK 12.44 22,582 - - Dec-19 10.4 8.5 6.2 1.5 1.3 1.3 17.1 2.6 28.4 45.7
Man Wah Holdings Ltd 敏華控股 1999 HK 13.76 52,338 - - Mar-20 27.6 22.9 13.2 6.4 5.4 3.6 1.4 1.6 25.0 147.9
Midea Group Co Ltd-A 美的集團 000333 CH 89.91 745,687 BUY 95.24 Dec-19 24.9 21.3 14.5 5.3 4.6 3.5 2.2 1.9 37.7 54.4
Gree Electric Appliances I-A 格力電器 000651 CH 69.53 494,038 - - Dec-19 21.2 16.5 11.2 3.5 3.1 3.1 3.3 2.6 (76.3) 6.0
Haier Smart Home Co Ltd-A 海爾智家 600690 CH 27.71 209,016 - - Dec-19 23.3 19.4 n/a 3.5 3.1 n/a 2.2 1.3 36.7 42.1
Joyoung Co Ltd -A 九陽股份 002242 CH 33.57 30,419 - - Dec-19 28.2 23.9 21.6 6.4 5.8 4.3 1.8 2.4 (11.5) 33.4
Zhejiang Supor Co Ltd -A 蘇泊爾 002032 CH 71.10 68,954 - - Dec-19 31.7 26.7 24.7 7.7 6.7 6.3 3.1 1.8 (36.5) (7.4)
Ecovacs Robotics Co Ltd-A 科沃斯 603486 CH 68.20 45,478 - - Dec-19 92.9 60.6 n/a 13.4 11.4 n/a 1.1 0.3 (30.4) 236.1
Hangzhou Robam Appliances-A 老闆電器 002508 CH 41.35 46,350 - - Dec-19 22.9 20.0 22.5 4.9 4.2 6.0 1.8 1.9 (68.6) 22.3
Average 30.3 23.7 15.9 5.5 4.8 3.8 2.9 1.7 (10.1) 77.3
Median 24.9 20.4 13.9 5.3 4.3 3.6 1.8 1.8 (11.5) 45.7
Entertainment
Imax China Holding Inc Imax China 1970 HK 13.72 4,775 - - Dec-19 n/a 15.5 n/a 2.6 2.3 7.2 0.0 1.8 (34.5) (15.4)
Television Broadcasts Ltd 電視廣播 511 HK 7.90 3,460 - - Dec-19 n/a n/a n/a n/a n/a 1.4 0.0 n/a 16.2 (35.5)
Maoyan Entertainment 貓眼娛樂 1896 HK 12.80 14,547 - - Dec-19 n/a 13.6 n/a 1.5 1.4 n/a 0.0 0.0 (9.9) (10.7)
Alibaba Pictures Group Ltd 阿里影業 1060 HK 1.02 27,370 - - Mar-20 863.6 48.0 n/a 1.7 1.6 1.7 (4.6) n/a (26.6) (25.5)
Smi Holdings Group Ltd 星美控股 198 HK 2.34 6,342 - - Dec-18 7.5 n/a n/a 0.6 n/a 1.8 0.0 n/a 171.0 0.0
Average 435.6 25.7 n/a 1.6 1.8 3.0 (0.9) 0.9 23.2 (17.4)
Median 435.6 15.5 n/a 1.6 1.6 1.8 0.0 0.9 (9.9) (15.4)
Exporters
Bestway Global Holding Inc 榮威國際 3358 HK 1.83 1,937 - - Dec-19 7.6 5.2 n/a 0.5 0.5 n/a 1.2 3.4 42.4 (43.3)
Man Wah Holdings Ltd 敏華控股 1999 HK 13.76 52,338 - - Mar-20 27.6 22.9 13.2 6.4 5.4 3.6 1.4 1.6 25.0 147.9
Goodbaby International Holdi 好孩子國際 1086 HK 1.02 1,701 - - Dec-19 12.8 6.9 20.6 0.3 0.3 1.2 0.7 0.0 38.4 (41.0)
Dream International Ltd 德林國際 1126 HK 2.80 1,895 - - Dec-19 4.7 3.4 6.2 0.7 0.6 1.2 0.4 3.9 (21.8) (23.7)
Vtech Holdings Ltd Vtech Holdings 303 HK 59.65 15,040 - - Mar-20 12.4 10.4 14.6 3.0 2.8 4.6 30.2 6.6 (12.9) (22.5)
Techtronic Industries Co Ltd 創科實業 669 HK 99.00 181,429 - - Dec-19 32.3 26.7 20.9 6.0 5.6 3.6 1.7 1.2 8.8 55.8
Average 16.2 12.6 15.1 2.8 2.5 2.8 6.0 2.8 13.3 12.2
Median 12.6 8.6 14.6 1.8 1.7 3.6 1.3 2.5 16.9 (23.1)
Source: Bloomberg, CMBI estimates
PLEASE READ THE ANALYST CERTIFICATION AND IMPORTANT DISCLOSURES ON LAST PAGE 1822 Dec 2020
China Education OUTPERFORM
Analyst:Albert YIP, CFA – albertyip@cmbi.com.hk
Multiple growth drivers and attractive valuation
Prefer higher education to K12 education; top pick Hope Education
We prefer higher education sector because it has various growth drivers and attractive
valuation. Our top pick is Hope Education (1765HK, Buy). We also recommend Wisdom
Education (6068HK, Buy) on re-rating potential due to easing policy uncertainties.
Higher education sector: multiple growth drivers
Dividend of expanding enrolment of vocational education. The gov’t announced
to expand enrolment by 1mn in 2019 and by 2mn in 2020 and 2021. The admission
quota of diploma to degree was also increased in 2020. Given the students enrolled
in 2019 will graduate in 2022 and continuing enrolment expansion in 2021, we expect
student growth in 2021-22 school year would remain fast.
Rising gross enrolment rate. China’s higher education gross enrolment rate was
51.6% in 2019, far below ~70% in developed countries.
M&A. There were 9.33mn students in 2769 private higher education colleges and
secondary vocational schools in 2019. HK-listed peers shared ~10% of total private
students. There is big room for M&A opportunities.
Conversion of independent colleges. Conversion is like a 5x P/E acquisition. After
conversion, the authority could reward the college with greater admission quota.
Tuition fee upside potential. Private colleges could choose to register as for-profit
schools and then set tuition fees by their own discretion. Companies can enhance
program quality through cooperation with enterprises and set higher tuition fees.
Strong earnings growth and attractive valuation
Higher eudcation sector trades at 17.7x FY20E P/E. Its PEG is low at 0.68x compared to
26% EPS CAGR from FY20E to FY22E. K12 education sector trades at 14.8x FY20E P/E,
the sector could re-rate on easing policy uncertainty.
Easing policy uncertainties
According to MOE’s replies to The Third Meeting of the 13th National Committee of CPPCC,
MOE is open to legal and compliant connected party transactions to protect the rights of
non-profit private schools sponsors. Also, it has no plan of bringing high school into
compulsory education. We think these should ease policy uncertainties on K12 education.
Top pick Hope Education
The 39% total student enrollment growth and strong enrollments for overseas programs in
FY21E again showed the Company’s strong execution skills in improving performance of
acquisition targets. We forecast the Company to deliver 25.4% EPS CAGR in FY21-23E,
above peers’ average of 22%. We estimate conversion of four independent colleges could
further lift FY23E NP by 19%. Our TP of HK$3.41 is based on 25.4x FY21E P/E.
PLEASE READ THE ANALYST CERTIFICATION AND IMPORTANT DISCLOSURES ON LAST PAGE 1922 Dec 2020
China Banking OUTPERFORM
Analyst: Terry SUN, CFA – terrysun@cmbi.com.hk
Riding on the tailwinds
Key catalysts for sector re-rating in 2021
1) Easing asset quality and policy pressure as the economy recovers
Driven by accelerating investments and consumptions, domestic economic recovery
is gaining momentum. At the same time, vaccine development has made significant
progress, brightening the prospect of global economy. Under this backdrop, China
banks’ asset quality pressure should gradually alleviate. We expect NPL formation to
peak out in 2H20, as its trend usually trails that of nominal GDP growth by one to two
quarters. On the other hand, as corporate profitability continue to improve, banks shall
relieve their “national service” burden. Policy intervention will likely abate after the
completion of RMB1.5trillion profit concession. Hence, the sector’s earnings growth
should further pick up in 4Q20 after a notable rebound in 3Q20.
2) Improving NIM outlook amid normalizing monetary policy
Economic expansion, together with liquidity tightening, is the most favorable operating
environment for banks. In 1H20, China banks’ loan yields declined sharply on LPR
cuts. However, LPR has remained stable and market rates have been rising since May.
The average interest rate of newly issued RMB loans rose 6bp QoQ to 5.12% in 3Q20,
the first uptick in the past six months. Looking into 2021, policy normalization will result
in tighter credit supply, but credit demand will revive on macro recovery. As such,
lending rate may further climb and NIM is poised to widen.
3) Stronger motivation to boost earnings on capital replenishment need
On 3 Dec, PBoC and CBIRC jointly issued the Assessment Methodology for
Systemically Important Banks (SIB). We expect all six SOE banks and certain joint
stock banks to be included D-SIBs, which shall be subject to stricter capital adequacy
requirement. Therefore, banks have incentives to boost earnings to replenish core
tier1 capital, which is difficult to top up through external channels. We foresee an
upward revision in consensus FY20/21 earnings forecasts.
Stay Outperform; Big banks to fare better amid tighter liquidity
On the back of stabilizing NIM and peak-out in credit cost, China banks’ net profit growth
is expected to increase from -8.3% YoY in 9M20 to -4.8% YoY in FY20, and rise to 7.5%
YoY in FY21. A/H-share banks now trade at 0.73x/0.58x P/B with 5.0%/6.7% dividend
yields. We believe retail players, i.e. PAB (000001 CH) and PSBC (1658 HK/601658 CH),
will continue to post above-peers earnings growth due to faster asset quality turnaround
and stronger capital replenishment desire. Meanwhile, large banks with solid funding base
(higher proportion of deposits and lower funding cost) tend to benefit more from liquidity
tightening. We like CCB (939 HK/601939 CH) and ABC (1288 HK/601288 CH), given faster
revenue growth and decent provision buffer.
PLEASE READ THE ANALYST CERTIFICATION AND IMPORTANT DISCLOSURES ON LAST PAGE 2022 Dec 2020
Figure 26: Revenue YoY growth in 9M20 Figure 27: Provision coverage as of 3Q20
14% 13.2%
450%
425%
403%
12% 400%
350%
10%
300% 272%
7.7%
8%
6.6% 250% 218% 218%
5.9% 6.2% 190%
6% 200% 177% 170% 182%
4.9% 4.8%
151% 146%
150%
4% 3.2% 3.5%
2.8%
2.0% 100%
2%
50%
0% 0%
ICBC CCB ABC BOC BoCom PSBC CMB CITICB MSB CEB PAB ICBC CCB ABC BOC BoCom PSBC CMB CITICB MSB CEB PAB
Source: Company data, CMBIS Source: Company data, CMBIS
Figure 28: A-share China banks’ historical P/B Figure 29: H-share China banks’ historical P/B
1.4x 1.4x
1.3x 1.3x
1.2x 1.2x
1.1x
1.1x
1.0x
1.0x
0.9x
0.9x
0.8x
0.8x
0.7x
0.7x
0.6x
0.6x 0.5x
0.5x 0.4x
0.4x 0.3x
2010 2011 2012 2013 2014 2015 2016 2017 2018 2019 2020 2010 2011 2012 2013 2014 2015 2016 2017 2018 2019 2020
P/B Average +1 SD -1 SD P/B Average +1 SD -1 SD
Source: Bloomberg, CMBIS Source: Bloomberg, CMBIS
Figure 30: China banks’ valuation summary
Mkt cap (bn) Last Price TP P/B (x) P/E (x) Yield ROE
Company Ticker Rating
(Local ccy) (Local ccy) (Local ccy) 2020E 2021E 2020E 2021E 2020E 2021E 2020E 2021E
A-share
ICBC 601398 CH 1,685 5.00 7.20 BUY 0.67 0.62 6.1 5.7 5.0% 5.3% 11.4% 11.2%
CCB 601939 CH 1,228 6.41 9.30 BUY 0.71 0.65 6.4 6.0 4.8% 5.1% 11.5% 11.4%
ABC 601288 CH 1,084 3.17 4.60 BUY 0.59 0.55 5.6 5.2 5.5% 5.9% 10.9% 10.9%
BOC 601988 CH 853 3.18 4.40 BUY 0.53 0.49 5.5 5.1 5.7% 6.1% 10.0% 9.9%
PSBC 601658 CH 395 4.83 7.00 BUY 0.78 0.72 7.1 6.6 4.4% 4.6% 11.4% 11.3%
CITICB 601998 CH 215 5.10 6.70 BUY 0.53 0.49 5.6 5.2 4.6% 4.9% 9.7% 9.8%
CEB 601818 CH 190 3.99 6.10 BUY 0.61 0.56 5.8 5.3 5.4% 5.9% 11.0% 11.1%
PAB 000001 CH 356 18.36 26.00 BUY 1.20 1.09 12.9 11.2 1.2% 1.4% 9.7% 10.2%
BoCom 601328 CH 299 4.51 5.50 HOLD 0.45 0.42 4.9 4.6 6.3% 6.7% 9.5% 9.5%
MSB 600016 CH 215 5.20 6.20 HOLD 0.47 0.44 4.8 4.5 6.3% 6.8% 10.2% 10.2%
CMB 600036 CH 1,072 43.10 - NR 1.68 1.50 11.7 10.4 2.7% 3.1% 15.1% 15.2%
Average 0.80 0.73 7.1 6.5 4.7% 5.0% 11.4% 11.4%
H-share
ICBC 1398 HK 1,997 4.60 6.90 BUY 0.54 0.50 4.9 4.6 6.2% 6.6% 11.4% 11.2%
CCB 939 HK 1,455 5.75 8.50 BUY 0.56 0.51 5.0 4.7 6.0% 6.5% 11.5% 11.4%
ABC 1288 HK 1,284 2.76 4.20 BUY 0.45 0.42 4.3 4.0 7.2% 7.7% 10.9% 10.9%
BOC 3988 HK 1,011 2.59 3.90 BUY 0.38 0.35 3.9 3.7 8.0% 8.5% 10.0% 9.9%
PSBC 1658 HK 468 4.22 6.50 BUY 0.60 0.55 5.4 5.1 5.8% 6.0% 11.4% 11.3%
CITICB 998 HK 255 3.27 5.00 BUY 0.30 0.28 3.2 2.9 8.2% 8.8% 9.7% 9.8%
CEB 6818 HK 226 2.95 4.60 BUY 0.40 0.37 3.7 3.4 8.3% 9.1% 11.0% 11.1%
BoCom 3328 HK 354 4.13 5.10 HOLD 0.36 0.34 3.9 3.7 7.9% 8.4% 9.5% 9.5%
MSB 1988 HK 255 4.41 5.20 HOLD 0.35 0.33 3.6 3.3 8.5% 9.1% 10.2% 10.2%
CMB 3968 HK 1,271 47.20 - NR 1.55 1.37 10.8 9.6 2.9% 3.3% 15.2% 15.3%
Average 0.64 0.58 5.5 5.0 6.3% 6.7% 11.5% 11.5%
Source: Bloomberg, CMBIS estimates; Data as of 18 Dec 2020
PLEASE READ THE ANALYST CERTIFICATION AND IMPORTANT DISCLOSURES ON LAST PAGE 21You can also read