USED ELECTRIC VEHICLES DELIVER CONSUMER SAVINGS OVER GAS CARS
←
→
Page content transcription
If your browser does not render page correctly, please read the page content below
USED ELECTRIC
VEHICLES DELIVER
CONSUMER SAVINGS
OVER GAS CARS
POLICY IMPLICATIONS AND TOTAL OWNERSHIP COST
ANALYSIS FOR NON-LUXURY USED CARS AVAILABLE TO
CALIFORNIA CONSUMERS TODAY

JUNE 2, 2021

CHRIS BUSCH

ENERGY INNOVATION

98 BATTERY STREET, SUITE 202
SAN FRANCISCO, CA 94111
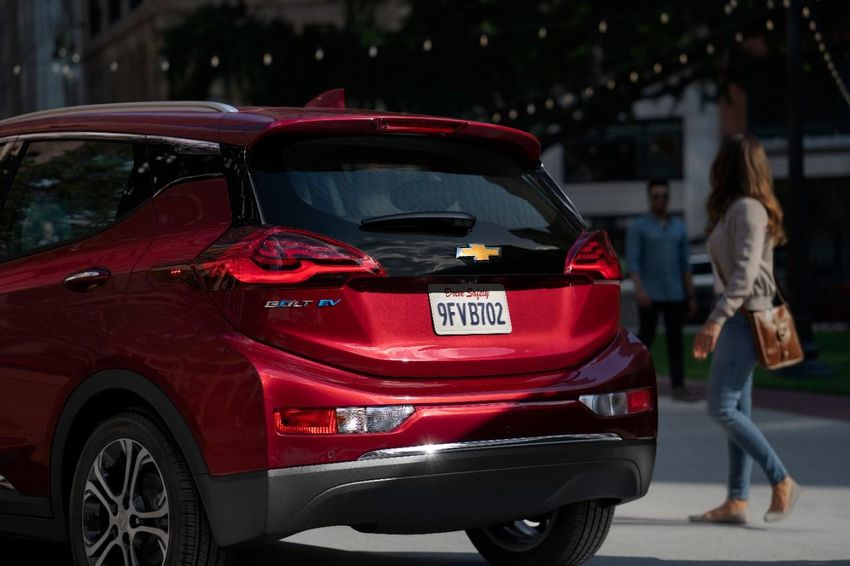
COVER PHOTO CREDIT
 Credit: Chevrolet, licensed under Creative Commons 3.0
 Title page photo shows a 2020 model year Chevrolet Bolt.
 https://media.chevrolet.com/media/us/en/chevrolet/photos.detail.html/content/media/us/en/chevrolet/
 vehicles/bolt-ev/2020/_jcr_content/rightpar/galleryphotogrid_1.html

 ACKNOWLEDGMENTS
 This work was funded by the Aspen Global Change Institute, an independent nonprofit dedicated to
 advancing global change science and solutions in service of society.
 The author gratefully acknowledges feedback from a diverse set of reviewers. Thank you: Dan Adler
 (California Governor’s Office of Business & Economic Development), Jamie Hall (General Motors),
 Debapriya Chakraborty (University of California, Davis), Tom Knox (Valley Clean Energy), Roger Lin (DAC
 Committee), Tom Van Heeke (General Motors), and several reviewers who prefer to remain anonymous.
 The Plug-In Hybrid & Electric Vehicle Research Center (Institute for Transportation Studies, University of
 California, Davis) deserve recognition for identifying the importance of more used electric vehicle research.
 I greatly appreciate the help of Energy Innovation colleagues: Sara Baldwin, Michael O’Boyle, Silvio
 Marcacci, Amanda Myers, and Sarah Spengeman. Thanks to Ginette Chapman for her careful and quite
 often inspired editorial work. Remaining errors are the author’s responsibility. Reviewers provided
 comment on preliminary drafts, and do not necessarily agree in part or whole with findings or policy
 recommendations.

i EI | USED ELECTRIC VEHICLES DELIVER CONSUMER SAVINGS OVER GAS CARS
SUMMARY

 A rapid transition to electric vehicles (EVs) is essential to reaching carbon neutrality in the transportation
 sector, which generates more greenhouse gas emissions in California and the United States than any other
 sector. Motor vehicles are also a key source of local air pollution, which disproportionately damages the
 health and well-being of people of color and lower-income communities.1 Indeed, when first establishing
 the zero-emissions vehicle requirement in 1990, California identified local air quality improvements as the
 exclusive regulatory objective, indicating the strong public health link.2
 Though the environmental benefits of EVs are clear, the role of publicly funded consumer incentives for
 new EV buyers has raised questions of economic fairness. The early market success of luxury brand Tesla
 fostered a perception that EVs are out-of-reach toys for the wealthy. In response to equity concerns,
 California retooled incentive polices, such as offering higher rebates to low- and moderate-income
 households under the Clean Vehicle Rebate Project. In another example, the Clean Cars 4 All program offers
 point-of-sale incentives for new and used EV purchases by lower-income households. People living near
 poverty in communities enduring the heaviest air pollution loads are eligible for the highest level of
 support—$9,500 for qualified clean vehicles with trade-in of an older gas car.
 This report provides new insights into the EV transition’s economic equity impacts through a study of the
 consumer economics of used cars, excluding luxury vehicles. The analysis centers on evaluation of total
 cost of ownership, accounting for vehicle purchase cost as well as fuel, maintenance, and insurance
 expenses. Ownership analysis is then leveraged to provide new insights into the household budget effects
 of incentives such as those available under Clean Cars 4 All.

 FINDINGS

 The analysis calculates average EV ownership savings as the difference between the ownership cost for a
 sales-volume-weighted average EV and a comparable gasoline car. Table 1 presents the topline finding that
 average EVs yield savings of $1,100 for model year 2017 and $500 for model year 2018. This is over a typical
 five-and-a-half-year ownership period. EVs save their owners money because lower fuel and maintenance
 expenses outweigh a higher average vehicle price. On average, 2017 and 2018 model year EVs cost more
 to purchase by $1,800 and $2,400, respectively. This cost difference is referred to as the EV purchase price
 premium.
 Table 1. EV ownership savings and purchase price premium
 2017 model year 2018 model year
 EV ownership savings $1,100 $500
 EV purchase price premium $1,800 $2,400
 Source: Energy Innovation analysis

 Market value declines rapidly immediately after purchase. New cars are worth less than half of their initial
 cost after five years. This depreciation effect shrinks the used EV purchase price premium relative to new
 vehicles. Results in Table 1 show a $600 higher price premium for 2018 model EVs compared to 2017 model
 EVs. These results are consistent with the expected declining price premium as EVs age.
 Model year 2017 and 2018 vehicles were the focus of the data analysis for several reasons. First, the
 consumer effects of interest will be less pronounced in new model year vehicles. Such smaller effects are
 more difficult to discern from statistical noise. The greater difficulty of identifying cost effects in 2019 or

ii EI | USED ELECTRIC VEHICLES DELIVER CONSUMER SAVINGS OVER GAS CARS
2020 EVs, combined with time and resource constraints, led to the decision to focus the analysis on model
 year 2018 and older vehicles.
 The decision to exclude 2016 or earlier vintages follows from the insight that sampling the same make and
 model vehicles across years will make it easier to identify underlying cost trends. Otherwise, changes in
 year-to-year results are significantly driven by changes in the mix of vehicles sold. The fact that the
 Chevrolet Bolt was not introduced until 2017 is the second key reason to begin the analysis with model
 year 2017. In 2017, the Bolt set the all-time EV record in its Consumer Reports’ range test, topping 250
 miles traveled, outperforming its U.S. Environmental Protection Agency-rated range and all vehicles tested
 before then.3 Because the Bolt reset expectations for fully electric economy vehicles, its inclusion in the
 study was deemed essential.
 Used car ownership cost analysis enables new insights into the affordability implications of publicly funded
 incentives encouraging car buyers to choose EVs. The analysis finds that a $9,500 incentive, the maximum
 amount available under Clean Cars 4 All, leads to ownership cost reductions of nearly 40 percent compared
 to the gas car average. The analysis finds a state sales tax waiver would reduce the average purchase price
 premium for non-luxury EVs by 63 percent and 57 percent for model years 2017 and 2018, respectively.
 Table 2 details these policy evaluation results.
 Table 2. Consumer affordability impacts of EV policies
 Incentive policy evaluation 2017 2018
 Ownership savings including $9,500 incentive $10,400 $9,800
 Reduction in EV ownership cost including $9,500 incentive compared to gas car 38% 34%
 Sales tax waiver policy evaluation
 State sales tax on average EV $1,170 $1,350
 Reduction in purchase price premium due to state sales tax waiver for EVs -63% -57%
 Source: Energy Innovation analysis

 The finding that incentives such as those available under Clean Cars 4 All lower EV cost as much as nearly
 40 percent compared to the cost of a gas car is striking. Evidence that a purchase price premium currently
 exists, standing between buyers and total ownership savings, is another significant finding.
 Battery costs have fallen 89 percent in real terms since 2010, 4 bringing EVs close to parity with gasoline
 cars in up-front purchase price. In the future, battery prices will almost certainly continue to fall and
 performance will almost certainly continue to improve for two fundamental reasons. First, new battery
 chemistry options are making progress in the laboratory and are expected to enable leaps forward on cost
 and convenience.5 Second, major advances are in the offing for the lithium-ion technology currently in use
 due to innovation, learning by doing, and economies of scale throughout the supply chain. 6
 The outlook for battery innovation is a key reason EV purchase prices are expected to fall below
 conventional vehicle purchase prices in a matter of years. 7 The International Council for Clean
 Transportation projected new EVs will be less expensive than comparable gas by 2024 for compact cars
 and by 2027 for SUVs. 8 Bloomberg New Energy Finance forecasts a similar crossover point for the purchase
 price of EVs and emphasized predictions have been insufficiently optimistic year after year: “In 2017, a
 Bloomberg New Energy Finance analysis forecast that the crossover point was in 2026, nine years out. In
 2018, the crossover point was in 2024—six years . . . out. The crossover point, per the latest analysis, is now

iii EI | USED ELECTRIC VEHICLES DELIVER CONSUMER SAVINGS OVER GAS CARS
2022 for large vehicles in the European Union. For that, we can thank the incredible shrinking electric
 vehicle battery, which is not so much shrinking in size as it is shrinking—dramatically—in cost.”9

 POLICY IMPLICATIONS

 California’s Senate Bill 350 launched a major effort to understand barriers to adoption and use of clean
 technologies in less advantaged communities—and to develop ways to overcome those barriers.10 An
 information gap was found to be one of the obstacles to consumer adoption of EVs: “In making vehicle
 purchase decisions, clean vehicles are not yet viewed as affordable, reliable or as convenient as gas
 counterparts.”11 The findings presented here are offered in service of remedying this information gap, and
 point to the following recommendations for policymakers.
 The topline conclusion of this research is that consumer incentive policies continue to play an important
 role in an effective, equitable transition to EVs. Consumer incentives broaden access to EV ownership
 savings. For lower-income households, the EV purchase price premium will be an especially large hurdle to
 benefitting from the stream of future energy and maintenance savings that EVs offer.12
 Incentives for used EV buyers targeted to lower-income and other less advantaged communities can
 deliver dramatic economic equity benefits. The nearly 40 percent reduction in ownership cost appears to
 represent an equity benefit that is unsurpassed among other energy, climate, and transportation policies.
 The impact of these savings is amplified by the relative burden of transportation costs for less wealthy
 households. Transportation is the second-largest expense for all U.S. households and presents a particular
 burden for lower-income households. As a share of after-tax income, transportation costs for households
 making $22,487 or less per year are more than three times larger than for households with income of
 $120,729 or more (37.4 percent and 11 percent of total expenditures, respectively).13
 Incentive support targeted at the median car buyer remains important. Marketing surveys find car buyers
 in general place significant weight on purchase price.14 Broad encouragement of consumer uptake is
 needed as EV sales expand beyond early enthusiasts to mainstream buyers. Continued funding and greater
 certainty about future allocations are essential for optimizing the state’s flagship Clean Vehicles Rebate
 Program.
 Expanded governmental support for EV financing is another priority for a fair and fast transition to EVs.
 Though used cars are less expensive than new cars, used car buyers still frequently use credit. Lower
 interest rates greatly reduce the cost of credit. Favorable loan terms—low or zero down payments and
 interest rates—greatly reduce the cost of credit and would expand access. One immediately available
 option is to allow EV buyers to partner with electric utilities to secure better financing. Such policies have
 a track record of success and could be established under current regulatory authority, without new
 legislation.15
 Lower electricity prices improve EV affordability. Therefore, to better support consumer EV uptake,
 California should change the way revenue generated from cap-and-trade program auctions is returned
 to electricity-sector customers. The state should use this revenue for rate reduction instead of returning
 it to people on a lump-sum basis, currently labeled in utility bills as the “California Climate Credit.” That
 approach made sense when the policy was set over a decade ago, but no longer.
 Two additional policy recommendations related to EV policy, though not directly tied to quantitative
 results, are offered. The first relates to charging infrastructure. The result of this study implicitly assumes
 EV owners will be able to install charging infrastructure. In fact, renters, and some, if not most, residents
 of multi-unit dwellings will be unable to install EV chargers. Policymakers should anticipate the need for

iv EI | USED ELECTRIC VEHICLES DELIVER CONSUMER SAVINGS OVER GAS CARS
ongoing policy work to ensure widespread and equitable access to charging infrastructure, especially in
 existing multi-unit buildings.16
 This consumer affordability study does not directly address job creation. However, separate research shows
 that California’s EV leadership has already paid off by boosting motor vehicle manufacturing jobs to record
 heights—nearly double historical levels.17 Building on this success, California policymakers should seek to
 grow jobs in the battery-electric storage manufacturing industry, including the lithium production
 aspects of the supply chain. California also already hosts battery manufacturers, including Los Angeles-
 based Romeo Power, and companies working on the next generation of battery technology, such as San
 Jose-based QuantumScape. The report, “Building on the Lithium Valley,” sketches out a vision for turning
 lithium dissolved in the water of California’s Salton Sea into a reliable, responsibly managed source for
 lithium extraction.18

 PUBLIC POLICY REMAINS ESSENTIAL

 A convergence of technological, economic, and political trends is creating optimism that the transition to
 EVs can occur as quickly as climate change demands. Consumer demand is growing quickly and the share
 of EVs in new car sales jumped to 4.4 percent in 2020, up from 2.5 percent a year earlier. EV sales grew in
 absolute terms in 2020 even as overall car sales shrank because of the pandemic. A wave of both
 governmental commitments and industry support further demonstrates growing political will. Seventeen
 nations have pledged to fully transition new car sales to ZEVs, including the largest European economies. 19
 In January 2021, General Motors promised the vehicles it produces will be electric, or otherwise emit no
 tailpipe emissions, by 2035. Less than two months later, Volvo set a 2030 end-date for its complete
 transition to zero-emission vehicles.
 The momentum behind EVs is real, but it would be a mistake to outsource the transition to market forces.
 Consider the nearly ubiquitous petroleum fueling system, built up over more than a century: today its
 convenience represents a societal-scale hurdle to any challenger. This is just one example of the blockages
 facing EVs. Such inertia necessitates a continuing role for smart public policies in successful transportation
 electrification.
 The climate and public health advantages of EVs are well established. This research demonstrates that non-
 luxury EVs currently deliver affordability benefits that are very likely to grow. EVs are certainly not a silver
 bullet—California’s transportation system must support greater mobility choices, reducing unchosen
 dependence on motor vehicle travel. Yet a “silver bullet” standard would be unrealistic. The maturation
 and further promise of EVs as a tool for transportation decarbonization provide genuine reason for
 optimism in the battles to reduce global warming pollution, to improve public health and to build a fairer
 economy.

v EI | USED ELECTRIC VEHICLES DELIVER CONSUMER SAVINGS OVER GAS CARS
CONTENTS
 Summary ......................................................................................................................................................... ii

 Introduction .................................................................................................................................................... 1

 Motivation....................................................................................................................................................... 1

 Context............................................................................................................................................................ 2

 Learning curves and purchase price parity ................................................................................................................ 2

 California policy ......................................................................................................................................................... 5

 Research literature..................................................................................................................................................... 6

 Methodology ................................................................................................................................................... 7

 Total cost of ownership.............................................................................................................................................. 8

 Sampling of 2017 and 2018 model year vehicles .................................................................................................... 10

 Sales-weighted average EV and commensurate gas car ......................................................................................... 11

 Limitations ............................................................................................................................................................... 12

 Results .......................................................................................................................................................... 12

 Policy Implications ......................................................................................................................................... 19

 Looking Forward ............................................................................................................................................ 25

 Growing momentum for transportation electrification .......................................................................................... 25

 The limits of the invisible hand ................................................................................................................................ 26

 Conclusion ..................................................................................................................................................... 26

 Appendix A. Sensitivity Analysis ..................................................................................................................... 28

 Appendix B. Additional Methods Documentation ............................................................................................ 31

 Notes ............................................................................................................................................................ 36

vi EI | USED ELECTRIC VEHICLES DELIVER CONSUMER SAVINGS OVER GAS CARS
Figures
 Figure 1. The price of EV battery packs fell 89 percent from 2010 to 2020 in real terms ............................. 3
 Figure 2. Ten forecasts of expected future battery costs from automakers, analysts, and researchers ....... 3
 Figure 3. The declining share of battery cost in total vehicle production cost .............................................. 4
 Figure 4. The effects of learning curves on solar photovoltaic and wind power technologies ...................... 5
 Figure 5. California EV market share of new car sales by income levels ........................................................ 7
 Figure 6. Transportation fuel price outlook ................................................................................................... 9
 Figure 7. EV efficiency advantage yields lower fuel cost per mile traveled ................................................... 9
 Figure 8. Ownership savings grow with increasing age of used EV at time of purchase ............................. 13
 Figure 9. Breakdown of ownership costs for different vehicle types – 2017 model year ............................ 15
 Figure 10. Breakdown of ownership costs for different vehicle types – 2018 model year .......................... 15
 Figure 11. Pairwise analysis of total ownership savings ...............................................................................17
 Figure 12. Pairwise analysis of vehicle price premium .................................................................................18
 Figure 13. Chrysler Pacifica minivan pairwise comparison finds EV ownership savings............................... 18
 Figure 14. Battery exports grew by more than a factor of four in recent history ........................................24
 Figure 14. Annual new EV sales increased to 3 million units in 2020........................................................... 25

 Tables
 Table 1. EV ownership savings and purchase price premium ........................................................................ ii
 Table 2. Consumer affordability impacts of EV policies ................................................................................ iii
 Table 3. EV models sampled and 2017-2018 sales ......................................................................................11
 Table 4. Specifications for Bolt, Volt, and Leaf and their gas car counterparts ............................................12
 Table 5. EV ownership savings and purchase price premium ......................................................................13
 Table 6. Consumer affordability impacts of EV policies ...............................................................................14
 Table 7. Breaking down total ownership savings and price premium for different vehicle types ...............16
 Table 8. Range specifications for short-range BEVs .....................................................................................16
 Table 9. Residual resale price effects for short-range (sub-100 miles) BEVs ...............................................17
 Table 10. Breakdown of total ownership costs for different vehicle types ..................................................28
 Table 12. Sensitivity analyses results related to BEV depreciation and charging .........................................30
 Table 13. Sensitivity analyses of ownership period, travel demand, discount rate, and range ...................31
 Table 14. Key inputs for the total-cost-of-ownership analysis .....................................................................32
 Table 15. Maintenance costs by powertrain and mileage ...........................................................................32
 Table 16. Home and public charging distribution ........................................................................................33
 Table 17. Ownership savings and purchase price premium results for Clarity and Fusion .......................... 34

 Glossary and Key Abbreviations
 Term Abbreviation Meaning
 battery-electric vehicle BEV Vehicle solely powered by electricity
 electric vehicle EV Plug-in vehicle, including BEVs and PHVs
 gasoline-fueled car gas car A typical car or light truck with internal combustion engine
 plug-in hybrid vehicle PHV Vehicle with two energy systems, one gasoline fueled and
 the other battery electric
 zero-emission vehicle ZEV EVs and hydrogen fuel-cell vehicles

vii EI | USED ELECTRIC VEHICLES DELIVER CONSUMER SAVINGS OVER GAS CARS
INTRODUCTION

 The record wildfire devastation in California and across Western North America in 2020 offers fresh
 evidence of the cost of climate inaction. Humanity still has a window of opportunity to keep warming to
 safe levels. Maintaining a hospitable environment for future generations will require rapidly reducing
 greenhouse gas emissions over the next decade. 20 The possible consequences of climate change are almost
 too terrifying to imagine. Last year’s fires will pale in comparison to the future price of climate inaction.
 Fortunately, great leaps in clean energy technology provide reason for optimism. Decades of research,
 learning by doing, entrepreneurship, and improving economies of scale have produced rapid innovation.
 Renewable technologies are the lowest-cost options for generating electricity in every major economy on
 earth.21 Electric vehicles (EVs) are one of the most promising new technologies, increasingly recognized as
 the technological linchpin for reaching carbon neutrality in the transportation sector. This technological
 advance creates new hope for a rapid transition in the transportation sector, the largest source of
 hazardous local air pollution and greenhouse gas emissions in California.
 Spurred by these climate and public health imperatives as well as the economic development opportunity,
 Governor Newsom’s administration made new strides in clean trucks and cars last year. The state’s
 policymakers have taken steps to ensure the benefits of transportation electrification are broadly shared.
 Though the environmental justice benefits of EVs are widely accepted, the early market success of the
 luxury brand Tesla fostered a perception that EVs are out-of-reach toys of the wealthy. Moreover, new car
 buyers are in general much wealthier than the average person.
 In response to equity concerns, California retooled incentive design. The state was the first to introduce
 income caps on consumer incentives—making high-income people ineligible for incentives for EV
 purchases. The state also developed policies specifically targeting incentives to less advantaged people.
 This study provides new evidence on the affordability of non-luxury used EVs, suggesting alignment—or at
 least no contradiction—between transportation electrification and equity goals. In brief, our study finds
 average total ownership cost savings for buyers of EVs for model years 2017 and 2018. Ownership savings
 are modest on their own, but the state’s Clean Cars 4 All program offers point-of-sale incentives to used EV
 buyers that supercharge the effect. Households near the poverty line in the areas with the highest pollution
 burdens are eligible for incentives of up to $9,500. The net effect is to reduce total cost of vehicle ownership
 nearly 40 percent for an average EV owner compared to the cost to own and operate a similar conventional
 gasoline-fueled car. The effect is even more remarkable considering transportation costs are the second-
 largest component of lower-income household budgets.22
 The remainder of this report provides a fuller discussion of its motivation, the policy context, methodology,
 results, and policy implications.

 MOTIVATION

 In response to the Newsom administration’s initial proposal to add roughly $500 billion to depleted budgets
 for EV incentives, with the lion’s share going to the Clean Cars 4 All program, some have raised economic
 equity concerns. One lawmaker said: “We’re paying people to buy cars, yet people are homeless, and
 they’re being forced to sleep in their cars. It can’t get any more ironic than that.” 23
 This work seeks to add to the scant research available to help answer questions about the affordability and
 equity effects of used EVs. Statistics underline the used car market’s importance. It is more than twice the

1 EI | USED ELECTRIC VEHICLES DELIVER CONSUMER SAVINGS OVER GAS CARS
size of the new car market, with 40 million used car sales versus 17 million new car sales in 2019 nationally.24
 At least a decade into the transportation electrification revolution, EVs are increasingly available in the used
 car market. Because EVs are an emerging technology, research thus far has naturally gravitated toward
 analysis of new car sales.
 The consumer economics of the used car market are particularly germane for lower- and moderate-income
 households. New vehicle buyers are wealthier than the average household. Many people go a lifetime
 without the privilege of buying a new car.

 CONTEXT

 LEARNING CURVES AND PURCHASE PRICE PARITY

 Evidence of a declining price premium bodes well for future affordability benefits provided by used EVs,
 since new car prices are a key determinant of used car prices. On the topic of when EVs will, on average,
 reach purchase price parity, 2019 research from the International Council for Clean Transportation
 projected new EVs will cost less than gasoline-fueled competitors by 2024 for compact cars and by 2027
 for SUVs.25 Bloomberg New Energy Finance forecasts a similar crossover point for the purchase price of EVs
 and also observes that predictions about reaching that point have been insufficiently optimistic year after
 year: “In 2017, a Bloomberg New Energy Finance analysis forecast that the crossover point was in 2026,
 nine years out. In 2018, the crossover point was in 2024—six years . . . out. The crossover point, per the
 latest analysis, is now 2022 for large vehicles in the European Union. For that, we can thank the incredible
 shrinking electric vehicle battery, which is not so much shrinking in size as it is shrinking—dramatically—in
 cost.”26
 Learning curves underpin projections of future crossover points when EVs will cost less to purchase than
 comparable gas vehicles. The term “learning curves” refers to performance improvements and cost
 reductions typically observed over time for new technologies once they reach minimum commercial
 viability. Learning is a function of experience—learning by doing. Learning curves also encompass the
 economies of scale that are achieved as production scales up. As put succinctly by a CEO in the offshore
 wind industry: “The main thing that will make floating wind reduce in price and really cost competitive is
 volume.”27
 EV battery pack costs have fallen sharply—by 89 percent in real terms since 2010, according to market data
 from Bloomberg New Energy Finance. Figure 1 illustrates this trend. The figure charts declining retail price
 measured as the sales-volume-weighted average price for battery packs, including battery cells and other
 inputs needed to produce the whole battery pack.

2 EI | USED ELECTRIC VEHICLES DELIVER CONSUMER SAVINGS OVER GAS CARS
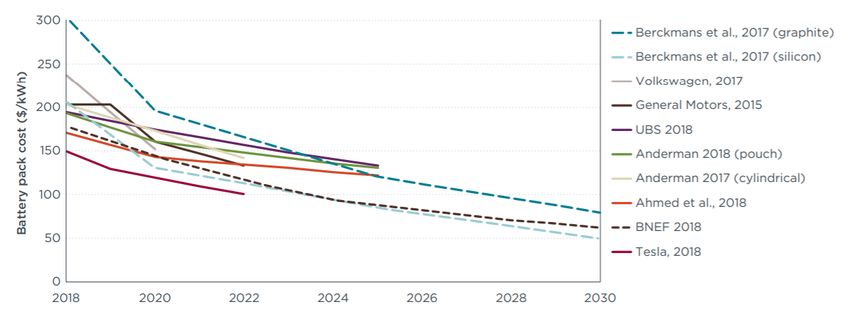
Figure 1. The price of EV battery packs fell 89 percent from 2010 to 2020 in real terms

 Source: Bloomberg New Energy Finance 28
 In contrast to the historical view shown in Figure 1, the next figure presents a forward-looking outlook.
 Figure 2 depicts ten projections of expected future battery costs from a range of sources: automakers,
 consultants, and researchers. One need not wrestle with all the details to observe the overwhelming
 agreement across these different perspectives that battery innovation is likely to continue.
 Figure 2. Ten forecasts of expected future battery costs from automakers, analysts, and researchers

 Source: International Council for Clean Transportation29

 The next figure combines the past- and future-looking trends illustrated in the last two figures to show the
 effect of declining battery costs on overall vehicle costs. Figure 3 shows that Bloomberg New Energy
 Finance expects the percentage of battery costs in overall vehicle production costs to drop from more than
 one half of total costs in 2015 to less than one quarter of total costs in 2025.

3 EI | USED ELECTRIC VEHICLES DELIVER CONSUMER SAVINGS OVER GAS CARS
Figure 3. The declining share of battery cost in total vehicle production cost

 Source: Bloomberg New Energy Finance 30

 An array of studies using different methods—sophisticated statistical analysis,31 economic history,32 and
 case studies33—have also shed light on different aspects of learning curves. An article in the Review of
 Environmental Economics and Policy finds, “strong evidence that environmental regulations induce
 innovation activity in cleaner technologies.”34 The concept of learning curves is not a new one. It was the
 focus of a year 2000 report from the International Energy Agency, for example.35
 Solar technology has emerged as a disruptor in international power markets. The International Energy
 Agency forecasts that more solar photovoltaic capacity will be installed over the next decade than any other
 technology, putting solar “on track to set new records for deployment every year after 2022.” 36 Even as
 solar photovoltaic power generation is rightly recognized as the most remarkable example of learning
 curves in clean energy from recent history, learning curves are also evident in wind power generation, as
 shown in Figure 4, below.
 Figure 4 illustrates the particularly impressive innovation in solar and wind technologies over the last
 decade. To understand why renewables have performed so well, note that the operational costs of fossil
 fuels and nuclear power are higher. Renewable energy plants are different: the operating costs of
 renewable electricity generating technologies are comparatively low and there are no fuel costs. The cost
 of renewable power technologies is almost entirely decided by the cost of the power plant, the cost of the
 technology itself, and financing costs. The disproportionate importance of technology costs as a share of
 total costs associated with wind and solar power plants explains why they exhibit pronounced learning
 curves.

4 EI | USED ELECTRIC VEHICLES DELIVER CONSUMER SAVINGS OVER GAS CARS
Figure 4. The effects of learning curves on solar photovoltaic and wind power technologies

 Source: OurWorldinData.org 37

 Learning curves are by no means unique to renewable energy technologies and batteries. In the realm of
 demand-side clean technologies, the U.S. Department of Energy found that the cost of highly efficient LED
 lights declined 94 percent from 2008 to 2015.38

 CALIFORNIA POLICY

 California’s commitment to transition to 100 percent zero-emission new vehicle sales by 2035 generated
 more headlines, but the state also made transportation policy history last year with its Advanced Clean
 Trucks rule. This policy sets the world’s first zero-emission requirements for trucks and represents a new
 chapter for the state’s innovation in zero-emission vehicle (ZEV) policy. California passed the world’s first
 ZEV standard in 1990, focusing entirely on local air quality challenges. The state’s continued policy
 leadership has clearly played a role in the emergence of EV technology as the odds-on favorite to disrupt
 transportation in the coming years and decades.
 The state’s approach to consumer incentives has evolved based on evidence that early incentive programs
 primarily benefitted wealthier, less diverse areas. The first reforms set income eligibility limits. Today, the
 Clean Cars 4 All program exclusively targets moderate- and lower-income households, with the largest
 benefits going to the lowest-income households in the neighborhoods burdened by the heaviest pollution
 loads. The program supports buyers of new and used EVs, with incentives ranging from $5,500 to $9,500,
 plus up to $2,000 to install a vehicle charger.39 Note that Clean Cars 4 All supports public transit in addition

5 EI | USED ELECTRIC VEHICLES DELIVER CONSUMER SAVINGS OVER GAS CARS
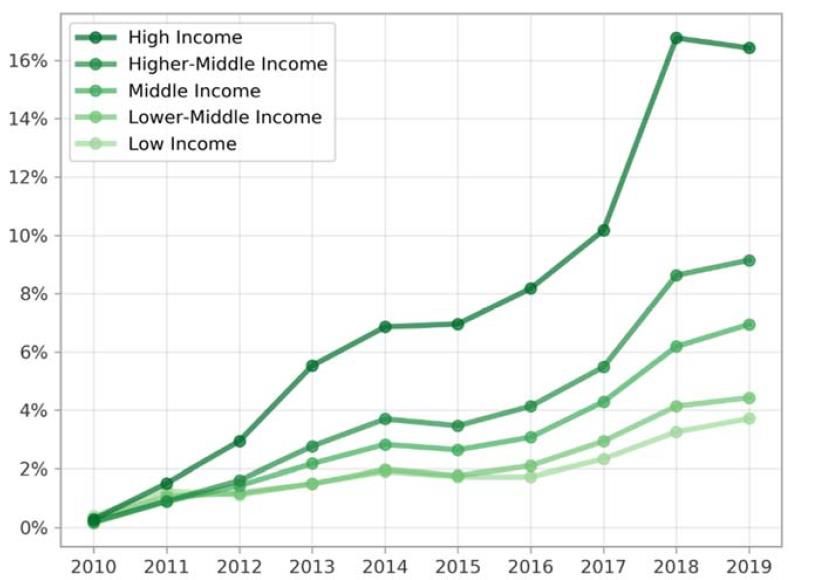
to rebates for EV purchases. The state Clean Vehicle Assistance Program offers both grants and favorable
 loans to support EV buyers. All such programs, however, lack sufficient funding to meet demand.
 Though vehicle electrification is the focus of this study, California’s decarbonization strategy in the
 transportation sector is multi-faceted—as it must be to succeed. The Sustainable Communities Program is
 an umbrella for the portfolio of efforts aiming to increase mobility options to reduce dependence on motor
 vehicle travel, thereby reducing air pollution. The overarching aim is to support growth of walkable, transit-
 oriented communities as well as new micro-mobility options, such as shared electric bikes or scooters.
 Equity has been a longstanding focus of attention in California. For example, Assembly Bill 1015,
 superseding Senate Bill 535, establishes the minimum requirement that 35 percent of revenue from cap-
 and-trade allowance auctions is directed to projects benefitting people in lower-income and disadvantaged
 communities. Carbon pricing revenue has gone to support zero-emission bus purchases by local
 governments and to launch subsidized EV sharing programs for lower-income neighborhoods in
 Sacramento and Los Angeles. More recently, the Clean Mobility Voucher Options program has channeled
 more flexible fiscal and technical support to communities.
 Transportation policy involves cars, trucks, transit, sustainable cities, sustainable freight, and off-road
 vehicles, yet it is just one facet of the state’s overall climate policy portfolio. While touching on electricity
 pricing, this work does not cover the industry sector, building sector, short-lived climate pollutants, or most
 aspects of electricity sector policies.

 RESEARCH LITERATURE

 In the relatively sparse body of research literature, the most similar study is a recent one by Consumer
 Reports, using national-level fuel prices instead of the California-specific ones used in this study. The
 Consumer Reports study is focused on new cars but includes a chapter calculating total cost of ownership
 for used cars, which points to used EVs as a total ownership cost saving opportunity.40 Consumer Reports
 analysis concludes used EVs yield ownership savings because “used-car buyers capture a large fraction of
 the lifetime utility of a vehicle while paying a relatively low percentage of the new-car price.”41
 The Center for Sustainable Energy has produced other directly relevant work. The Center serves as a
 contractor for implementing California’s EV rebate programs and publishes statistical assessments. The
 Center’s most recent report shows the unequal rates of EV adoption for new car buyers in California, with
 16 percent adoption at the uppermost incomes versus 4 percent for the lowest incomes, as illustrated in
 Figure 5, below.42 The trend over time shows an increasing EV adoption gap between more and less wealthy
 new car buyers, except for a slight narrowing of the difference in the most recent data for 2019.
 A recent International Council on Clean Transportation article identifies used EVs as a promising means for
 securing economic equity benefits.43 One difference between that study and this one concerns incentives
 for new EV buyers. The International Council on Clean Transportation’s findings do not factor in
 government incentives for new car buyers. The “EV ownership savings” found by the analysis reported in
 this paper do indirectly reflect new car incentives previously received.

6 EI | USED ELECTRIC VEHICLES DELIVER CONSUMER SAVINGS OVER GAS CARS
Figure 5. California EV market share of new car sales by income levels

 Source: Center for Sustainable Energy44
 Finally, the Institute for Transportation Studies at the University of California, Davis is a leader in policy-
 relevant research, and its Plug-in Hybrid and Electric Vehicle Research Center is studying the used EV
 market. Its “Electric Vehicle Explorer” web page provides ownership cost estimates comparing used EVs
 and conventional cars based on customizable inputs.i

 METHODOLOGY

 Policymakers benefit from summary metrics that “boil down” research findings. This section outlines the
 methodology used to develop such a summary metric for this study. EV ownership savings are calculated
 as the difference between the sales-volume-weighted average ownership costs for EVs and ownership costs
 for the weighted-average of similar gas cars. The same approach is used to estimate the EV purchase price
 premium, which is calculated as the difference in purchase price for an average EV and an average gas car.
 The ownership cost for any individual or household will depend on their specific circumstances. At the risk
 of stating the obvious, not every vehicle travels 11,400 miles per year—the input value underpinning the
 main results. Similarly, some households maintain ownership for shorter or longer periods than the average
 length of used car ownership. Sensitivity analysis is used to explore and illustrate how results change when
 varying these and other input assumptions.
 This methodology section discusses elements included in the total-cost-of-ownership methodology;
 reasons for selecting model years 2017 and 2018 for data analysis; details of the sales-volume-weighted
 average approach for average EV and gas cars; and the average ownership cost saving and price premium,

 i The Electric Vehicle Explorer web page can be accessed at https://phev.ucdavis.edu/project/ev-explorer/

7 EI | USED ELECTRIC VEHICLES DELIVER CONSUMER SAVINGS OVER GAS CARS
including an expression in math notation. Finally, the limitations subsection defines the scope and limits of
 the work. Appendix B provides further details on research methods.

 TOTAL COST OF OWNERSHIP

 Total cost of ownership analysis compares the cost of different types of equipment from the perspective
 of prospective buyers. It is a standard financial planning tool. Total cost of ownership analysis is commonly
 a part of regulatory assessments of vehicle policies. For example, see Appendix D in the California Air
 Resources Board’s Advanced Clean Trucks regulatory proceeding.45
 Total cost of ownership for vehicles includes the cost to purchase a vehicle as well as annual fuel,
 maintenance, and insurance expenses. For battery-electric vehicles (BEVs), ownership costs are also
 assumed to include charger installation cost. For short-range BEVs—those with a range of less than 100
 miles—the analysis adds a depreciation penalty at the end of the ownership period.
 Like most total-cost-of-ownership studies of motor vehicles, this study takes a net present value approach.
 Costs incurred after the first year of ownership are subject to an 8 percent discount rate. ii The analysis
 assumes an ownership period of five and a half years, a recent average for used cars. 46 A description and
 references for each component for total cost of ownership are briefly defined next.
 Vehicle price. The cost of purchasing a vehicle is the single largest part of total ownership cost. Vehicle
 prices are taken from the Consumer Reports “car value estimator” web page.47 Instead of the lower “trade-
 in” value—the estimated price a dealership would be expected to offer—the higher “private party” value
 is used, reflecting “the price you could expect for a vehicle sales transaction between two consumers.”48
 Charger. BEV owners are assumed to invest in a home charger, estimated to cost $1,836, including labor
 installation expenses.49 Plug-in hybrid (PHV) buyers are assumed to forego the added cost of installing an
 electric charger. PHV owners can use their gasoline-combustion powertrain when the electric range is
 exhausted, making them less dependent on their electric powertrain and able to forgo the expense of a
 charger, as many do.
 Fuel. Fuel expenditures are a function of fuel efficiency, fuel prices, and distance driven. Vehicles are
 assumed to travel 11,400 miles per year, the national light-duty vehicle average in recent data.50 Fuel
 efficiency specifications for each vehicle make and model are drawn from the U.S. Department of Energy’s
 “fueleconomy.gov” website, as are battery specifications and new vehicle range. Battery degradation is
 assumed to lead to a 10 percent reduction in battery range compared to a new vehicle.51
 Fuel prices are based on current prices for the first year of ownership. Future year prices are a function of
 current price adjusted by the year-over-year changes in the Pacific region forecast in the U.S. Energy
 Information Administration’s 2021 Annual Energy Outlook. Gasoline prices for 2021 and 2022 are based on
 the U.S. Energy Information Administration’s Short-Term Energy Outlook. This leads to an estimated 2021
 price of $3.62 per gallon, lower than recent levels.

 ii Net present value methodologies account for futurecash flow impacts in current dollar value terms. Money in hand now is considered
 more valuable than money in the future. Future money is less valuable partly because inflation erodes its buying power. Behavioral
 economists have also pointed to evolutionary reasons for time preferences. The effect of the discount rate (d) for a given year ‘t’ years
 in the future can be represented mathematically as the scalar: 1 / (1+ d)t. For this study, with the 8 percent value used in the main,
 discounting means that one dollar saved in the second year of ownership is worth approximately 93 cents and one dollar saved in the
 fifth year of ownership is worth approximately 74 cents.

8 EI | USED ELECTRIC VEHICLES DELIVER CONSUMER SAVINGS OVER GAS CARS
EV electricity prices are a weighted average of home charging, workplace charging, other public charging,
 and fast charging prices. BEV owners are assumed to access fast charging—the quickest and most expensive
 option for public charging, relying on direct current technology—for 5 percent of charging electricity
 demanded. PHV owner are assumed to avoid this costly charging option, instead using gasoline capability
 for longer-range trips that might lead BEV drivers to access fast charging. The small fraction of fast charging
 in the average BEV owner’s basket of charging means the divergence in average electricity prices is not so
 large. The difference for BEVs and PHVs amounts to less than a cent per kilowatt hour for rates around
 18 cents per kilowatt hour. Larger proportions of fast charging are tested as a sensitivity analysis. For
 simplicity, the graph of future expected fuel prices in Figure 6, below, charts a single EV price, calculated as
 the weighted average of BEVs and PHVs.
 Figure 6. Transportation fuel price outlook

 $ per gasoline gallon equivalent (2020 $s)
 $10.00

 $8.00 Electricity
 $6.00
 Gasoline
 $4.00

 $2.00

 $0.00

 Fuel costs also hinge on vehicle fuel efficiency, and in fact the EV efficiency advantage more than
 outweighs the higher cost of electricity per unit of energy content.iii Below, Figure 7 illustrates that gas
 cars are more expensive in terms of the more important metric of cost per mile traveled.
 Figure 7. EV efficiency advantage yields lower fuel cost per mile traveled

 $ per mile traveled (2020$s)
 $0.14
 $0.12
 $0.10
 $0.08
 $0.06 EV

 $0.04 Gas car
 $0.02
 $0.00

 iii For an equivalent in the more familiar kilowatt-hour units, the electricity price is $0.18 per kWh in 2021.

9 EI | USED ELECTRIC VEHICLES DELIVER CONSUMER SAVINGS OVER GAS CARS
Each EV’s “utility factor” also has a role in determining fuel cost. Utility factors indicate the share of miles
 expected to be covered with electricity vs. gasoline for each EV, given its all-electric range. In practice, for
 PHVs, this determines the share of vehicle miles traveled with its electric versus internal combustion
 powertrains. For BEVs, the cost of travel demand satisfied with gasoline-combustion is determined by its
 counterpart vehicle’s fuel cost per mile. For example, the gasoline cost per mile for the Chevrolet Bolt is
 based on the Chevrolet Sonic’s fuel cost per mile.
 Maintenance. Maintenance costs are specified according to averages for gas cars, BEVs, and PHVs,
 specifically with empirical data from Consumer Reports’ 2019 and 2020 annual reliability surveys, which
 sample hundreds of thousands of vehicle owners. Maintenance costs cover regular maintenance and
 unexpected repairs. Consumer Reports’ analysis finds EVs have 60 percent lower maintenance expenses52
 Insurance. The difference in insurance cost for EVs versus gas cars is not large. It is worthwhile including
 nonetheless because of the interest in analyzing the broader EV savings relative to total cost for a gasoline
 car. A recent study by the International Council on Clean Transportation estimates the cost of insurance for
 a new EV to be $170 per month compared to $153 for a new gas car.53 To account for the fact that insurance
 is more expensive for new cars, we scale down this difference to align with the average cost of insurance
 in California.54 This leads to a net increase of $515 in insurance costs for EVs over the average ownership
 period on a net present value basis.
 Depreciation. Depreciation refers to the decline in value that occurs as a new vehicle advances in age and
 number of miles driven. The depreciation variable accounts for differences in residual value—the value at
 the end of the ownership period. Work by Consumer Reports in 2020 found residual value differences are
 diminishing as BEVs improve in range, convenience, and other quality markers, and accounting for federal
 tax credits. Mid- and higher-range BEVs show no significant difference in depreciation compared to gas
 cars. Short-range BEVs do show evidence of depreciating more quickly than conventional cars: “The data
 show that with the exception of mainstream BEVs with less than 100 miles of range, all EV categories are
 expected to hold their value approximately as well as comparable internal combustion engine vehicles.”55
 Therefore, for BEVs with less than 100 miles of range, this study approximates lost residual value beyond
 standard depreciation and adds it to ownership cost under deprecation. This depreciation cost applies to
 three vehicles sampled in this study: the 2017 model year Nissan Leaf and the Kia Soul EV for the 2017 and
 2018 model years.

 SAMPLING OF 2017 AND 2018 MODEL YEAR VEHICLES

 The decision to focus data analysis on 2017 and 2018 model year vehicles resulted from the interplay of
 several factors. The average new car lease lasts three years, which suggests a reasonably abundant supply
 of those model year vehicles. Vehicles from that period have also aged enough to exhibit significant
 depreciation in value since first purchase. The result of depreciation is that it reduces the importance of
 the EVs purchase price premium, meaning “used-car buyers capture a large fraction of the lifetime utility
 of a vehicle while paying a relatively low percentage of the new-car price.”56 Model year 2019 or 2020
 vehicles would exhibit weaker depreciation effects, since less time has passed since purchase, making it
 more difficult to detect the hypothesized used EVs effect. Therefore, sampling was limited to 2018 or older
 cars.
 The decision to exclude 2016 or earlier vintages follows from the insight that sampling and analyzing the
 same set of makes and models over time makes it easier to disentangle innovation and cost trends.
 Otherwise, results are significantly driven by the large changes in the mix of vehicles sold from year to year.
 EV trends are evolving quickly because the technology and market are not yet fully mature. For instance,

10 EI | USED ELECTRIC VEHICLES DELIVER CONSUMER SAVINGS OVER GAS CARS
the Tesla Model 3 shook up the industry when it was introduced in 2018, grabbing a leading market share
 in its debut year.
 More importantly, the Chevrolet Bolt had not yet been introduced in 2016. The introduction of the
 Chevrolet Bolt in 2017 is the second key reason to begin the analysis with model year 2017. In 2017, the
 Bolt set the all-time EV record in its Consumer Reports’ range test, topping 250 miles traveled,
 outperforming its U.S. Environmental Protection Agency-rated range and all vehicle tested before then.57
 Because the Bolt reset expectations for fully electric economy vehicles, its inclusion in the study was
 deemed essential.

 SALES-WEIGHTED AVERAGE EV AND COMMENSURATE GAS CAR

 The goal for constructing generic vehicle types was to achieve commensurability—an apples-to-apples
 comparison, in informal terms. The method seeks to approximate a representative sample through broad
 coverage of top-selling, non-luxury EVs. This is a type of quasi-representativeness that can be distinguished
 from random sampling data collection techniques.
 The California Energy Commission’s Zero Emission Vehicle and Infrastructure Statistics web page is the
 source for sales data.58 In practice, the approach involves aggregating the top selling EVs for model years
 2017 and 2018 and subtracting vehicles identified as luxury or not available in both years. The included EVs
 range from subcompact to mid-size. The Chrysler Pacifica PHV was available in both 2017 and 2018.
 Because it is clearly distinguishable in size and cost from other vehicles included, it was excluded from the
 analysis. However, the conventional Pacifica and the PHV version are compared as a pair in the Results
 section.
 Applying this approach produces a sample of five BEVs and four PHVs. Details on makes and models
 represented by the “average” EV and their sales are listed in Table 3.
 Table 3. EV models sampled and 2017-2018 sales
 Make Model Label 2017-2018 model year sales Sales percentage
 Chevrolet Volt PHV-Volt 24,284 28%
 Chevrolet Bolt BEV-Bolt 22,548 26%
 Toyota Prius Prime PHV-Prius 21,311 25%
 Nissan Leaf BEV-Leaf 9,920 11%
 Volkswagen e-Golf BEV-Golf 4,308 5%
 Kia Soul EV BEV-Soul 1,400 2%
 Kia Optima PHV-Optima 1,239 1%
 Hyundai Sonata PHV-Sonata 1,012 1%
 Hyundai Ioniq BEV-Ioniq 784 1%

 Total 86,806 100%
 Source: California Energy Commission 59
 The approach to developing the “average” gas vehicle takes advantage of the fact that most—all but
 three—of the included EV models are also available with gasoline-combustion-only powertrains. Whenever
 a gasoline-fueled version of an EV was offered, it is used as the obvious choice for that EV’s gas car

11 EI | USED ELECTRIC VEHICLES DELIVER CONSUMER SAVINGS OVER GAS CARS
counterparts in the weighted-average gas car calculation. This approach reduces the statistical noise from
 non-powertrain-related differences between vehicles.
 Some EVs— the Bolt, Volt, and Leaf — have no gas-fueled powertrain version. In these instances, cargo and
 size specifications were used to identify similar vehicles.
 Table 4 gives specifications for the Bolt, Volt, and Leaf and the gas vehicles selected as their analogs for
 inclusion in the average gas vehicle.
 Table 4. Specifications for Bolt, Volt, and Leaf and their gas car counterparts
 EV Gas car EV Gas car EV Gas car
 Make Chevrolet Chevrolet Chevrolet Chevrolet Nissan Nissan
 Model Bolt Sonic Volt Cruze Leaf Versa
 Passenger volume 94 ft3 91 ft3 90 ft3 95 ft3 92 ft3 94 ft3
 Cargo volume 17 ft3 19 ft3 11 ft3 19 ft3 24 ft3 19 ft3
 Length 164 inches 160 inches 180 inches 175 inches 176 inches 163 inches
 Hatchback versions selected for both Chevrolet Cruze and Nissan Versa.
 Sources: Kelly Blue Book, 60 U.S. Department of Energy61

 LIMITATIONS

 This study provides insights on the cost savings resulting from the increasing availability of non-luxury used
 EVs, offering a current consumer perspective on transportation electrification. Like any study, there are
 boundaries to our analytical scope. Analysis of total ownership costs ignores the effects of reducing local
 and global air pollutant emissions, including public health and climate benefits.
 The ownership perspective is just one of several economic dimensions to a transition to EVs. Last year, the
 International Council on Clean Transportation published an influential study of EV production costs in the
 U.S., factoring in not just the cost of manufacturing but also research and marketing costs.62
 Macroeconomic impacts are also beyond the scope of total-cost-of-ownership analysis, but other research
 provides reason for optimism that electrification will provide job creation and growth benefits. A Next10
 study estimates that, in 2030, the state’s EV policies will create 500,000 additional jobs in California while
 boosting real income by $300 billion, noting that “employment and income benefits are proportionately
 higher among Disadvantaged Communities.”63

 RESULTS

 TOPLINE

 The review of findings begins with the topline results, i.e., the highest-level summary findings, on total cost
 of ownership and purchase price. As detailed in the comparative metrics discussion, EV ownership savings
 refer to the net difference in total ownership cost between an average EV and a comparable gas car.
 Ownership savings are estimated to be $1,100 for model year 2017 EVs and $500 for model year 2018 EVs.
 Lower fuel and maintenance expenses generate savings for EV buyers but, for the 2017 and 2018 model
 years evaluated, EVs cost more to buy than comparable gas cars. In other words, they carry a purchase

12 EI | USED ELECTRIC VEHICLES DELIVER CONSUMER SAVINGS OVER GAS CARS
You can also read