Assessing HVDC Transmission for Impacts of Non Dispatchable Generation - June 2018 - EIA
←
→
Page content transcription
If your browser does not render page correctly, please read the page content below
Assessing HVDC Transmission
for Impacts of Non‐Dispatchable
Generation

June 2018

Independent Statistics & Analysis   U.S. Department of Energy
www.eia.gov                            Washington, DC 20585
June 2018

Assessing HVDC Transmission for Impacts of Non‐Dispatchable
Generation
Given the increase in renewable generation in recent years, it has become increasingly important to
understand the manner in which operational challenges arising from intermittency may be mitigated with
other technologies or operating procedures. One such technology is high-voltage direct current (HVDC)
transmission lines. To help better inform the U.S. Energy Information Administration’s (EIA) long-term
planning models and projections, EIA commissioned a study from ICF Incorporated, LLC (ICF) to assess the
role that HVDC transmission lines may play as additional renewable generation sources become integrated
into electrical grids.

More specifically, ICF was asked to review the extent to which they believed HVDC lines may mitigate
challenges resulting from additional renewable generation, the advantages and disadvantages of using HVDC
lines to transmit the electricity generated from renewable sources, and the potential costs of constructing
additional HVDC lines in a formal analysis based on many sources of information.

To provide some background, electricity generated by renewable resources can be categorized into two
types—dispatchable and non-dispatchable generation. Dispatchable generation sources include conventional
hydroelectric, geothermal, and biomass. Non‐dispatchable (or intermittent or variable) generation sources
like solar and wind, however, depend on the resource availability, such as when the sun is shining or the wind
is blowing. As a result, these technologies have limited capability to respond to generation dispatch signals.

The increasing deployment and penetration of non-dispatchable renewable generation from resources like
solar and wind can lead to electrical system operational issues, which include under- or over-generation
during times of high or low electricity demand. Such conditions could potentially require additional grid
services to accommodate the associated fluctuations in generation delivered from these resources.

Power transmission lines facilitate the bulk transfer of electricity from a generating station to a local
distribution network. The U.S. electric transmission network consists of around 700,000 circuit miles of lines.
Most of these lines operate with alternating current, which is how power is typically generated and delivered
to the end-use customers.

HVDC lines have typically been used to transfer large amounts of power over long distances. They are now
being proposed as a way to move electricity generated from wind in high-quality wind resource regions to
other parts of the country. If properly configured, direct current transmission could also help mitigate
operational issues with wind and solar generation such as a mismatch in generation in relation to the need
for increased ancillary services associated with renewable generation. This can be accomplished by
effectively moving electricity generated from wind or solar resources from areas of high penetration to areas
with lower penetration.

It should be noted that challenges associated with increased penetration of generation from wind and solar
resources may also be mitigated using a variety of other technologies or practices, including smart grid
technologies, energy storage, or other flexible generating technologies. However, the role that HVDC lines
may play in mitigating some of the potential challenges imposed by the growth in non-dispatchable
renewable generation on electric grids is an important consideration.

U.S. Energy Information Administration | Assessing HVDC Transmission for Impacts of Non‐Dispatchable Generation           1
June 2018

APPENDIX

U.S. Energy Information Administration | Assessing HVDC Transmission for Impacts of Non‐Dispatchable Generation           2
Assessment of the Potential for
                                   High‐Voltage Direct Current
                                   Transmission to Mitigate Impacts of
                                   Non‐Dispatchable Generation
                                   Technologies

                                   FINAL REPORT

                                   March 2018

Submitted to:
United States Energy Information
Administration (EIA)
Washington, DC

Submitted by:
ICF Incorporated, LLC
Fairfax, VA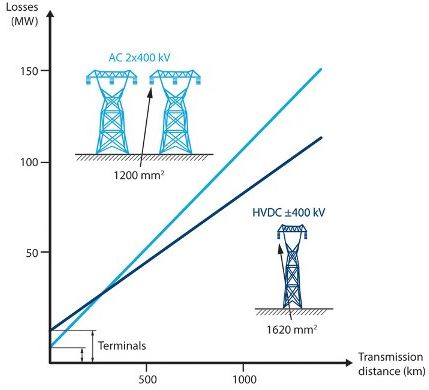
Table of Contents
List of Figures ....................................................................................................................................... ii
List of Tables ........................................................................................................................................ ii
List of Abbreviations, Acronyms, and Initialisms ................................................................................. iii
1. Summary of Findings ....................................................................................................................... 1
2. Introduction and Background .......................................................................................................... 3
   2.1. Objectives of Report ........................................................................................................................ 3
        2.1.1. Review of questions to be answered .................................................................................. 3
        2.1.2. Discussion of approach ....................................................................................................... 4
        2.1.3. Report structure.................................................................................................................. 4
   2.2. Overview of HVDC Technology ........................................................................................................ 4
        2.2.1. History of HVDC technology ............................................................................................... 4
        2.2.2. Modern HVDC lines deployment trends ............................................................................. 5
        2.2.3. HVDC deployment in the United States.............................................................................. 6
        2.2.4. Technical features of HVDC technology ............................................................................. 7
        2.2.5. Advantages and disadvantages of HVDC transmission technology .................................... 9
3. Analysis and Results ...................................................................................................................... 13
   3.1. Role of HVDC in Mitigating Non‐Dispatchable Generation Impacts .............................................. 13
        3.1.1. Impact of large‐scale non‐dispatchable generation on system operation ....................... 13
        3.1.2. Potential HVDC solutions application ............................................................................... 15
   3.2. Summary and Insights on Costs from HVDC Project Case Studies ................................................ 17
   3.3. Cost Trends in HVDC Lines/Technologies in the United States ..................................................... 23
        3.3.1. Cost Estimates from specific case studies of HVDC projects (publicly available) ............. 23
        3.3.1. Summary and insights on HVDC cost trends .................................................................... 25
4. Conclusions ................................................................................................................................... 28
5. References .................................................................................................................................... 29
Appendices ....................................................................................................................................... A‐1
  A.1. Case Studies of Potential Implementation of HVDC Solutions...................................................... A‐1
       A.1.1. TransWest Express Project in CAISO................................................................................... A‐1
       A.1.2. MISO Conceptual HVDC Network Case Study.................................................................. A‐6
       A.1.3. SPP’s Clean Line Project Case Study ................................................................................. A‐11
  A.2. Literature Survey on Applicability of HVDC for Renewable Integration ..................................... A‐18
  A.3. Literature Review on HVDC Project Costs ................................................................................... A‐27
  A.4. List of Existing and Proposed HVDC Projects in the United States.............................................. A‐30
  A.5. Glossary .......................................................................................................................................A‐32

                                                                             i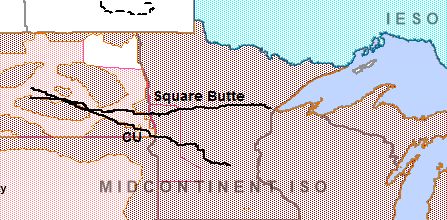
List of Figures
Figure 1. Existing and planned HVDC lines and interties in North America ................................................. 7
Figure 2. Schematic of an HVDC line ............................................................................................................. 9
Figure 3. Comparison of HVDC to HVAC lines (losses and typical configuration) ....................................... 10
Figure 4. Cost comparison curves for HVDC and AC lines (generic estimates)........................................... 12
Figure 5. Generation capacity in the United States by fuel type (existing and planned) ........................... 14
Figure 6. Wind and solar generation capacity in the United States (existing and planned)....................... 14
Figure 7. Net generation trends in the United States (by fuel type) .......................................................... 15
Figure 8. Installed capacity trends for CAISO (existing and planned) ....................................................... A‐1
Figure 9. Recent net generation trends in California (GWh) .................................................................... A‐2
Figure 10. Proposed TransWest project in Western Interconnect ........................................................... A‐4
Figure 11. Installed capacity trends in MISO ............................................................................................ A‐7
Figure 12. Recent historical net generation trends in MISO (GWh) ......................................................... A‐7
Figure 13. Conceptual HVDC network assessed by MISO study ............................................................... A‐9
Figure 14. Square Butte HVDC line ......................................................................................................... A‐10
Figure 15. Installed capacity trends in SPP ............................................................................................. A‐12
Figure 16. Recent historical net generation trends in SPP...................................................................... A‐13
Figure 17. Nodal and hub pricing trends in SPP “Wind Alley” region ..................................................... A‐14
Figure 18. Average net generation profile curve for SPP by the hour of the day (a typical spring week in
March) ..................................................................................................................................................... A‐15
Figure 19. Overview of proposed clean line HVDC line .......................................................................... A‐17
Figure 20. Unit cost estimates of HVDC technology .............................................................................. A‐29

                                                                  List of Tables
Table 1. Penetration levels corresponding to historic market initiatives ................................................... 20
Table 2. Maximum renewable penetration in select ISO/RTOs .................................................................. 20
Table 3. Changes in penetration levels for alternative mitigation solutions .............................................. 21
Table 4. NREL JEDI project cost data for a hypothetical 500 kV, 100‐mile bi‐pole HVDC line .................... 25
Table 5. Summary of recent literature on HVDC and its application in solving renewable intermittency
.............................................................................................................................................................. …A‐23
Table 6. Cost estimates of HVDC projects (based on literature review)................................................. A‐27
Table 7. Transmission and infrastructure cost estimates (for a hypothetical HVDC line) ...................... A‐29
Table 8. Existing HVDC projects .............................................................................................................. A‐30
Table 9. Proposed HVDC projects in the United States (selected) ......................................................... A‐31

                                                                                 ii
List of Abbreviations, Acronyms, and Initialisms
AC Alternating current
BLM Bureau of Land Management
BPA Bonneville Power Administration
CAISO California Independent System Operator
CCC Capacitor‐commutated converter
CFE Comisión Federal de Electricidad
CIGRE Council on Large Electric Systems
CREZ Competitive Renewable Energy Zone
DC Direct current
DIR Dispatchable intermittent resource
DOE Department of Energy
EI Eastern Interconnect
EIM Energy Imbalance Market
EIA Energy Information Administration
EPRI Electric Power Research Institute
ERCOT Electricity Reliability Council of Texas
ETSAP Energy Technology Systems Analysis Programme
FCA Forward capacity auction
FERC Federal Energy Regulatory Commission
FOSG Friends of Supergrid
FRT Fault ride through
GTO Gate turn‐off
HVAC High‐voltage alternating current
HVDC High‐voltage direct current
HTP Hudson Transmission Project
IEEE Institute of Electrical and Electronics Engineers
IGBT Insulated‐gate bipolar transistor
IGCT Integrated gate‐commutated thyristor
IOU Investor‐owned utility
IRENA International Renewable Energy Agency
iiiList of Abbreviations, Acronyms, and Initialisms
ISO‐NE Independent System Operator – New England
JEDI Jobs and Economic Development Impact
LADWP Los Angeles Department of Water and Power
LCC Line‐commutated converter
LCOE Levelized cost of energy
MI Mass impregnated
MISO Midcontinent Independent System Operator
MMC Modular multilevel converter
MVP Multi‐value projects
NREL National Renewable Energy Laboratory
NTTG Northern Tier Transmission Group
PES Power & Energy Society
PMU Phasor measurement unit
QTR Quadrennial Technology Review
RMS Root‐mean square
ROW Right‐of‐way
RPS Renewable portfolio standard
SPP Southwest Power Pool
TSO Transmission system operator
TVA Tennessee Valley Authority
TWE TransWest Express
UHVDC Ultra‐high‐voltage direct current
VER Variable energy resource
VSC Voltage‐source converter
WECC Western Electricity Coordinating Council
XLPE Cross‐linked polyethylene
ivHVDC and Non‐Dispatchable Generation
1. Summary of Findings
Worldwide, there has been a renewed resurgence and interest in developing high‐voltage direct current
(HVDC) transmission projects for economic interregional transfer of electric power (Patel 2017). In the
United States, several HVDC projects are in the planning pipeline to facilitate integration of renewable
resources in remote host regions to distant load centers. This study examines the role of HVDC lines in
mitigating the impacts of non‐dispatchable renewable generation technologies. Non‐dispatchable
technologies (or intermittent or variable generation technologies), like solar and wind, operate based on
resource availability, thereby creating dispatchability challenges for system operators. The report
addresses a number of specific questions raised by the U.S. Energy Information Administration (EIA)
designed to examine the circumstances under which HVDC lines play a role in integrating renewables, the
extent to which HVDC lines can mitigate the impact of non‐dispatchable renewable generation, the
configurations of HVDC suited for renewable integration, potential grid issues in using HVDC lines for
renewables integration, and the potential costs of constructing these lines based on experiences to date.
This study is based on a three‐pronged approach. First, ICF reviewed several publicly available sources to
assess the suitability of HVDC technology in addressing grid integration issues related to the development
of renewable energy. Second, ICF compiled and summarized the recent trends in HVDC project costs
based on publicly available sources to address questions related to cost‐effectiveness of deploying HVDC
solutions for renewable integration. Third, ICF relied on three detailed case studies—TransWest Express
(TWE) Project interconnecting Wyoming and California, Plains & Eastern’s Clean Line Project in Southwest
Power Pool (SPP) and the Tennessee Valley Authority (TVA) service territory, and Midcontinent
Independent System Operator’s (MISO’s) conceptual HVDC network—to address the questions outlined
in the project scope. The key findings from the study are summarized below.
The negative impacts of non‐dispatchable renewable generation include generation curtailment,
depressed or negative energy prices, system stability issues because of mismatch of generation and
demand, increased need for ancillary services, and inefficient unit commitment and dispatch. Increased
grid interconnection through HVDC transmission would enable more flexibility in power transmission from
regions with excess renewable resources (host) to regions with high electricity demand (client). Since
HVDC is decoupled from the alternating current (AC) system, the transfer from the host to client regions
can be achieved with minimal impact on the underlying AC transmission system of the host region.
Further, because HVDC has relatively low losses over long distances, the distance between the host and
client regions does not affect the ability to derive the renewable integration benefits.
Without a detailed modeling of HVDC projects, it is difficult to ascertain if there would be any reliability
implications of using an AC network of the host region to interconnect renewable resources in the host
region. The renewable penetration levels at which HVDC solutions are likely to be deployed (that is, in lieu
of AC solutions) to mitigate non‐dispatchable generation impacts tend to vary across bulk power system.
Factors such as the robustness of the underlying transmission network, the mix of generation resources,
availability of flexible resources, and the nature of the ties to neighboring systems will all affect the level
at which HVDC solutions will be deployed. Nevertheless, the current consensus from a review of available
literature is that HVDC lines make economic sense at higher penetration levels of renewables.
1HVDC and Non‐Dispatchable Generation
The cost of an HVDC transmission system depends on many factors such as power capacity to be
transmitted, type of transmission medium (submarine or land‐based), environmental considerations,
access to easements rights‐of‐way (ROWs), and cost of converter stations and associated equipment. A
lack of recent HVDC projects in the United States makes it difficult to ascertain typical project costs. Based
on a review of recent proposals and relevant regulatory filings, the cost of HVDC projects ranges between
$1.17 million per mile and $8.62 million per mile (2017$).
2HVDC and Non‐Dispatchable Generation
2. Introduction and Background
EIA is interested in assessing the potential for HVDC transmission networks to mitigate the impacts of
non‐dispatchable generation technologies. Non‐dispatchable technologies (or intermittent or variable
generation technologies), like solar and wind, operate when the indigenous resources are available,
thereby creating dispatchability challenges for system operators.
Some of the key operational issues associated with variable or intermittent generation include lack of
sufficient generation resources during the times of high system demand, excess generation resources
during times of low system demand, and increased need for ancillary services (like spinning or non‐
spinning reserves) to meet the ramping requirements associated with fluctuations in intermittent
generation. One application of HVDC lines suggested in the literature is the use of these transmission lines
to interconnect different regional power markets. These interconnections help to deliver power from a
power surplus region (host region) to that of a power deficient region (client region). The HVDC terminals
function as a point‐source generation injection to balance variations in intermittent renewables
generation in a given regional network.
The goal of the project is to assess the technical potential challenges in deploying HVDC interconnections
to mitigate the impacts of variable generation, and evaluate recent cost trends associated with these
types of projects. As outlined in the project scope document, ICF addresses the following questions in this
report:
How and to what extent HVDC transmission may be used to mitigate non‐dispatchable generation
impacts?
Are direct current (DC) tie lines between balancing authorities sufficient to transfer system
impacts from host to client regions, or must the non‐dispatchable generator(s) be directly
connected to the client region, bypassing any interaction with the host region?
Are some system configurations and topologies of AC and DC interfaces more effective at
mitigating some or all impacts from non‐dispatchable generation?
At what penetration levels of non‐dispatchable generation would we expect these solutions to be
deployed?
How does the penetration level change based on the type of non‐dispatchable technology
deployed, the share of conventional generation technologies, and/or other regional
characteristics?
What other parameters influence and/or determine the deployment of HVDC?
Are there limits to how well HVDC can mitigate intermittency impacts?
What are estimates of the cost of deploying HVDC for these purposes at various levels of supply?
The report addresses the following questions in relation to estimating the cost and rate of return on
investment of deploying HVDC:
What has been the historical cost per mile or cost per MW‐mile in developing HVDC transmission
facilities in the United States?
3HVDC and Non‐Dispatchable Generation
What are the cost components, specifically fixed (costs that are independent of line length) and
variable costs (costs that are a function of line length)?
What factors influence these costs (such as regional labor costs, geography, population density,
and so forth)?
What cost‐related factors may constrain HVDC deployment?
To address these questions, ICF reviewed several publicly available sources, mainly focusing on renewable
energy grid integration and HVDC line costs. Except for a few merchant HVDC projects, there have been
few HVDC line projects in recent years in the United States. As a result, a lot of the current available
research on this topic originates from Europe, where many HVDC projects are being proposed and are
currently being implemented for renewable integration. The sources discussed are mostly peer‐reviewed
journal articles, research reports, industry newsletters, or case studies published by industry vendors,
research labs, and other reputed transmission industry stakeholders. The HVDC cost trends were also
extracted from publicly available sources. The National Renewable Energy Laboratory (NREL) JEDI 2017
report contains the most detailed cost breakdown of HVDC transmission including annual operation and
management (O&M) costs for hypothetical HVDC projects. ICF also relied on the Transmission Expansion
Planning Tool used by the Western Electricity Coordinating Council (WECC) since 2014, which provides
capital and other miscellaneous costs relating to HVDC transmission projects. The full list of resources
examined is included in the bibliography.
The remainder of this section provides a brief historical background on HVDC technology. The third section
examines the main issues posed by EIA—examining the impacts of HVDC lines in mitigating the system
impacts of variable energy generation from renewables. The report also examines three case studies—
the TWE project interconnecting Wyoming and California, Plains & Eastern’s Clean Line Project in SPP and
TVA, and MISO’s conceptual HVDC network—to highlight the challenges and issues related to HVDC and
renewable integration. This section includes a summary of insights from the three case studies in a
question‐and‐answer format designed to address the questions raised in the project scope. The study also
examines the cost trends for recent HVDC projects to address the cost‐related questions in the project
scope. The Appendix includes five sections: a summary of recent reports and articles on utilizing HVDC
technology to address renewable intermittency issues, detailed discussions of the shortlisted case studies,
an inventory of existing and proposed HVDC projects in the United States, and a glossary of technical
terms used in the report.
Power plants are often located near an energy source, such as a coal mine, to minimize fuel transportation
costs. These power plants often are located away from heavily populated load‐centers; therefore,
transporting the electricity generated economically is important. This is accomplished by transmitting the
generated power at a high voltage (stepping up at the power plant and stepping down at the substation
using a transformer at both ends). Early pioneers like Thomas Edison who first began to harness electricity
4HVDC and Non‐Dispatchable Generation
for useful purposes did this by placing generators right next to the equipment that used the electricity.
These early generating stations delivered electricity over copper wires using DC, a method so inefficient
that the power plants had to be within a mile of the load they served.
The first commercial power station was installed at Pearl Station in lower Manhattan, New York, in 1882
(DOE 2014). In the late 1880s, George Westinghouse and others developed cost‐effective transformers to
step up and step down the voltage of AC electricity. With the development of transformers, AC power
could be sent over long distances using relatively smaller wires at a higher voltage. However, by the 1890s
other inventors like Nikola Tesla further refined and commercialized the AC power distribution system.
Cities across the world started constructing high‐voltage power transmission lines that used AC
technology, thereby firmly establishing the prominence of AC technology for transmission purposes.
Typically, transmission of electric power is accomplished at high voltages where the transmission losses
are minimized. For a given quantity of power, doubling the voltage will deliver the same amount of power
at half the current flow. Doubling the voltage reduces the power losses by a factor of four.1
Most of the early attempts to transform the DC voltage to higher or lower levels relied on mechanical
devices, which were not cost‐effective on a commercial scale. The early research on HVDC technology and
potential converter technologies was pioneered by Sweden’s ASEA (Long and Nilsson 2007). 2 Dr. Uno
Lamm of ASEA first patented low‐pressure mercury‐arc converters for HVDC applications in 1929. There
were other technical and manufacturing issues before the first practical mercury‐arc valves could be built.
Early demonstrations of HVDC technology was also tested and implemented in the Soviet Union (now
Russia) in 1951 between Moscow and the nearby city of Kashira (Long and Nilsson 2007). The first
commercial HVDC link, developed by ASEA, was constructed in 1954 for carrying power between mainland
Sweden and the island of Gotland. The line was rated at 100 (kilovolt) kV and had the capacity to deliver
20 megawatt (MW) of power.
In the 1970s, HVDC lines were constructed with solid‐state converter devices like thyristor valves. HVDC
that uses thyristor valves is also known as line‐commutated converter (LCC) HVDC (Long and Nilsson
2007). In the mid‐1990s, voltage‐source converters (VSCs) were commercialized for HVDC applications. In
recent years, power electronics devices like insulated‐gate bipolar transistors (IGBTs), gate turn‐off (GTO)
thyristors, and integrated gate‐commutated thyristors (IGCTs), have made smaller HVDC systems more
economical (Rudervall, Charpentier and Sharma 2000). Currently, the longest HVDC line in the world is
the Rio Madeira link in Brazil, which connects hydropower plants in the Madeira River in the Amazon basin
to major urban load centers like Sao Paulo and Rio de Janeiro in southeastern part of Brazil (ABB n.d. a).
This HVDC link consists of two bipolar 600 kV DC transmission lines with a line length of 2400 kilometers
(km) and a transmission capacity of 3150 MW on each pole. China currently leads in the construction of
HVDC transmission lines in the world today. China has also successfully implemented ultra‐high‐voltage
direct current (UHVDC) transmission lines in recent years (rated at 800 kV and above) (ABB 2016). China
1 Power P = V*I. Doubling of voltage (V), reduces the current (I) by half.
Power loss L =I2*r= (P/V)2*r. Doubling of voltage, reduces the losses (L) by a factor of four.
2
Allmänna Svenska Elektriska Aktiebolaget (ASEA) (General Swedish Electric Company) was a Sweden‐based engineering
company. In 1988, it merged with the Swiss company Brown, Boveri & Cie (BBC), which then became the ABB (ASEA Brown
Boveri) Group. ASEA is now the holding company of ABB Group.
5HVDC and Non‐Dispatchable Generation
is currently planning to build the Changji‐Guquan UHVDC link between Xinjiang regions in the northwest
to Anhui province in the eastern region of China. The UHVDC line is expected to be rated at 1100 kV
voltage, 3000 km in length, and 12 gigawatt (GW) of transmission capacity. When completed, this project
is expected to set world records for HVDC lines in terms of voltage level, transmission capacity, and line
length.
In the United States, the first commercial HVDC project was the 500 kV Pacific DC Intertie connecting
Bonneville Power Administration’s (BPA) service territory in the Pacific Northwest to Los Angeles
Department of Water and Power (LADWP) service territory in California (Bonneville Power Administration
2010). The project was completed in 1970 and was undertaken as a collaborative effort between General
Electric of the United States and ASEA of Sweden. The line was built to deliver low‐cost hydropower from
BPA region to load centers in southern California. The other important HVDC line in the Western
Interconnection region is the Intermountain HVDC Transmission link (or Path 27) between Adelanto
Converter Station in LADWP service territory in California and Intermountain Converter Station in Delta,
Utah. The line is a bipolar line capable of operating at ±500 kV and can transmit up to 2400 MW of power.
In the Eastern Interconnection, the longest‐operating HVDC link is the Quebec – New England
Transmission that connects Radisson, Quebec and Sandy Point in Ayer, Massachusetts (in ISO‐NE service
territory). The line is capable of operating at ±450 kV and can transmit up to 2000 MW. This line was built
to deliver low‐cost hydropower from the Hydro Quebec region to load centers in Boston area of
Massachusetts.
In addition to these utility‐developed HVDC links, numerous merchant HVDC links have also been
developed in recent years. These projects are primarily submarine cable systems that interconnect
adjacent ISO/RTOs or supply power to large urban demand centers. These include Trans Bay Cable in San
Francisco (±200 kV, 400 MW); Cross Sound Cable (± 150 kV, 330 MW); Neptune Cable (550 kV, 660 MW);
and Hudson Transmission Partners (660 MW). In addition, there are more than 15 HVDC facilities or AC‐
DC interties between the grid networks in North America, including the Eastern Interconnect, Western
Interconnect, Electricity Reliability Council of Texas (ERCOT), and Comisión Federal de Electricidad (CFE)
Mexico.
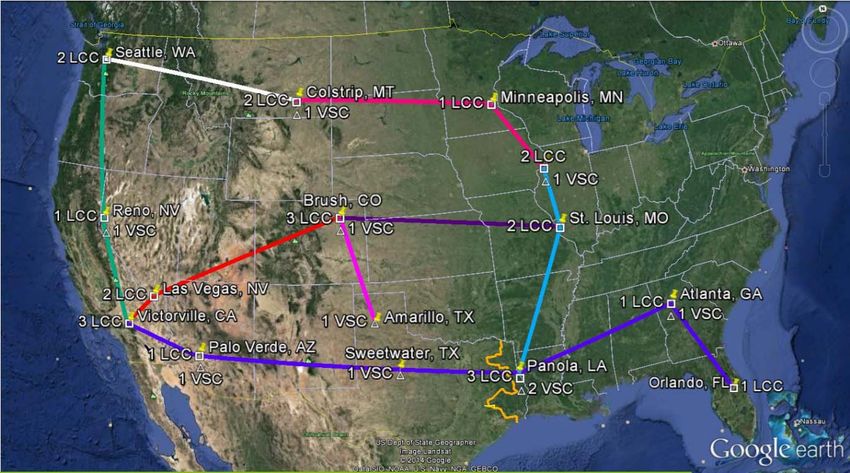
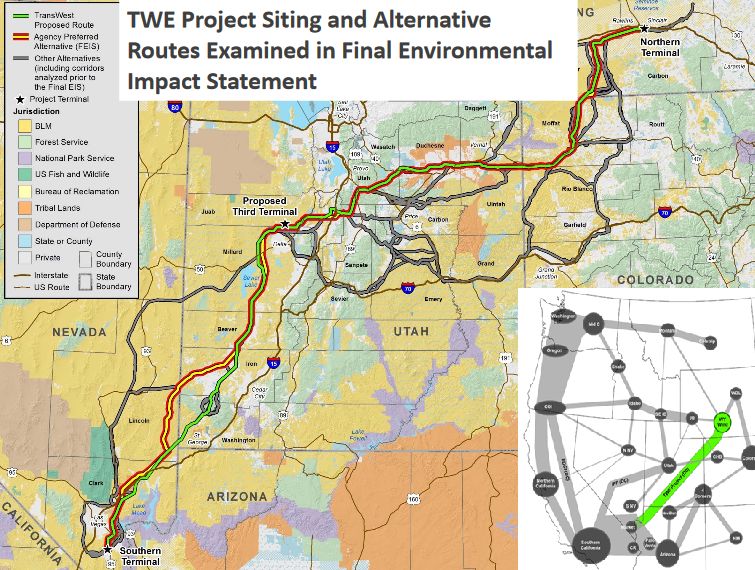
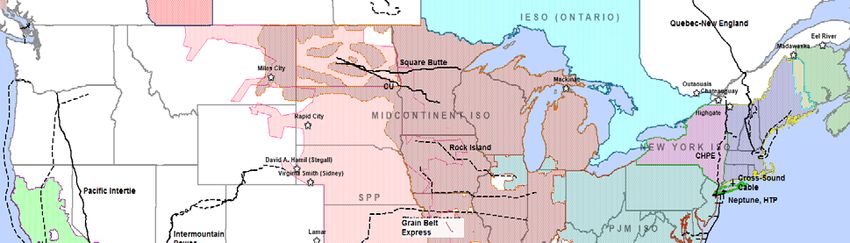
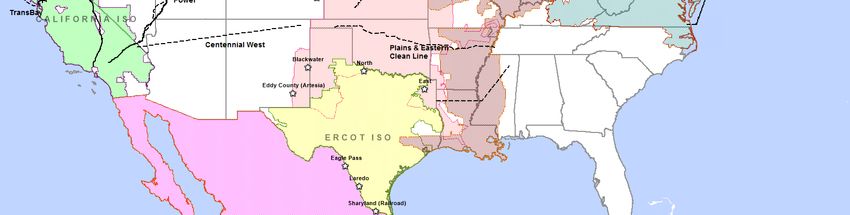
Currently, there are plans to develop the 600 kV, 4000 MW Plains & Eastern Clean Line to deliver wind
power from the Oklahoma‐Texas Panhandle to Arkansas, Tennessee, and other states in the region (Clean
Line Energy Partners 2017a).The project is being proposed to integrate potential wind resources in the
Oklahoma‐Texas Panhandle region (commonly referred to as the “wind alley” region of SPP). Other HVDC
projects like Champlain Hudson Power Express (between United States‐Canada border to New York Metro
area), TWE Transmission Project (between southern Wyoming and Las Vegas metro area), and Northern
Pass project (between Quebec in Canada and New Hampshire in the United States) are all currently in the
planning pipeline.3 Figure 1 illustrates the existing and proposed lines. Appendix A.4. provides a list of
existing and planned HVDC lines in the United States and their characteristics.
3
For information on the existing HVDC lines and proposed projects see: Cross Sound Cable Project; Trans Bay Cable; Neptune
Cable; Hudson Transmission Partners; TransWest; and Northern Pass.
6HVDC and Non‐Dispatchable Generation
Figure 1. Existing and planned HVDC lines and interties in North America
Source: Created by ICF using ABB Velocity Suite Note: Dashed lines represent planned HVDC projects.
2.2.4.1. HVDC layout
Some of the key technical features of an HVDC transmission line are explained in Figure 2. An HVDC
transmission link consists of one or more generator source(s) (except in the case of interties), AC
transmission lines (as part of a dedicated collector system or the local AC network), an AC to DC converter
station, HVDC transmission lines, a DC to AC converter station, AC transmission and distribution lines, and
end‐users. The first converter station converts energy from AC to DC power and then the energy is
transmitted through HVDC transmission lines. Unlike in conventional AC lines, the power flow on HVDC
lines is unidirectional and can be controlled. At the receiver end of the line, the converter station converts
energy from DC to AC power. The power is then fed to the existing AC transmission and distribution system
for delivery to end‐users.
2.2.4.2. Converter technologies
An important component of HVDC technology is the HVDC converter. An HVDC converter transforms
electric power from AC to DC and vice versa. A complete converter station for an HVDC may consist of
several converters in series or parallel. Most HVDC converters are inherently bi‐directional operating as a
rectifier (converting AC to DC) or as an inverter (converting DC to AC). Some of the HVDC lines connecting
remote generators may be optimized for power flow in one preferred direction (that is, toward load
centers).
Early HVDC converters, like the Thury system, rely on electro‐mechanical devices. The Thury system relied
on several motor‐generator sets in series at respective ends of the terminals. The main limitation of the
Thury system was that the series distribution meant there was a greater possibility of power failures. In
addition, the Thury system had high conversion losses and frequent maintenance issues. In the early
7HVDC and Non‐Dispatchable Generation
1930s, mercury‐arc valves were developed and it took well over two decades for the technology to be
incorporated in a commercial HVDC line. Mercury valves rely on line voltage of the AC system to which
the converter is connected to force the current to zero and turn off the valve. Therefore, converters built
with mercury‐arc valves are known as line‐commutated converters (LCCs). Mercury‐arc converters were
used until the early 1970s. In North America, the Nelson River DC Transmission System in Canada was the
largest operating HVDC line with mercury‐arc valves.
Since the 1970s, many of the HVDC lines with mercury valves were replaced with thyristor or other
converter technology. Thyristor valves are solid‐state semiconductor devices that require external an AC
circuit to turn them off or on. Like mercury‐arc valves, even HVDC lines using thyristor are referred to as
LCC HVDCs. Thyristor valves have a breakdown voltage of a few kilovolts each. For a commercial HVDC
converter station, thyristor converters are constructed using a large number of thyristors connected in
series. Additional passive components like grading capacitors and resistors are connected in parallel with
each thyristor to ensure the voltage is shared between the thyristors. In a typical converter station, there
could be hundreds of thyristor circuits. An incremental improvement to the thyristor‐based commutation
are capacitor‐commutated converters (CCCs). The CCCs use a commutation capacitor inserted in series
between the converter transformer and the thyristor valves. Most of the operating HVDCs lines in the
world today rely on thyristor‐based converter technology for conversion.
Since thyristor‐based converters can only be turned on by control action and require external AC line
supply to switch them off, they cannot feed power into a passive system. To overcome this shortcoming,
VSCs using semiconductor devices were developed (Flourentzou, Agelidis and Demetriades 2009). Such
converters have the ability not only to turn on but also to turn off. Two types of semiconductors are
typically used in VSCs: GTO thyristors or IGBTs (Rudervall, Charpentier and Sharma 2000). These
converters have additional advantages, such as the fact that they can switch on and off many times to
improve harmonic performance and they are not dependent on synchronous machines in the AC system
for its operation. A VSC‐HVDC can also feed power to an AC network containing only passive load. VSC
converters are also much more compact and are preferred for applications where converter station space
is at a premium (for example, submarine cables near urban centers). The VSC converter consists of two‐
level or multilevel converters, phase‐reactors, and AC filters. Each single valve element is built up with a
number of series‐connected IGBTs together with associated power electronics devices. The valves, control
equipment, and cooling equipment are usually in enclosures (typically the size of a shipping container),
which make the installation and transportation easy.
2.2.4.3. Other HVDC components
In addition to converters, other components are part of a typical HVDC converter station (see Figure 2).
Transformers at the HVDC converter station adapt the AC voltage level to the high DC voltage level. AC
filters and capacitor banks are installed to limit the amount of harmonics to the level required by the
network. In an HVDC conversion process, the converter consumes reactive power, which is compensated
in part by filter banks and the rest by capacitor banks. In the case of a CCC, the reactive power is
compensated by the series capacitor installed in series between the converter valves and the converter
transformer. With VSC converters, there is no need to compensate any reactive power consumed by the
converter itself. Therefore, the number of filters required for this this type of converters is reduced
drastically.
8HVDC and Non‐Dispatchable Generation
Figure 2. Schematic of an HVDC line
Source: ABB (2014b) (left) and Retzmann (2012) (right).
2.2.4.4. HVDC cables
For HVDC transmission, the transmission lines can be overhead lines or submarine cables. The overhead
line is typically bipolar, that is, two conductors with different polarity. If one pole or line fails, half of power
capacity could still be delivered. Some of the HVDC projects are also used for submarine/underground
transmission. The HVDC cables are typically of two types: solid and oil‐filled. (Rudervall, Charpentier and
Sharma 2000) The solid cables are more prevalent and economical. In this type, insulating paper
impregnated with high viscosity insulating oil is used. No length or depth limitations are applicable for
solid‐type HVDC cables. Over the years, the oil‐impregnated paper‐insulated cables (MI‐PPL) have been
the mainstay of HVDC cables worldwide. The technology was developed in response to demand for higher
voltage, larger capacity (large conductors), and longer transmission line length. This technology is not
limited by converter technology. However, its limited service experience and unsuitability for land cable
applications (because of its higher weight) may limit the use of this technology to just sub‐
sea/underground projects. The oil‐filled type of HVDC cable are completely filled with a low viscosity oil
and work under pressure. These cables are typically used for HVDC applications for less than 60 km
(Rudervall, Charpentier and Sharma 2000). In recent years, cross‐linked polyethylene cables (XLPE) have
also been developed for HVDC applications (Murata, Sakamaki and Abe et al. 2013).
On a point‐to‐point basis for longer distances, the HVDC transmission scheme is generally cost‐effective
when compared to an equivalent AC transmission scheme. HVDC lines are also used in niche applications
like interties between asynchronous grid networks and submarine cables. The advantages of HVDC
applications are summarized below:
Superior economics for long‐distance application. HVDC lines are used to evacuate power
economically from large power generators located away from demand centers. This could be large
hydropower plants (like Madeira Project in Brazil) or a collection of renewable resources in a local
area (like the proposed Clean Line HVDC Project for wind resources in the Oklahoma‐Texas
9HVDC and Non‐Dispatchable Generation
Panhandle). HVDC lines are more economical in comparison to equivalent high‐voltage
alternating current (HVAC) lines because of lower losses and installation costs.
Lower reactive and “skin effect” losses: The power‐carrying capability of AC lines is affected by
the reactive power component of AC power, and the “skin effect” losses, which cause a non‐
uniform distribution of current over the cross‐sectional area of the conductor. HVDC lines are not
affected by reactive power components nor do they experience any losses because of “skin
effect.”
Lower losses: On average, the losses on the HVDC lines are roughly 3.5% per 1000 km, contrasted
with 6.7% for comparable AC lines at similar voltage levels (Siemens 2017). HVDC lines also
experience losses at the converter stations, which range between 0.6 and 1% of the power
delivered. In a side‐by‐side comparison, the total HVDC transmission losses are still lower than AC
losses for long‐distance lines (lower by 30%–40%, typically). Figure 3 compares the losses on a
1200 MW overhead line using HVDC and HVAC configurations. As shown in the figure, beyond the
break‐even distance of 300 km (or 186 miles), the losses on AC lines are consistently higher than
comparable HVDC lines.
Smaller right‐of‐way (ROW) requirements and lower costs: An HVDC line’s transmission tower
configuration is also compact and has a smaller ROW requirement than a comparable AC line of
similar voltage/capacity. Siemens (2017) reports that there is more than 50% reduction in ROW
requirements for UHVDC lines as compared to typical HVAC lines. A bipolar HVDC requires only
two cables as compared to a double circuit AC line with six conductor cables (see Figure 3). As a
result, the construction costs of HVDC lines are lower when contrasted with comparable HVAC
lines.
Figure 3. Comparison of HVDC to HVAC lines (losses and typical configuration)
Source: ABB (n.d. b).
Ability to connect asynchronous AC Systems: HVDC technology is used to interconnect
asynchronous AC networks. In the case of any AC lines, the two networks must be synchronized
(that is, operated at the same voltage, system frequency, and timing). Since HVDC is
10HVDC and Non‐Dispatchable Generation
asynchronous, it can adapt to any rated voltage and frequency it receives. Hence, HVDC
technology is used as interties between asynchronous AC networks worldwide.
Suitability for underwater applications: HVDC technology is the predominant choice for
submarine cables. A cable with insulated sheets and metal outer sheath acts like a capacitor. With
longer distance cable, the capacitance (of the cable increases. For long‐distance AC transmission
using cables, the reactive power flow resulting from the large cable capacitance will limit the
maximum possible transmission distance. Hence, HVDC lines are the only viable options for long‐
distance submarine cables. For these reasons, HVDC lines are preferred for interconnecting
offshore wind plants worldwide.
Higher capacity rating: HVDC lines are also operated at rated peak voltage conditions at all times,
unlike AC lines that on average operate at a root‐mean square (RMS) value of the rated peak
voltage. Since the RMS voltage ratings is only 71% of the peak, the power transmission capability
when operating with HVDC is approximately 40% higher than the capability when operating with
AC.
Ability to handle longer periods of overload operations: HVDC lines can operate at overload
capacity for a limited period (usually at 10%–15% higher than the rated capacity for less than 30
minutes). This would give sufficient time for system operators to implement mitigation measures
under contingency conditions. Such extended operation of the line under overload conditions is
not possible with AC lines.
Ability to manage instabilities: Since HVDC lines can operate asynchronously, they are used to
ensure system stability by preventing cascading failures from propagating from one part of the
grid to another. The direction and magnitude of power flow on DC lines can also be controlled by
system operators. These lines could be used for power injections to balance the grid during any
supply‐demand imbalance.
The HVDC transmission scheme also has disadvantages that relate to cost, conversion equipment,
switching, control, and availability. The disadvantages of HVDC transmission schemes are summarized
below:
Higher costs at short distances. As explained earlier, HVDC lines are cost‐effective only beyond a
certain break‐even distance for corresponding voltage and power capacity. The cost of HVDC
projects are also higher due to converter stations and associated equipment. HVDC projects make
economic sense only for projects exceeding a certain critical distance. As a rough rule of thumb,
ABB reports this critical distance as 60 km (or 37 miles) for HVDC submarine lines and 200 km (or
124 miles) for overhead lines (ABB 2014b). For shorter distances, the investment in HVDC
converter stations and related assets may be larger than comparable AC transmission lines. Also,
maintaining an inventory of customized HVDC assets imposes additional costs on the system
operator/transmission line owner.
11HVDC and Non‐Dispatchable Generation
Figure 4. Cost comparison curves for HVDC and AC lines (generic estimates)
Source: ABB (2014b).
Limited control between terminals: In contrast to AC transmission systems, implementing a
multi‐terminal HVDC system is complicated and cost prohibitive. Controlling power flow between
terminals remains a technical challenge.
Lower availability: HVDC schemes offer lower availability than comparable AC systems, mainly
due to conversion stations and associated equipment. In addition, the converter stations have
limited overload capacity.
Greater complexity in components. HVDC circuit breakers are difficult to build since some kind
of mechanism needs to be developed to force the current to zero without causing arcing and
contact wear. Mechanical circuit breakers are too slow for HVDC lines, although they have been
predominantly used in other applications. Only recently have commercial circuit breakers for
HVDC applications been introduced in the market (ABB 2012), which uses a combination of power
electronics and fast mechanical breakers.
12HVDC and Non‐Dispatchable Generation
3. Analysis and Results
The U.S. generation portfolio is undergoing a significant transformation with ongoing retirements of
baseload units like coal and nuclear, and growth in natural gas, wind, and solar resources (APS Physics
2010, NERC 2016). This shift is driven by several factors, such as existing and proposed federal, state, and
regional environmental regulations, low natural gas prices, and the integration of both distributed and
utility‐scale renewable resources. Renewable resources can be categorized as either (1) dispatchable
renewables (for example, hydro, geothermal, and biomass), which can be dispatched based on system
requirements, or (2) non‐dispatchable renewables (for example, solar and wind), whose output depends
on weather conditions and time of day, and cannot be operated in response to dispatch signals. The
increasing deployment and penetration of non‐dispatchable renewable resources like solar and wind
across the country could pose special challenges to the system operators since these resources cannot be
controlled to meet grid requirements.
Two features of non‐dispatchable renewable resources may prove problematic for overall grid operation
and reliability. First, the output from renewable resources like solar and wind are variable over time and
are subject to local weather conditions. Unlike other conventional technologies like fossil fuel, hydro
(including pumped storage), and nuclear, the output from renewables cannot be planned and dispatched
in advance to meet the projected demand. As a result, these resources are sometimes termed as variable
energy resources (VERs). At low renewable penetration level, VERs pose no system reliability issues.
However, at higher penetration levels, the system demand minus VER generation (or net load that must
be supplied by other dispatchable resources) varies significantly and becomes difficult to predict. This
poses system reliability and power dispatch/commitment challenges to grid operators. The second factor
is the variability in renewable generation calls for increased ancillary service resources to meet higher
ramping requirements, frequency, and voltage support. Some of the reliability services affected by large
integration of VERs include ramping requirements, system inertia and frequency response, and active and
reactive power controls. As penetration of VERs increases, the need for additional system flexibility and
ancillary service requirements will also increase.
In the United States, the share of VERs in the overall capacity mix has been steadily increasing in recent
years. The total installed capacity of solar and wind resources in the country are currently estimated to
be around 106 GW (out of a total capacity of 1,130 GW as of end of 2016). This share is expected to
increase in the near future as the share of VERs increase to 190 GW by 2020 (out of a total expected
capacity of 1,272 GW by 2020). By 2020, the VERs are expected to constitute nearly 15% of the installed
capacity in the United States. The share of VERs is higher in some of the ISO/RTOs like California
Independent System Operator (CAISO), ERCOT, and SPP. Two important factors are driving the surge in
deployment of VERs. First, federal incentives like investment/production tax credits are driving the
renewable growth in recent years (DSIRE 2017). With the incentives expiring in the near future, there is a
rush to develop wind and solar resources. Second, the renewable portfolio standards (RPSs) or obligations
set by different states are contributing to the renewable build‐up. To date, nearly 29 states and
Washington, DC, have implemented some form of a mandatory RPS policy (DSIRE 2017). Additionally,
13HVDC and Non‐Dispatchable Generation
eight additional states have RPS obligations that are not binding. States like California and New York have
set ambitious RPS targets of 50% or more by 2030. With these changes, the national generation portfolio
in the near‐ to long‐term future is expected to change significantly.
Figure 5. Generation capacity in the United States by fuel type (existing and planned)
1,400
1,200
Installed Capacity (GW)
1,000
800
600
400
200
0
200020012002200320042005200620072008200920102011201220132014201520162017201820192020
Biomass Coal Gas Geothermal Nuclear Oil Other Nonrenewable Solar Water Wind
Source: Compiled by ICF using SNL data.
Note: Future capacity estimates are based on actual planned and under‐construction projects.
Figure 6. Wind and solar generation capacity in the United States (existing and planned)
200
180
VERs (Solar & Wind) (GW)
160
140
120
100
80
60
40
20
0
2000 2001 2002 2003 2004 2005 2006 2007 2008 2009 2010 2011 2012 2013 2014 2015 2016 2017 2018 2019 2020
Wind Solar
Source: Compiled by ICF using SNL data.
Note: Future capacity estimates are based on actual planned and under‐construction projects.
The net generation trends for the United States also show an increasing dispatch from VERs like solar and
wind. In 2016, wind and solar contributed nearly 7% of the total generation. From 2001 to 2016, the net
energy generation from VERs increased from 7,280 GWh to nearly 263,626 GWh, with an average annual
growth rate of 27% for the past 15 years. This trend is only expected to increase in the near future with
the planned capacity of solar and wind projects in the pipeline. In the future, curtailment of output from
VERs is also likely to emerge as an acute issue because of over‐generation concerns during light‐load
conditions or potential overloading of transmission lines because of transmission constraints. As
14HVDC and Non‐Dispatchable Generation
penetration of VERs increases on the grid, additional system flexibility and essential reliability service
requirements will also increase.
Figure 7. Net generation trends in the United States (by fuel type)
100% 2% 1%
3% 6%
3%
90% 1%
17%
80%
6% 34%
70%
Net Generation (% of Total)
60% 21%
6%
50%
40% 20%
30%
51%
20%
30%
10%
0%
2001 2002 2003 2004 2005 2006 2007 2008 2009 2010 2011 2012 2013 2014 2015 2016
Coal Nuclear Hydro Natural Gas Oil Other Wind Solar
Source: Compiled by ICF using EIA data.4
A transition to a higher share of VERs in the future requires modifications to the country’s existing electric
grid (IEA‐ETSAP, IRENA 2015, APS Physics 2010). Although the focus of this report is on HVDC technology,
a brief overview of other technological options for renewable integration is provided in this section for
reference. From a technical perspective, increasing VER penetration calls for smart grid technologies,
widespread energy storage, HVDCs line deployment, and adding more flexible generation technologies.
From a market perspective, the regulatory framework must also adapt to reflect the cost structures of
integrating VERs and allow for new services and revenue streams to support these technological options.
As more non‐dispatchable renewable resources are deployed, the economic dispatch of conventional
thermal generation will be significantly affected, requiring generators to ramp up and cycle more often to
account for increased variability. Flexible generation resources like fast‐ramping gas turbines and certain
storage facilities can offer the necessary grid flexibility. Flexible generation resources refer to resources
that interconnect directly to the bulk transmission system and generally possess “fast‐ramp” capabilities.
Such resources are crucial to balance the overall supply‐demand fluctuations caused by VERs. Smart gird
technologies can also act as an enabler for greater VER integration. Some of the load or demand‐side
4 See EIA Electricity Data Browser.
15HVDC and Non‐Dispatchable Generation
technologies like demand‐side management and advanced metering infrastructure help the system
operator to maintain supply‐demand balance in light of intermittent output from VERs. Smart grid
technologies like phasor measurement units (PMUs) and advanced control systems help system operators
to maintain grid reliability in light of intermittent output from VERs. New advances in wind and solar
technologies allow them to operate over a wide range of conditions and provide ancillary services like
frequency and voltage control. This could also contribute to bulk system reliability. Energy storage
technologies can alleviate short‐term variability caused by the intermittent nature of VER output. Energy
storage can also alleviate long‐term variability through careful scheduling and operation of pumped‐
storage hydropower units. In addition, distribution‐level grid configurations like micro‐grids and island
systems can also facilitate greater integration of VERs in the future.
Increased grid interconnection at regional, national, and trans‐national grid networks would enable more
flexibility in power transmission from regions with excess renewable resources to regions with high
electricity demand. Higher interconnection and transmission capacity also enables the optimal use of
surplus generation, alleviates the problems associated with intermittent generation from VERs, reduces
the requirements for ancillary services, alleviates congestion, and obviates the need for new generator
resources in some cases.
However, the focus of this report is restricted to application of HVDC technology to mitigate the problems
associated with renewable intermittency. Not only do HVDC lines facilitate integration of new VERs, they
can also mitigate the impacts of such resources on grid reliability. Many of the promising wind and solar
resources are located far away from the major load centers in the contiguous United States. Integrating
these resources would require constructing new HVDC lines connecting these regions to major load
centers across the country. Conventional HVDC technology can facilitate the integration of renewable
resources like wind and solar spread out in a given local area. HVDC technology also offers a partial
solution to the problem of intermittency of renewable energy. Aggregating the output of VERs over many
individual units substantially increases bulk system reliability and decreases overall supply fluctuations as
well. HVDC lines can also help to transfer power from generation‐excess regions to generation‐deficient
regions to balance the system. Because of these advantages, system operators and developers favor HVDC
solutions to integrate and deliver power to load centers. As discussed earlier, several HVDC transmission
projects are currently proposed to integrate wind resources in the upper‐central Midwest areas, and solar
resources in southwestern areas of the United States to the demand centers on the East and West coasts.
The suitability of such transmission solutions and challenges in implementing the solutions are explained
using three specific case study examples discussed in Appendix A.1.
16You can also read