Ireland and the Europe 2020 Strategy - A review of the social inclusion aspects of Ireland's National Reform Programme in the context of the ...
←
→
Page content transcription
If your browser does not render page correctly, please read the page content below
Ireland and the Europe 2020 Strategy
A review of the social inclusion aspects of Ireland’s National
Reform Programme in the context of the Europe 2020 Strategy

March 2017

Social Justice Ireland                                                                        March 2017

Overview
This report was compiled by Social Justice Ireland in light of the Europe 2020 Strategy and its
high-level targets, and of Ireland’s National Reform Programme, which sets out Ireland’s
response to achieving those targets.
The report covers three of the five headline targets established in the Europe 2020 Strategy and
addressed in the Irish National Reform Programme, namely, employment, education and
‘poverty and social exclusion’. In each of these areas the report identifies the Europe 2020
target and Ireland’s corresponding headline target, and then:
     •    Analyses the current context;
     •    Assesses progress (or otherwise) in achieving the Irish headline target;
     •    Reviews recent policy decisions and assesses their contribution (or otherwise) to Ireland
          achieving its targets;
     •    Identifies a number of issues relevant to the achievement of the targets; and
     •    Makes recommendations on adjusting the targets that Government has set in particular
          areas.
A partnership approach to the development of National Reform Programmes is envisaged in the
Europe 2020 Strategy, involving a range of stakeholders, including those from civil society. The
report, therefore, also addresses the issue of governance relating to the consultation process on
the framing and development of the Irish National Reform Programme. Suggestions are made
on how that process may be improved.
This report has been prepared by Social Justice Ireland drawing on data available from the EU
and from Ireland’s Central Statistics Office (CSO) as well as on on-going work Social Justice
Ireland is doing on European and global issues. It also builds on our previous series of reports
(from 2011 on) on this same topic. Our findings include that the policies pursued over many
years are resulting in the ongoing exclusion of people who already find themselves on the
margins of society and in many cases pushing Ireland further away from reaching many of its
national targets under the Europe 2020 Strategy. This is of major concern to Social Justice
Ireland. It also runs counter to the aim of inclusive growth which is central to the Europe 2020
Strategy.
Implicit in the approach taken in the Europe 2020 Strategy is that economic development, social
development and environmental protection are complementary and interdependent – three
sides of the same reality. Overall, current trends in Irish public policy are running counter to the
promotion of ‘inclusive growth,’ which is one of the three key priorities which underlie the
Europe 2020 Strategy. Inclusive growth is not just about fostering a high-employment economy,
it also aims to deliver social cohesion – it is integral to the Europe 2020 strategy and needs to be
integral to the response of the Irish Government.

1|Page
Social Justice Ireland                                                                                                                     March 2017

Contents
Overview.......................................................................................................................................... 1

1. Introduction and Context ............................................................................................................ 6

   The Europe 2020 Strategy ........................................................................................................... 6

       Priorities, Targets & ‘Flagship Initiatives’ ................................................................................ 7

       Integrated Guidelines .............................................................................................................. 8

   Monitoring and the European Semester ................................................................................... 10

   Irish National Reform Programme - Targets ............................................................................. 11

2. Employment .............................................................................................................................. 14

   European Context ...................................................................................................................... 14

   Ireland: Employment and Unemployment ................................................................................ 16

       Long-Term Unemployment ................................................................................................... 20

       The Working Poor .................................................................................................................. 21

       Youth Unemployment ........................................................................................................... 22

   Irish Government Initiatives ...................................................................................................... 23

   Social Justice Ireland Recommendations for the National Reform Programme ....................... 26

3. Education ................................................................................................................................... 27

   European Context ...................................................................................................................... 27

   Ireland: Education and Europe 2020 Strategy Targets.............................................................. 28

   Ireland: Education More Generally ........................................................................................... 33

       Early-Childhood Education .................................................................................................... 34

       Literacy –Adults and Children................................................................................................ 36

       Lifelong Learning ................................................................................................................... 39

   Social Justice Ireland Recommendations .................................................................................. 43

4. Poverty....................................................................................................................................... 44

       Measures and Metrics ........................................................................................................... 44

2|Page
Social Justice Ireland                                                                                                                   March 2017

   European Context ...................................................................................................................... 46

   Ireland: Poverty ......................................................................................................................... 47

       Ireland and the EU Poverty Indicators .................................................................................. 48

       Ireland: A Closer Look at Poverty .......................................................................................... 53

       Consistent Poverty ................................................................................................................ 57

       Child Poverty ......................................................................................................................... 59

       Working Poor......................................................................................................................... 62

       Incomes in Ireland ................................................................................................................. 62

   Poverty in Ireland: Social Justice Ireland Response................................................................... 66

   Social Justice Ireland Recommendations .................................................................................. 69

   Social Justice Ireland – Proposal for Refundable Tax Credits .................................................... 70

5. Governance ............................................................................................................................... 71

   Partnership in Practice .............................................................................................................. 71

   Social Justice Ireland Response ................................................................................................. 71

   Social Justice Ireland Recommendations .................................................................................. 73

Bibliography................................................................................................................................... 74

Figure 1 Europe 2020 Strategy Framework ..................................................................................... 9

Figure 2, 2013-2015 EU-28 Employment Rate, Age Group 20-64 ................................................. 16

Figure 3 Ireland: Employment, 1993-2015, age 20-60 with Targets ............................................. 17

Figure 4 Unemployment by duration 2007-2015 .......................................................................... 21

Figure 5 Youth Unemployment in Ireland by Gender, 2007-2014 ................................................ 23

Figure 6 Tertiary Education Attainment, 2013-2015, Ages 30-34, with National Target .............. 30

F IGURE 7 E ARLY S CHOOL LEAVING: EU-28 WITH EUROPE 2020 STRATEGY T ARGETS ............................ 31

3|Page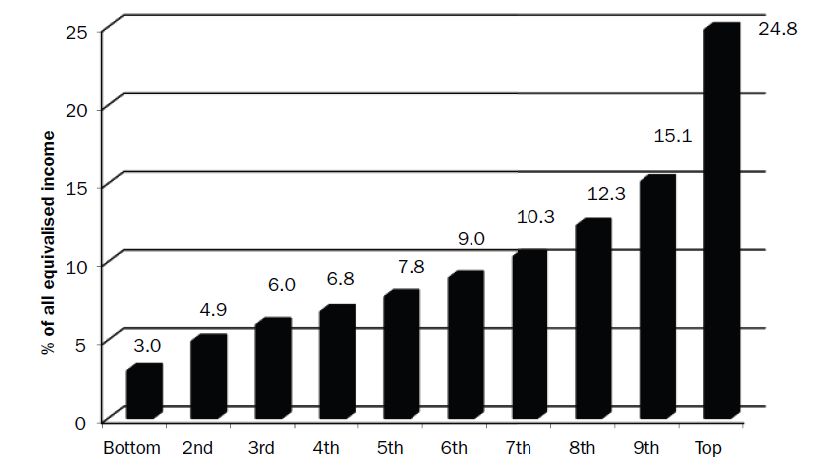
Social Justice Ireland                                                                                                                    March 2017

Figure 8 Early School Leaving Rate Amongst 18-24 Year Olds ...................................................... 32

Figure 9 Average Literacy Scores OECD and Ireland, 2012 ........................................................... 37

Figure 10 Lifelong Learning EU28: 2013-2015............................................................................... 40

Figure 11 Participation Rates (ages 16-64) in Lifelong Learning; EU-28 and Ireland, 2003-2015 . 40

Figure 12 Diagram: Europe 2020 Strategy: At Risk of Poverty or Social Exclusion Indicator ........ 45

Figure 13 Europe: People At risk of poverty or Social Exclusion EU-28, 2014 (%) ........................ 49

Figure 14 EU 27: Change in Risk of Poverty or Social Exclusion Rate, 2007-2014......................... 50

Figure 15 Ireland and Europe: People at risk of poverty or social exclusion, 2005-2014 (%) ....... 51

Figure 16: Three EU Poverty Indicators in Ireland, 2005-2014 (%) ............................................... 51

Figure 17: EU 28 People at Risk of Poverty, 2011-2014 ................................................................ 53

Figure 18 Deprivation Rate, 2006-2014 ........................................................................................ 56

Figure 19 Diagram: Consistent Poverty ......................................................................................... 57

Figure 20 Consistent Poverty and Government Targets, 2010-2020 ............................................ 58

Figure 21 Combined Poverty and Government Targets ................................................................ 59

Figure 22 Childhood Consistent Poverty and Government Targets .............................................. 61

Figure 23 Ireland's Income Distribution by 10% 9decile) group, 2014 ......................................... 63

Figure 24 Change in Decile Shares of Equivalised Disposable Income, 2008-2014 ...................... 64

Figure 25 Cumulative Impact on Welfare Dependent Households, 2011-2016 ........................... 65

Figure 26 Cumulative Impact on Households with Jobs 2011-2016 ............................................. 66

Table 1 Integrated Guidelines: Employment (including Social Inclusion and combating Poverty). 8

Table 2 Ireland Labour Force Data, 2007-2015 ............................................................................. 18

Table 3 Labour Force Data: Unemployment - Headline Statistics 2007, 2011, 2015 .................... 19

Table 4 Summary, Educational Attainment and Labour Force Participation, Ages 25-64, April-
June 2011 ...................................................................................................................................... 42

Table 5 Ireland: Population at Risk of Poverty or Social Exclusion, 2005-2013 ............................ 48

4|Page
Social Justice Ireland                                                                                                             March 2017

Table 6: Ireland and EU (28) average - People at Risk of Poverty, 2004-2013 .............................. 52

Table 7 Ireland: Population Below the 60% poverty Line, 1994-2014 .......................................... 54

Table 8 Ireland: Rates of Consistent poverty, 2006-2014 ............................................................. 58

Table 9 Children - Rates for Childhood Risk of Poverty, Consistent Poverty and Deprivation
(2006-2014) (age 0-17) .................................................................................................................. 60

Table 10 Social Justice Ireland Recommended Poverty Targets ................................................... 69

5|Page
Social Justice Ireland                                                                             March 2017

    1. Introduction and Context
The Europe 2020 Strategy was designed to develop a more balanced and sustainable approach
for the future. It was adopted in 2010. While not without its critics, the Strategy is seen as a
significant development in social policy within the EU. In particular, its inclusion of targets aimed
at increasing employment, improving education and reducing poverty and social exclusion are
considered potentially significant because they highlight the importance of social policy goals to
a vision for Europe’s future well-being. In this report we look at key aspects of Ireland’s
performance in response to the Europe 2020 Strategy in the areas of employment, education
and poverty.

The Europe 2020 Strategy
The Europe 2020 strategy aims to turn the EU into a ‘smart, sustainable and inclusive economy
delivering high levels of employment, productivity and social cohesion’ (European Commission,
2010, p. 5). It increased the potential visibility and importance of social issues and made the
possibility of ‘a much more integrated and coordinated approach to economic, social,
employment and also environmental governance’ a possibility (Frazer et al, 2010, p.3). As Frazer
and colleagues put it:
       ‘The Lisbon Treaty and the Europe 2020 Strategy provide a significant, if far from perfect,
       opportunity to move towards a better and more mutually reinforcing balance between
       economic, employment and social objectives – and thus towards a stronger Social EU’
       (Frazer et al, 2010, p 34).
While there has been criticism of aspects of the Europe 2020 strategy 1, the existence of targets
aimed at reducing poverty and social exclusion will, it has been argued, create a new dynamic
and impose pressure on politicians and policy-makers to deliver against those targets (Walker,
2011, p.1).
Following on from State of the Union address by President Juncker in September 2015, the
European Commission has launched a public consultation of a European Pillar of Social Rights
intended to identify a number of essential principles common to euro area Member States,
focusing on their needs and challenges in the field of employment and social policies. In March
2016 a first, preliminary outline was published by the Commission. Like the Europe 2020
strategy, this initiative is founded in a recognition that in advanced economies, which base
their prosperity on productivity growth and their capacity to innovate ‘social and economic
performances are two sides of the same coin (European Commission 2016a, p.4).

1
  There has, for example, been criticism of the way indicators were combined to determine the target for
‘poverty and social exclusion’ (see Nolan & Whelan, 2011). That has also been criticised by Social Justice
Ireland. Another area sometimes considered problematic is the fit between the governance architecture
of the Europe 2020 Strategy and EU social policy coordination as it had developed over a decade through
the Social Open Method of Coordination (OMC) (Zeitlin, 2010).

6|Page
Social Justice Ireland March 2017
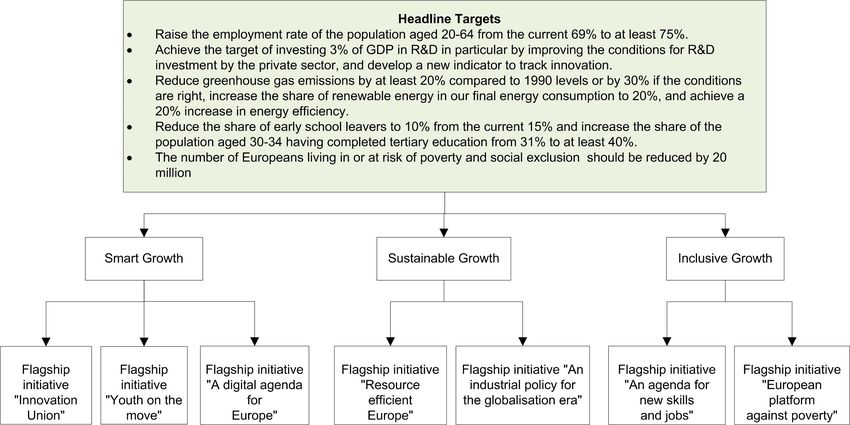
Priorities, Targets & ‘Flagship Initiatives’
The Strategy articulates three priorities, five headline targets for 2020 intended to be
representative of the three priorities, as well as a number of actions at national, EU and
international levels to underpin them (European Commission, 2010).
The three priorities are:
• Smart growth: developing an economy based on knowledge and innovation,
• Sustainable growth: promoting a more resource efficient, greener and more competitive
economy,
• Inclusive growth: fostering a high-employment economy delivering social and territorial
cohesion.
The headline targets for 2020 are intended to steer progress toward achieving the priorities.
They are:
• Employment – 75% of the 20-64 year-olds to be employed,
• R&D – 3% of the EU’s GDP to be invested in R&D (includes public and private
investment),
• Climate change/energy –
o greenhouse gas emissions 20% lower than 1990 (or 30% if the conditions are
right)
o 20% of energy from renewables
o 20% increase in energy efficiency
• Education –
o Reducing school drop-out rates below 10%
o at least 40% of 30-34 year-olds completing third level education
• Poverty /social exclusion –
o The number of Europeans living in or at risk of poverty and social exclusion
should be reduced by 20 million (this target is based on a combination of three
indicators2 - people are counted if they come under any of the three)
2
This indicator corresponds to the sum of persons who are: at risk of poverty or severely materially
deprived or living in households with very low work intensity. Persons are only counted once even if they
are present in several sub-indicators. At risk-of-poverty are persons with an equivalised disposable
income below the risk-of-poverty threshold, which is set at 60 % of the national median equivalised
disposable income (after social transfers). Material deprivation covers indicators relating to economic
strain and durables. Severely materially deprived persons have living conditions severely constrained by a
lack of resources, they experience at least 4 out of 9 following deprivations items: cannot afford i) to pay
rent or utility bills, ii) keep home adequately warm, iii) face unexpected expenses, iv) eat meat, fish or a
protein equivalent every second day, v) a week holiday away from home, vi) a car, vii) a washing machine,
viii) a colour TV, or ix) a telephone. People living in households with very low work intensity are those
7|PageSocial Justice Ireland March 2017
It is recognised that the targets are interrelated – for example, that better educational levels
help employability, which in turn will help to reduce poverty. Targets were to be translated into
national targets to reflect the current situation of each Member State (European Commission,
2010).
Seven flagship initiatives were proposed to underpin the priorities with actions at European and
national levels. These are ‘Innovation Union’, ‘Youth on the Move,’ ‘A Digital Agenda for
Europe’, ‘Resource Efficient Europe,’ ‘An Industrial Policy for the Globalisation era,’ ‘An Agenda
for New Skills and Jobs,’ and ‘European Platform against Poverty’.
Amongst the flagship initiatives, the European Platform against Poverty (EPAP) is of particular
importance in the context of this report, with its recognition that the vulnerable in our societies
have borne much of the impact of the economic crisis, and
• that fighting poverty requires a response that cuts across all policy domains and that is
mainstreamed into all policy development
• of the need for greater and more effective use of the EU Funds to support social
inclusion (European Commission, 2010a, p. 5,6).
Integrated Guidelines
Ten integrated Guidelines for implementing the Europe 2020 Strategy were adopted by the
Council in October 2010. See Table 1. The Guidelines aim to provide guidance to Member States
in defining their National Reform Programmes (see below) and in implementing reforms.
Guideline 10 underlines the importance of labour market participation for those furthest away
from the labour market and of preventing in-work poverty, as well as the role of pensions,
healthcare, and public services in maintaining social cohesion.
T ABLE 1 I NTEGRATED GUIDELINES: EMPLOYMENT (INCLUDING SOCIAL I NCLUSION AND COMBATING
P OVERTY)
Extract from Integrated Guidelines for Europe 2020
Guideline 7 Increasing labour market participation of women and men, reducing
structural unemployment and promoting job quality
Guideline 8 Developing a skilled workforce responding to labour market needs and
promoting lifelong learning
Guideline 9 Improving the quality and performance of education and training systems
at all levels and increasing participation in tertiary or equivalent education
Guideline 10 Promoting social inclusion and combating poverty
SOURCE: EU COUNCIL OF MINISTERS, 2010
aged 0-59 living in households where the adults (aged 18-59) work less than 20% of their total work
potential during the past year. (Eurostat online database: t2020_50)
8|PageSocial Justice Ireland March 2017 FIGURE 1 EUROPE 2020 STRATEGY F RAMEWORK 9|Page
Social Justice Ireland                                                                            March 2017

Monitoring and the European Semester
In order to monitor progress towards the achievement of its targets, the Europe 2020 Strategy
envisaged country reporting in the form of National Reform Programmes. These are intended to
help Member States to develop strategies for sustainable growth and sustainable public
finances and to track progress toward targets. The Europe 2020 Strategy envisages a partnership
approach to the elaboration of National Reform Programmes and to the implementation of the
Strategy – one that includes EU Committees, national parliaments, regional and local authorities
as well as social partners and stakeholders in civil society (European Commission, 2010).
In light of the Europe 2020 Strategy, the Social Protection Committee examined the pre-existing
Social Open Method of Coordination (OMC) 3, concluding that OMC (across its three strands of
social inclusion, pensions, health care and long-term care) would be essential to assessing the
social dimension of the 2020 Strategy.
It was recommended that, at the same time as reporting under their National Reform
Programmes, Member States would annually be invited to report on progress in National Social
Reports from 2012.
A key feature of governance relative to the Europe 2020 strategy was the introduction of a new
annual reporting cycle, the ‘European semester,’ which commenced in January 2011. One of the
aims of the new framework is to align the way the EU’s Stability and Growth Pact is
implemented with coordination of the 2020 Strategy. Each year, the Commission undertakes a
detailed analysis of EU Member States' plans of budgetary, macroeconomic and structural
reforms and provides them with recommendations for the next 12-18 months. A
Communication from the Commission in October 2015 notes that implementation has so far
been uneven and often limited and that Member States need to make more progress on
implementing country-specific recommendations (European Commission 2015b).
During 2014, a consultation process took place on the Europe 2020 Strategy toward
development of the strategy for the 2015-2020 period. The results of the review are intended to
feed into discussions on the Strategy’s future direction by the new Commission appointed in the
wake of the June 2014 European Parliament elections (European Commission 2015). One of the
findings from the consultation that took place during 2014 is that there is a need to improve the
delivery of the strategy through enhanced ownership and involvement on the ground (European
Commission 2015c). As mentioned above, in 2016 the European Commission launched a public
consultation of a European Pillar of Social Rights

3
  The ‘OMC’ or Open Method of Coordination was initiated by the 2000 Lisbon Strategy, and was
succeeded by the development of social indicators agreed in Laeken in 2001 (and consequently often
called the Laeken process) and subsequently developed and refined on an ongoing basis. It involves a peer
review process developed to assist policy learning. The OMC process includes agreement on common
objectives, commonly defined social indicators, development and peer reviewing of national strategic
reports along with recommendations for policy change (Walker, 2011).
10 | P a g e
Social Justice Ireland                                                                   March 2017

The European Semester
The European Commission operates a yearly cycle of economic policy coordination called the
European Semester. Each year the European Commission recommendations for the next 12-18
months to member states. The European semester starts when the Commission adopts its
Annual Growth Survey, usually towards the end of the year, stating priorities for the coming
year
November: Annual Growth Survey and Alert Mechanism Report. Assessment also issued by the
Commission of draft budgetary plans (Euro area)
February: Commission issues a single analytical economic assessment per Member State
March: EU Heads of State and Government issue guidance for national policies on the basis of
the Annual Growth Survey.
April: Member States submit their plans for public finances (Stability or Convergence
Programmes) and their National Reform Programmes with reforms and measures to make
progress towards smart, sustainable and inclusive growth, in areas such as employment,
research, innovation, energy or social inclusion.
May/June: the Commission assesses these programmes and proposes country-specific
recommendations. The Council discusses and the European Council endorses the
recommendations. There are no separate country-specific recommendations for countries
implementing an Economic Adjustment Programme as Ireland was (until end 2013) beyond
implementation of the Programmes.
June/July: the Council formally adopts the country-specific recommendations.
October (Euro Area): Submission of Draft Annual Budgets to the Commission for its opinion.
Where recommendations are not acted on within the given time-frame, policy warnings can be
issued. There is also an option for enforcement through incentives and sanctions in the case of
excessive macroeconomic and budgetary imbalances.

Irish National Reform Programme - Targets

The Irish Government submitted a National Reform Programme in 2011 and shorter Up-dates in
2012 and 2013. Since exiting the financial assistance programme in 2013, National Reform
Programmes have been submitted again in 2014, 2015 and 2016. Below are the Europe 2020
Strategy targets for employment, education and poverty reduction as well as the Irish targets
set out in the 2014 Irish National Reform Programme and the following sections of this report
will consider each in more detail.

11 | P a g e
Social Justice Ireland                                                                            March 2017

Employment
EU Headline Target: To raise to 75% the employment rate for women and men aged 20-64,
including through the greater participation of young people, older workers and low-skilled
workers, and the better integration of legal migrants.
Irish Target: To raise to 69-71% the employment rate for women and men aged 20-64, including
through the greater participation of young people, older workers and low-skilled workers, and
the better integration of legal migrants, and to review the target level of ambition in 2014, in
the context of a proposed mid-term review of the Europe 2020 Strategy.

Education
EU Headline Target: Improving education levels, in particular by aiming to reduce school drop-
out rates to less than 10% and by increasing the share of 30-34 years old having completed
tertiary or equivalent education to at least 40%.
Irish Target: To reduce the percentage of 18-24 year olds with at most lower secondary
education and not in further education and training to 8%; to increase the share of 30-34 year
olds who have completed tertiary or equivalent education to at least 60%

Poverty
EU Headline Target: To promote social inclusion, in particular through the reduction of poverty,
by aiming to lift at least 20 million people out of the risk of poverty and exclusion
Irish Target: To reduce the number experiencing consistent poverty to 4% by 2016 (interim
target) and to 2% less by 2020, from the 2010 baseline rate of 6.3% 4. The Irish contribution to
the Europe 2010 poverty target is to reduce by a minimum of 200,000 the population in
combined poverty (either consistent poverty, at risk-of-poverty or basic deprivation) (Revised
target 5).
Sub-target, Children: A sub-target for child poverty has been set in the National Policy
Framework for Children and Young People (2014-2020):
     •    To lift over 70,000 children out of consistent poverty by 2020 (a reduction of at least
          two-thirds on the 2011 level)
     •    This target will include reducing the higher consistent poverty rate for households with
          children as compared to non-child households (8.8% compared with 4.2%) and for
          children as compared to adults (9.3% compared with 6%).

4
 This is based on a slightly revised figure released by the CSO in 2011
5
 In 2012, the target in respect of poverty contained in Ireland’s National Reform Programme Update was
revised. Previously it targeted a consistent poverty rate of between 2-4% by 2012, the elimination of
consistent poverty by 2016, and at least 186,000 people lifted out of the risk of poverty and exclusion.
12 | P a g e
Social Justice Ireland March 2017 While recognising the interdependence of economic, environmental and social sustainability, it is not within the intended scope of this report to address all components of the Europe 2020 Strategy targets or the Irish National Reform Programme. Each of the above targets will be considered in the next three Chapters of this Report, which will focus on employment, education and poverty, respectively. The issue of governance will be considered in the fifth Chapter. 13 | P a g e
Social Justice Ireland                                                                      March 2017

2. Employment
EU Headline Target: The employment rate of the population aged 20-64 should increase from
the current 69% to at least 75%, including through the greater involvement of women, older
workers and the better integration of migrants in the work force (European Commission,
2010).

Ireland Headline Target: To raise to 69-71% the employment rate for women and men aged 20-
64, including through the greater participation of young people, older workers and low-skilled
workers, and the better integration of legal migrants, and to review the target level of
ambition in 2014, in the context of a proposed mid-term review of the Europe 2020 Strategy
(Government of Ireland, 2015).

European Context

The Europe 2020 Strategy envisages a high-employment economy delivering economic, social
and territorial cohesion. Challenges identified in this context include high unemployment, low
skills, those working who do not earn enough to get out of poverty (that is, the ‘working poor’).
The Strategy referenced the following facts about Europe (based on the data available when the
Strategy was adopted in 2010):

     •    Only two-thirds of the working-age population was employed
     •    About 80 million people had low or basic skills
     •    8% of those at work did not earn enough to reach the poverty threshold
     •    At 21%, the unemployment rate for young people was particularly high
     •    There was a strong risk that those away from the labour market or those poorly
          connected with it would lose ground             (European Commission 2010, p.17-18)

The need to integrate social and employment policy solutions is recognised especially in light of
the fact that so many people with jobs are at risk of poverty. As well as including a major focus
on employment, the 2020 Strategy emphasises education, training and lifelong learning
(European Commission, 2010).

In its review of employment and the social situation in Europe for 2015, the European
Commission’s overview is that the employment and social situation is slowly improving but that
discrepancies between countries remain large (European Commission 2016). The Commission
points to the need to translate the more favourable macro-economic environment into more
opportunities for people, particularly for the 11 million long-term unemployed and the 4.6
million unemployed young people in the EU. They also point to the need to invest more in the
skills of people, facilitate mobility, modernise labour law and social protection systems, as well
as foster entrepreneurship and innovation. They describe this as a broad reform agenda, to
which a proposed new a pillar of social rights will contribute.

14 | P a g e
Social Justice Ireland March 2017 The economic crisis led to the EU unemployment rate increasing from under 7 per cent in spring 2008 to 10.8 per cent in spring 2013, representing an increase of 9 million in the number of people who were out of work (European Commission 2016). The economic recovery has led to a gradual reduction in unemployment rates since April 2013. In September 2015 it had reduced to 9.3 per cent (in the EU) representing 2 million fewer unemployed people. However, despite these decreases since 2013, unemployment levels remain well above the 2008 levels and in September 2015 some 6.5 million more people were unemployed than in March 2008 (European Commission 2016). About 11 million people had been unemployed for more than a year (2nd quarter of 2015), and two thirds of these (about 7 million) had been unemployed for more than 2 years (European Commission 2016). In total, the long-term unemployed accounted for 4.7 per cent of the EU’s total labour force in the second quarter of 2015 and nearly 50 per cent of total unemployment. The economic crisis has hit low-skilled workers hardest, with their long-term unemployment rate doubling between 2008 and 2013. In the view of the Commission, the high rates of very long-term unemployment pose significant challenges to both the EU’s labour markets and its economy (2016). Figure 2 below shows the position of EU States relative to the high-level employment target (75%) set out in the Europe 2020 Strategy for 2013 to 2015 for people aged 20-64 6. The European average rate of employment stood at 70.1 per cent in 2015, up from 69.2 per cent in 2014 but still slightly below than the rate in 2008 which was 70.3% (EU28) (Eurostat t2020_10). The rate in the Euro Area was 69 per cent in 2015. Across the EU, there is great variation in the rate – with the highest levels of employment in Sweden, Germany, the U.K, Estonia, Denmark and the Netherlands, and the lowest in Greece, Croatia, Italy, Spain, Italy and Romania in 2015. There is a gap of over 25 percentage points between Sweden (80.5 per cent) and Greece (54.9 per cent). Ireland’s employment rate for this age group rate dropped from 2007 (when it had been 73.8 per cent), stood at 63.7 per cent in 2012 and has increased since then to 68.8 per cent in 2015. It is still below the European average and is approximately 6 percentage points lower than the Europe 2020 Strategy target. It is also below the target that Ireland set for itself which, as indicated above, was 69-71 per cent. 6 The employment rate is calculated by dividing the number of persons aged 20 to 64 in employment by the total population of the same age group. The indicator is based on the EU Labour Force Survey. The survey covers the entire population living in private households and excludes those in collective households such as boarding houses, halls of residence and hospitals. Employed population consists of those persons who during the reference week did any work for pay or profit for at least one hour, or were not working but had jobs from which they were temporarily absent (Eurostat, t2020_10). 15 | P a g e
Social Justice Ireland                                                                          March 2017

Figure 2, 2013-2015 EU-28 Employment Rate, Age Group 20-64

 90
 80
 70
 60
 50
 40
 30
 20
 10
  0

       EU (28 countries)
            Luxembourg

               Lithuania
                  Greece

               Romania
                Bulgaria

                Hungary

                    Latvia

                Sweden
                     Italy

                Slovakia

                  Cyprus

                  Austria

        United Kingdom
                  Poland

                Portugal
                    Spain

                Belgium

                 Finland

         Czech Republic
            Netherlands
               Denmark
                  Croatia

                    Malta

                  Ireland

                Slovenia
                  France

                 Estonia

               Germany
                                2013        2014        2015         Target

Source: Eurostat, t2020_10. Shows EU 2020 Strategy target of 75%. Note: French rate not given
for 2013

Ireland: Employment and Unemployment
The scale and severity of the economic collapse from 2008 means that in Ireland there was a
return to widespread unemployment, something that has long-term implications for individuals,
families and social cohesion as well as for Government finances. Significant improvement has
been achieved over the past four years, but there is little doubt that this is still a challenging
period in which a high level of long-term unemployment has again become a characteristic of
Irish society.

Figure 3 below shows Ireland’s employment rate for those aged 20-64 from 1993 to 2015 as
well as the national and EU level targets. It illustrates that, after increasing for many years, there
was a steady drop in the employment rate from 2007 to 2012. Recent years have seen a
welcome improvement in the rate, which stood at 68.8 per cent in 2015.

16 | P a g e
Social Justice Ireland March 2017
F IGURE 3 IRELAND : EMPLOYMENT, 1993-2015, AGE 20-60 WITH T ARGETS
80
70
60
50
Ireland
40 IE Target
30 EU Target
20
10
1993
1994
1995
1996
1997
1998
1999
2000
2001
2002
2003
2004
2005
2006
2007
2008
2009
2010
2011
2012
2013
2014
2015
Targets
Source: Eurostat, t2020_10
A consequence of job losses in recent years has been a sharp increase in unemployment and
emigration. As regards unemployment, the monthly average figure for Ireland for April 2016 was
8.4 per cent as published by Eurostat. The rate is down from a rate of 9 per cent in December
2015 (Eurostat, une_rt_m) (based on the monthly average rate – seasonally adjusted rate).
Ireland’s rate was similar to the EU-20 average (8.8 in March 2016) (Eurostat, une_rt_m). This is
a major improvement on the situation at the height of the crisis when unemployment exceeded
14 per cent. However, it is a lot worse than the situation before the recession when it stood at
4.7 per cent in 2007 (Healy et al 2015).
In Table 2 we set out labour force data 2007, 2011 and 2015 to show the nature and scale of the
recent transformation in Ireland’s labour market. Over the nine years from 2007-2015 the
labour force decreased by just over 4 per cent, participation rates dropped, full-time
employment fell by 13 per cent, representing almost 234,000 jobs, while part-time employment
increased by 15.6 per cent. Over this period unemployment increased by almost 82,900 people,
bringing the unemployment rate up from 4.6 per cent to 8.7 per cent. However, the 2015 figure
represents a dramatic improvement on the levels experienced during the height of the
economic crisis in 2010/2011.
17 | P a g eSocial Justice Ireland March 2017
T ABLE 2 IRELAND L ABOUR FORCE D ATA, 2007-2015
2007 2011 2015 Change 07-15
(Q4) (Q4) (Q4)
Employment
Labour Force
2,260,600 2,161,500 2,170,500 -90,100
LFPR % 63.8 60.1 60 -3.80%
Employment % 68.8 59.0 6.9 -4.9%
Employment (people) 2,156,000 1,847,700 1,983,000 -173,000
Full-time 1,765,300 1,411,400 1,531,500 -233,800
Part-time 390,700 436,200 451,600 +55,700
Underemployed n/a 145,600 104,000 -
Unemployment
Unemployed % 4.6% 14.6% 8.7% +4.1%
Unemployed (people) 104,600 313,900 187,500 +82,900
LT Unemployed % 1.4% 9.1% 4.7% +3.3%
LT Unemployed (people) 31,700 196,100 102,100 +91,700
Source: Healy et al, 2016, using QNHS on-line database.
Notes:
Data 2007-2013 is for quarter 4 of the reference year.
LFPR = Labour force participation rate and measures the percentage of the adult population who
are in the labour market.
Underemployment measures part-time workers who indicate that they wish to work additional
hours but these are not currently available.
Comparable underemployment data is not available for 2007.
LT = Long Term (12 months or more).
The figures in Table 2 also point towards the growth of various forms of precarious employment
over recent years. Since 2007 employment has fallen by 7 per cent; but this figure masks a
bigger decline in full-time employment (13 per cent) and a growth in part-time employment
(+15.6 per cent). Within those part-time employed there has also been an increase in the
numbers of people who are underemployed, that is, working part-time but at fewer hours than
individuals are willing to work. By the end of 2015 the number of underemployed people,
defined as those employed part-time but wishing to work additional hours, stood at 104,000
people – almost 5 per cent of the labour force and almost one-quarter of all part-time
employees.
While an element of these figures can be explained by the recession, and the suppressed levels
of activity in some sectors, they also suggest the emergence of a greater number of workers in
precarious employment situations. The growth in the number of individuals with fewer work
18 | P a g eSocial Justice Ireland March 2017
hours than ideal, as well as those with persistent uncertainties concerning the number and
times of hours required for work, is a major labour market challenge. Aside from the impact this
has on the wellbeing of individuals and their families, it also impacts on their financial situation
and adds to the challenges for people who work and are still poor. There are also impacts on the
state given that Family Income Supplement (FIS) and the structure of jobseeker payments tend
to lead to Government subsidising these families’ incomes; and indirectly subsidising some
employers who create persistent precarious employment patterns for their workers.
The consequence of all these job losses has been the sharp increase in unemployment and
emigration. Dealing with unemployment, Table 3 shows how it has changed between 2007 and
2015, a period when the numbers unemployed increased by almost 80 per cent. Most of the
unemployed, who had been employed in 2007 and before it, are seeking to return to a full-time
job with just over 6 per cent of those unemployed in 2015 indicating that they were seeking
part-time employment. The impact of the unemployment crisis was felt right across the age
groups with younger age groups seeing their numbers unemployed consistently fall since 2011 –
a phenomenon not unrelated to the return of high emigration figures over recent years.
Between April 2009 and April 2015 the CSO estimates that there was net outward migration of
approximately 170,000 for the 15+ age group. Net outward migration for Irish nationals was
approximately 145,000 for this period (Government of Ireland 2016). Some 215,000 Irish people
have left the country since 2011, of whom 48 per cent were in employment and 30 per cent
were students; they were also a skilled cohort and this suggests that young Irish people are
dissatisfied with the quality of jobs available to them in Ireland (Healy et al 2016, using CSO
Population and Migration Estimates).
T ABLE 3 L ABOUR FORCE D ATA: UNEMPLOYMENT - H EADLINE STATISTICS 2007, 2011, 2015
2007 2011 2015 Change 2007-2015
Unemployment 4.6% 14.6% 8.7%
104,600 313,900 187,500
(people aged 15 or over) people people people +82,900 people
Long-term Unemployment 1.4% 9.1% 4.7%
rate 31,700 196,100 102,100
people people people +70,400 people
(persons unemployed for 1
year or more)
Source: Healy et al, 2016, using QNHS on-line database.
When we look at people with disabilities, data from Census 2011 revealed that there were
162,681 persons with a disability in the labour force representing a participation rate of 30 per
cent, less than half that for the population in general. These findings reflect earlier results from
19 | P a g eSocial Justice Ireland March 2017 the 2006 National Disability Survey (CSO, 2008 and 2010) and a 2004 QNHS special module on disability (CSO, 2004). This low rate of employment among people with a disability is of concern and in that regard the publication of the Comprehensive Employment Strategy for people with disabilities is welcome. Apart from restricting their participation in society, lack of employment opportunities ties disabled people into state dependent low-income situations. Therefore, it is not surprising that Ireland’s poverty figures reveal that people who are ill or have a disability are part of a group at high risk of poverty. Another issue that is relevant is the right to work of asylum seekers where the processing of their cases is delayed, something that would assist in alleviating poverty and social exclusion amongst a very vulnerable group. As the labour market improves, Social Justice Ireland believes that now is the time to adopt measures to address and eliminate these problems. Long-Term Unemployment The rapid growth in the number and rates of long-term unemployment are also highlighted in Table 2 and Table 3. The number of long-term unemployed was less than 32,000 in 2007 and has increased since, reaching 196,100 in 2011 before falling again to 102,100 at the end of 2015. For the first time on record, the QNHS data for late 2010 indicated that long-term unemployment accounted for more than 50 per cent of the unemployed and by the end of 2015 the long-term unemployed represented 54.5 per cent of the unemployed. The transition to these high levels since 2007 has been rapid. See Figure 4. The experience of the 1980s showed the dangers and long-lasting implications of an unemployment crisis characterised by high long-term unemployment rates. It remains a major policy failure that Ireland’s level of long-term unemployment has been allowed to increase so rapidly in recent years. Furthermore, it is of serious concern that to date Government policy has given limited attention to the issue. Addressing a crisis such as this is a major challenge. However, it is clear that reskilling many of the unemployed, in particular those with low education levels, needs to be a key component of the response. Using the latest data, for the final quarter of 2015, 56 per cent of the unemployed had no more than second level education with 26 per cent not having completed more than lower secondary (equivalent to the junior certificate). At the other extreme, the scale and severity of the recession has resulted in high levels of third-level graduates becoming unemployed. While Government should not ignore any group in its overdue attempts to address the unemployment crisis, major emphasis should be placed on those who are most likely to become trapped in long term unemployment – in particular those with the lowest education levels. 20 | P a g e
Social Justice Ireland                                                                        March 2017

F IGURE 4 U NEMPLOYMENT BY DURATION 2007-2015

Source: Healy et al 2016 based on CSO, QNHS on-line database. Note: Data is for Q4 of each
year.

Social Justice Ireland believes that this issue requires immediate and appropriate action. A
specific sub-target on reducing long-term unemployment should be included in the National
Reform Programme to ensure this issue receives the priority it demands.

The Working Poor

The Europe 2020 Strategy recognises that large numbers of people who work nonetheless do
not earn enough to get out of poverty. They represented 9.6 per cent of Europeans (EU28) (aged
18-64) who worked in 2014 (the latest year for which data are currently available, Eurostat
online database ilc_iw01). For the EU as a whole the increasing trend for people to be working
and still in poverty has recently been identified again by the Social Protection Committee (2016)
as amongst its “trends to watch” (that is, where around a third or more of all Member States
show a significant deterioration in the given indicator). Very recently, the European Commission
noted that only half of the poor who find a job actually escape poverty – the impact depends on
whether the new jobs offer a living wage and on whether they go to job-rich or job-poor
households (2016).

Eurostat data for 2014 relative to Ireland (the latest available) reports an in-work risk of poverty
of 5.5 per cent (Eurostat online database ilc_iw01 – and note this is a statistic generated by
Eurostat so as to be comparable across Europe) and this had increased by one percentage point
from 2013.

21 | P a g e
Social Justice Ireland                                                                            March 2017

In 2014, OECD published data suggesting that amongst the 34 countries that are members of the
OECD, Ireland has a very high incidence of low pay 7 (relating to 2012) (OECD 2014a). In fact,
Ireland had the highest incidence of low pay amongst those European countries that are
members of the OECD. Amongst the wider group of OECD member countries, Ireland’s rate was
exceeded only by the United States, Korea and Israel (OECD 2014a, Table N).

It is important that policy begin to address this problem, particularly given the large numbers of
people affected. The Government has set up a Low Pay Commission to look at the National
Minimum Wage and other issues relating to low pay and this has been welcomed by Social
Justice Ireland. Policies which protect the value of the minimum wage and attempt to keep
those on that wage out of the tax net are relevant policy initiatives in this area. Similarly, the
concept of a ‘living wage’ and attempts to increase awareness among low income working
families of their entitlement to the Family Income Supplement (FIS) are also welcome. One of
the most effective mechanisms available within the present system to address the problem of
the working poor would be to make tax credits refundable, something on which Social Justice
Ireland has published research. Its 2010 study, entitled Building a Fairer Taxation System: the
Working Poor and the Cost of Refundable Tax Credits, showed that making tax credits
refundable is feasible at relatively small cost. Such a move would have a very positive impact on
those who are the working poor. We include a brief outline of the proposal in Chapter 4.

We strongly urge that a specific sub-target should be developed to address the issue of the
working poor and incorporated in Ireland’s National Reform Programme.

Youth Unemployment

While the increase in unemployment has been spread across all ages and sectors, Figure 5
highlights the very rapid increase in the numbers unemployed under 25 years-of-age. The
numbers in this group more than doubled between 2007 and 2009 peaking at 83,100 in quarter
2, 2009. Since then decreases have occurred, reaching 34,400 in late 2015. Although we have
limited empirical knowledge of the reasons for these decreases, a large part of the decrease is
probably due to emigration. For example, the European Commission’s 2015 EU Youth Report
found that Ireland recorded the highest fall in percentage points in its youth population since
2010 (-4 pp.) (European Commission 2015a).

Although youth unemployment represents about 18 per cent of the total population that are
unemployed, there is merit in giving it particular attention. Experiences of unemployment, and
in particular long-term unemployment, alongside an inability to access any work, training or
education, tend to leave a ‘scaring effect’ on young people. It increases the challenges
associated with getting them active in the labour market at any stage in the future. The latest
rate for the number of young people aged 18-24 years in Ireland who are not in education,
employment or training (NEETs) is 18.5 per cent in 2015, while the EU-28 average was
considerably lower at 15.8 per cent (Eurostat online database edat_lfse-20). Both the Irish rate

7
 The incidence of low pay refers to the share of workers earning less than two-thirds of median earnings
(OECD 2014a)
22 | P a g e
Social Justice Ireland                                                                     March 2017

and the EU average rates had declined between 2014 and 2015. Thus Ireland’s rate is relatively
high notwithstanding decreases in recent years and the extent of outward migration that has
particularly affected this age group.

F IGURE 5 YOUTH U NEMPLOYMENT IN I RELAND BY GENDER, 2007-2014

Source:       Healy et al, 2016. CSO QNHS on-line database.

At a European level, this issue has been receiving welcome attention over the past two years;
driven by high levels of youth unemployment in other crisis countries. As seen above, the Irish
Government’s National Reform Programme 2020 target for employment is projected to be
achieved through the greater participation in the labour market of young people (and some
other groups). The large numbers affected by youth unemployment deserves specific action. In
the short-term it makes sense for Government to invest in the ‘youth unemployed’ and Social
Justice Ireland considers this to be a central priority of any programme to seriously address the
unemployment crisis.

Irish Government Initiatives

Government action to address this issue focused on two main strategies – Action Plan for Jobs
designed to increase the number of jobs available (with annual iterations) and Pathways to
Work focusing on activation strategies intended to ensure that jobs are available to the
unemployed. The latest iteration of the Action Plan for Jobs (2016) aims to create 50,000 extra
jobs in 2016. New regional actions plans have also been developed.

Launched in 2012, Pathways to Work introduced new integrated employment and support
services involving new ‘one-stop-shops’ (Intreo) intended to deal both with accessing benefits
and obtaining support to return to work. The JobPath initiative is an activation service aimed
specifically at the long-term unemployed and those most at risk of becoming long-term
unemployed. Commenced in late 2015, JobPath is delivered by private/third party providers of

23 | P a g e
Social Justice Ireland                                                                       March 2017

employment services under contract to the Department of Social Protection. Budget 2015
provided for 6,000 places on this scheme and that is still the target referenced in the 2016
National Reform Programme (Government of Ireland 2016). But the introduction of this scheme
is a complex process and its introduction involves risks, including of service fragmentation and
that activity will focus on those easiest to place (‘creaming’) (Department of Education and Skills
2014).

In 2014 the Labour Market Council called for the same priority to be given to the exceptionally
high scale of unemployment as was given to the adjustment in the public finances (Department
of Education and Skills 2014). The 2016 target in relation to long-term unemployed people
moving into employment is 20,000 and the target for the end of 2020 is 50,000 (Government of
Ireland 2016a).

There were 67,422 people availing of activation programmes in Feb 2016 and this was down by
almost 7,500 since the previous year (Minister for Social Protection, 2016). ‘Penalty’ rates of
payment are applied when someone in receipt of a welfare payment does not cooperate with
employment services (Pathways to Work 2015 and 2016). The Labour Market Council has noted
that Pathways to Work has resulted in improvements in services to jobseekers in a relatively
short period of time, but also noted shortcomings (such as the high caseworker/client ratio,
fragmented support/training services, and a lack of robust evaluation of the effectiveness of
initiatives and programmes (Department of Education and Skills, 2014).

While a range of activation measures were introduced under Pathways to Work, it is not easy to
assess their effectiveness. The need for greater evaluation of activation measure was
highlighted by the results published by the ESRI of an evaluation of the Back to Education
scheme (which, after the Community Employment scheme represents the second largest
activation measure in Ireland in terms of both expenditure and scheme participants) (Kelly,
McGuinness and Walsh 2015). That evaluation found no evidence that people who commenced
an education programme in 2008 under the BTEA scheme benefitted from improved
employment outcomes in the period up to 2014. The report does not deal with why this is the
case nor with any other outcomes of participation.

The European Commission, in its post-surveillance report on Ireland for 2015, underlines the
need for a review of the Intreo system (2015d). This is awaited. Comprehensive and
contextualised evaluation of the effectiveness of the activation measures that are in place is
essential.

In its economic review of Ireland in Spring 2014, the European Commission noted how critical
Ireland’s reform of its further education and training programmes are for a sustained reduction
in unemployment, especially long-term unemployment and yet that the changes in this sector
are lagging behind those in the area of labour market policies (European Commission 2014a).

The EU-wide ‘Youth Guarantee’ scheme aims to address the issue of youth unemployment by
aiming to provide young people (under 25) with a good quality offer of employment, continued
education, an apprenticeship /traineeship within a short time of becoming unemployed. The
Youth Guarantee scheme was launched in Ireland in January 2014. In April 2014, the Labour
24 | P a g e
You can also read