Zero 2018 Getting to Zero Status - Update and List of Zero Energy Projects
←
→
Page content transcription
If your browser does not render page correctly, please read the page content below
zero
                                            GETTING TO

                                            WEBINARS

2018
       Getting to Zero Status
       Update and List of
       Zero Energy Projects
                                new buildings institute   1
TABLE OF
CONTENTS                                             1     Our Path to Zero Energy Buildings

                                                     3     Case Study: Santiago High School Science Classroom

                                                     4     Trends from NBI’s Getting to Zero Database

                                                  10		     Residential Zero Energy Buildings

                                                  11
                                                     Policy Directives and Program Support:
                                                  		 Taking Zero Energy to Scale

                                                  13		     Zero Energy Certification: Collaboration and Expansion

                                                  14
                                                     Technology Spotlight: Radiant Cooling and
                                                  		 Heating Systems

                                                  15
                                                     Case Study: Radiant System at the Oregon
                                                  		 Department of Transportation Building

                                                  16		     A New Hope: Zero Energy Today and for the Future

                                                  18
                                                     zEPI: A Simple, Versatile Scale for Measuring
                                                  		 Commercial Building Energy Performance
                                                  19
                                                     2018 Getting to Zero Buildings List of Certified, Verified
                                                  		 and Emerging Projects

                                                  ©New Buildings Institute, All Rights Reserved. Published January 2018.
                                                  Digital copies and report graphics are availabe at newbuildings.org
The Entrance Hall features a solar chimney
which helps regulate the temperature and
distributes natural light throughout the space.
Kohler Environmental Center, Choate Rosemary
Hall | Wallingford, CT                            Cover: North entrance of the Kohler Environmental Center, Choate Rosemary Hall | Wallingford, CT
Photo Credit: Peter Aaron / OTTO                  Photo Credit: Peter Aaron / OTTO
THE PATH TO                                          Since 2010, New Buildings Institute has tracked the developing
                                                     market for zero energy buildings. We are pleased to share this latest
ZERO ENERGY                                          2018 Getting to Zero Status Update and Zero Energy Buildings List,
BUILDINGS                                            which summarizes the growth and trends from nearly 500 certified,
                                                     verified and emerging zero energy projects across the United States
                                                     and Canada.
                                                     As NBI celebrates its 20th anniversary, we reflect on the past to help put the present
                                                     and the future in context. In our early years there were only a handful of government
                                                     or academic buildings to reference as low-energy, sustainable or green. Design and
                                                     technologies for indoor comfort were predominantly the same as the preceding
                                                     decades—buildings were sealed boxes filled with mechanical methods to deliver
                                                     light, heating, cooling and ventilation. Energy policies were cautiously making small
                                                     incremental changes: the leading national energy code (ASHRAE Standard 90.1)
                                                     moved the bar by only 4% between the 1989 and 1999 versions. The building
                                                     sector surpassed industrial as the number one energy-consuming sector. Real
                                                     estate value and tenant attention rarely considered energy or green factors. There
                                                     were no LEED buildings, no ENERGY STAR® buildings, no Living Buildings, and
                                                     renewable energy had no measureable market adoption. Reducing energy use was
                                                     almost exclusively driven by utility efficiency programs focusing largely on fluorescent
                                                     lighting upgrades.
                                                     So in 1997, NBI and others began working to create a low-energy future for
                                                     buildings for the benefit of people and the planet. Rocky Mountain Institute was
                                                     15 years old and shaking things up with the “Soft Energy Path” and Amory Lovins’
                                                     extensive intellect and economic arguments. The U.S. Green Building Council
                                                     was working on the 2000 release of the first edition of LEED and GreenBuild was
                                                     founded two years later. In 1999, ENERGY STAR moved from appliance standards
                                                                      into buildings with the first ENERGY STAR office. The 2001 ‘Packard
                                                                      Matrix’ showed the long-term economic viability of a “Living Building”
                                                                      leading to the formation of the International Living Future Institute
                                                                      in 2009. Ed Mazria turned up the heat on carbon and buildings in
                                                                      2002 with the formation of Architecture 2030 turned up the heat with
                                                                      the article “Architects Pollute” in 2003. The first utility public benefits
                                                                      charges were collected and with them an infusion of funds for
                                                                      efficiency programs, regional groups, and longer-term research on
                                                                      energy technologies and renewables. The foundation for zero energy
                                                                      (ZE) buildings was underway.
                                                                    Two decades later, these efforts are reflected in NBI’s 2018 Getting
                                                                    to Zero Status Update and Zero Energy Project List. Like many
                                                                    new efforts, ZE buildings counts are still small in relation to the total
                                                                    market—in the single-digit percentage of total buildings and floor
The Gallery of the Kohler Environmental Center
                                                     space. But a multitude of factors are accelerating ZE buildings and communities
wraps around the courtyard that insulates the
program areas from temperature variations            such as emerging technologies, sensors and LEDs, dramatic price drops of solar
                                                     generation, energy storage, energy tracking and transparency, integrated and
Kohler Environmental Center, Choate Rosemary Hall
                                                     passive design, climate concerns, and interest in ZE codes and resilient buildings.
| Wallingford, CT Photo Credit: Peter Aaron / OTTO

                                                                                                            new buildings institute       1
Buildings and Projects are                      This convergence, combined with other rapid advancements, foretells of a built
                                                environment that will look very different when we share our story 20 years from now.
used interchangeably in
                                                A generation ahead, we believe the majority of workers, students, and families will
this report. The Getting
                                                spend their indoor hours in buildings that provide natural light and ventilation; have
to Zero Buildings List                          superior thermal comfort through mixed-modes with occupant-level control; vary
consists of both individual                     design and windows by orientation; utilize shading and optimize views; have DC
buildings and some                              power; dynamically respond to occupancy, weather, and workhours; automate
                                                plug load management; produce renewable energy onsite; and use energy storage
aggregated projects                             and electric vehicles interactively with the electricity grid. They will do all this with
such as a campus ZE                             fewer materials and toxins, at a quarter or less of today’s energy and water, and
project, neighborhood                           with little to no carbon emissions. We believe this because this report indicates it is
                                                all possible today—and shows an encouragingly steep growth curve. From policies
development, or
                                                to practitioners to specific-projects, the proof is in this report. The future of the built
corporate portfolio. Each                       environment is ZE buildings.
is counted as a single                          In the Buildings List, nearly 500 ZE commercial building projects1 of all sizes, types
‘project’ in the List.                          and in all climates are presented. Projects owned by for-profit companies now
                                                make up 26% of the List—greater than K-12 schools (18%) which are leaders in ZE
                                                building adoption. Privately-held buildings2 overall account for 46% of ZE buildings
                                                approaching that of public buildings which were early adopters (see Fig 8).
                                                The highest growth in new projects is in multifamily, with an increase of 40 buildings:
                                                effectively doubling the count since 2016. Public assembly, schools, and offices are
                                                next with strong increases in their number of projects. Education facilities continue
                                                to be in the ZE spotlight, leading the List with 37% (178) of all projects. California is
                                                paving the way for all schools to get to zero through its zero energy school retrofit
                                                demonstrations. Community approaches are critical to scale ZE buildings and this
                                                List includes community, district, and/or campus examples that are bringing groups
                                                of buildings together on the path to zero.
                                                We also have some newcomers in the ‘other’ building type category with four
                                                new light manufacturing projects, a car dealership, and a ski area joining the
                                                Getting to Zero early adopter corps. Healthcare, lodging, and retail are yet to
                                                have much representation, likely due to their higher energy intensity and more
                                                complex occupancy conditions, making the few we know of even more valuable
                                                as exemplars. Warehouse/storage shares the low-end of adoption yet are in the
                                                opposite position regarding ease to get to zero energy and should therefore be a
                                                priority for accelerating adoption3.
                                                We also share policy rankings for states working to realize energy and climate action
                                                goals through stringency in energy codes, updates on residential ZE buildings
                                                from the Net Zero Energy Coalition, tell about our two exciting new alliances on
                                                ZE certification, discuss our efforts to provide extensive resource references that
                                                support the collective good work to make progress in Getting to Zero.
                                                1 Buildings and Projects are used interchangeably in this report. The Getting to Zero List consists of both individual
Suncoast Credit Union-Bushnell Service Center   buildings and some aggregated projects such as a campus ZE project, neighborhood development, or corporate portfolio.
Bushnell, FL                                    Each is counted as a single ‘project’ in the List.
Cedit: Peter Aaron / OTTO                       2 Privately owned includes corporations, small companies, individuals and non-profits.
                                                3 Warehouse and storage make up 14% of floorspace and 6% of total energy use of US non-mall commercial buildings.
                                                US Energy Information Administration, Commercial Buildings Energy Consumption Survey, 2012

    2     2018 Getting to Zero Status Update and List of Zero Energy Projects
zero energy school
case study

                                Santiago High School Science Classroom | Garden Grove, CA

Project Size: 8,069 SF            Garden Grove Unified School District (GGUSD) is a large, low-income school
                                  district that has recently become a regional leader in zero energy. Historically the
Construction Type: Retrofit
                                  district has prioritized investment of scarce resources into its students, rather
Construction Year: 2017           than into its facilities. While the district is ranked in the lowest 20% for household
Building Type: K-12 Education     income in California, its students’ test scores are in the top 20% in the state.
ASHRAE Climate Zone: 3B           The school district is bringing facilities and student needs together with its new
                                  science building at Santiago High School. When the deep energy retrofit is
                                  complete in fall 2018, it will be a living laboratory for students and will serve as a
                                  hub for the school’s environmental student groups. Students, teachers and staff
                                  will be provided with all the energy use and system data for hands-on learning
                                  opportunities and STEM educational practices. The project is aiming for an energy
                                  use intensity (EUI) of 24.7 kBtu/sf/year and onsite renewable generation of 24.9
                                  kBtu/sf/year, resulting in a projected net EUI of -0.2 kBtu/sf/year.
                                  The ZE project team meets weekly with key stakeholders to foster cultural change
                                  regarding energy efficiency. GGUSD believes that fostering this cultural shift
                                  among students, teachers and staff may turn out to be the most cost-effective
                                  investment of funds toward achieving ZE across the district in the long term. Many
                                  energy conservation measures including daylighting devices, lighting controls
                                  and automatic dimming will further reduce the lighting load to almost zero during
                                  daytime hours, which account for most operating hours annually. Additionally,
                                  natural ventilation and updates to the envelope, HVAC system, and controls are
                                  being implemented. A dashboard will track and display real-time energy data to
                                  educate students, teachers, and staff and encourage behavioral change.
                                  GGUSD is a low-income district with a culture of frugality. It did not change its
                                  values to invest in ZE retrofit projects. Instead, its emphasis on financial thrift led to
                                  this solution. GGUSD’s leadership shows that, under the right conditions, ZE can
                                  make financial sense for any school district.

                                                                                        new buildings institute      3
TRENDS FROM                                               Growth in Zero Energy Buildings
                                                          In the first Getting to Zero Status Update published by NBI in 2012, we proudly
NBI’S GETTING                                             reported 60 commercial and multifamily buildings or projects that were either Verified

TO ZERO                                                   as zero energy or were Emerging to that level. In 2018, the List includes nearly 500
                                                          projects and is on a steep curve upward, with our count (see Fig 2) increasing over
DATABASE                                                  700% in those six years4. We now have information on 67 ZE Verified and 415 ZE
                                                          Emerging projects: a total of 482 projects identified in this report. By sharing the
                                                          specific names, locations, energy outcomes, and targets of these projects, the
                                                          wide applicability and potential of these high-performance buildings can be used to
                                                          influence owners, designers and policy makers.
                     Zero Energy Building Growth                                  The largest growth is in the ZE Emerging category. The
                                                                                  influx of new projects setting these lofty objectives is a
                                                                                  reflection of both increased policy goals and market effects
                                                                                  of ZE buildings going more mainstream.
                                                                                  The Emerging ZE buildings are approximately evenly split
                                                                                  into two groups (see definitions on page 19 for details):
                                                                                  1. Not yet occupied or occupied less than one year
                                                                                  2. Occupied more than one year but not yet Verified as ZE
                                                                                  This second group underscores that achieving zero energy
                                                                                  is a process, not an end point and many projects need
                                                                                  further refinement after occupancy.
Fig 1. The Buildings List includes nearly 500 projects and is on a steep curve
upward, having increased over 700% since 2012.                                    Ultra-low Energy Buildings
                                                                                  The strong growth of ZE buildings is exciting for our
               Number of Zero
               Number of ZeroEnergy
                              EnergyBuildings
                                     Buildings                                    industry, but there are also many buildings reaching similar
                                                                                  levels of energy performance without the added step
                                                            2018                  of renewables or an official ZE goal. NBI has previously
                                                             67                   included these in our reports as ultra-low energy (ULE)
                                                                                  buildings. These buildings are also often referred to as
                                                                                  near net zero, zero energy capable, or zero energy ready.
                                             2016                                 These buildings have similar energy performance as ZE
                                             53                                   buildings and serve as additional examples of the building
       © New Buildings Institute                                                  design and operations to get to ZE energy performance
                                                                                  outcomes. The trailblazing project teams and owners
                                                             415
                                                                                  building ULE buildings have set the stage for today’s
                                   2014                                           growth in ZE buildings. But, this growth has introduced a
                                   33        279                                  challenge for our Getting to Zero Buildings List—there are
                                                                                  simply too many projects that are pushing the limits of low
          2012                     127                                            energy use to reasonably List. Therefore, this 2018 Getting
          21                                                                      to Zero List includes only projects with a publicly stated
          39                                                                      ZE goal. Although NBI is no longer listing ULE projects, we
                                                                                  are still gathering energy data from these projects to inform
                   ZNE Emerging                    ZNE Verified
                   Buildings and Districts         Buildings and Districts        research on design processes, HVAC system integration,
Fig 2. There are now 67 ZE Verified and 415 ZE Emerging projects documented       and other factors leading to low-energy outcomes.
by NBI.                                                                           4 This growth is based on the number of buildings on NBI’s List from 2012 – 2018.

     4      2018 Getting to Zero Status Update and List of Zero Energy Projects
ZE Buildings in the United States and Canada
                                                      Zero energy buildings transcend climates and borders between the United States
                                                      and Canada with projects occurring in 44 of the U.S. states and four of the 10
                                                      Canadian provinces. California is by far the front-runner in ZE building activity, with
                                                      the San Diego and Los Angeles areas being the densest clusters in the state. The
                                                      San Francisco Bay Area and Silicon Valley forms another large cluster, followed by
                                                      the Portland, Oregon, metro area, and the North Atlantic coast.
                                                      The top two states for ZE buildings (California and Oregon) account for half of all
                                                      the ZE buildings on the List. California’s leading energy policies, ambitious energy
                                                      reduction goals, and effective utility programs, as well as Oregon’s early ZE pilot
                                                      programs and incentives are clearly driving their rapid uptake in zero energy buildings.
                                                      The Northeast has six states ranked in the top 10 of the 2017 ACEEE State Energy
                                                      Efficiency Scorecard5 and the west coast occupies three of the remaining four top
                                                      10 slots. The effects of strong energy efficiency policies and programs is a clearly a
                                                      factor propelling the zero energy movement in these leading states.

                                                      Regions, States and Provinces
                                                      The 482 ZE projects are shown by state and region with a regional view and growth
                                                      rate in the legend added this year. The map is also clustered where the six Regional
                                                      Energy Efficiency Organizations (REEOs) work to advance policies and practices
                                                      in their geographical area. California continues to lead in both total ZE projects and
                                                      growth rate while the Northeast and Southwest have seen ZE project growth of over
                                                      90% since 2014.

                                                   2018 Buildings List Project Locations

Fig 3. ZE Projects by region and state/province.
The legend shows regional growth trends in            5 The 2017 ACEEE State Energy Efficiency Scorecard is the eleventh annual ranking of states on their efficiency policy
projects since our 2014 List.                         and program efforts, and can be found at: http://aceee.org/state-policy/scorecard

                                                                                                                              new buildings institute                 5
Zero energy buildings are in every climate zone across the continental United
                                                   States. Most buildings in climate zones 3B and 3C are in California. By focusing
                                                   on super-tight, well-insulated envelopes, passive systems, and careful operations,
                                                   a small but growing number of ZE buildings have achieved success in even the
                                                   coldest and most extreme climate zone, which is climate zone 7.

                                                              Climate Zone Distribution of Zero Energy Projects

                                                   Fig 4. Zero Energy buildings are in every climate zone across the U.S.

BUILDING RATING SYSTEMS
                                                   Green building labels like the U.S.                     Gold certified level, further connecting
                                                   Green Building Council’s Leadership                     the importance of LEED as an energy
                                                   in Energy and Environmental Design                      and green building platform that drives
                                                   (LEED), the BREEAM certification, and                   higher goals of zero energy.
                                                   the International Living Future Institute’s
                                                                                                           With its Living Building Challenge (LBC)
                                                   (ILFI) Living Building Challenge (LBC)
                                                                                                           certification, ILFI has set the highest
                                                   have been a foundation for many of
                                                                                                           bar for a green building label. In the
                                                   these early projects. The framework of
                                                                                                           List, there are eight projects that have
                                                   a third-party certification helps increase
                                                                                                           achieved LBC certification and 24 that
                                                   the number of projects, knowledge,
                                                                                                           have achieved either Zero Energy or
                                                   and market awareness of low-energy
                                                                                                           LBC Energy Petal certification. All in all,
                                                   objectives.
                                                                                                           a total of 32 projects in this List have
                                                   USGBC staff reviewed the List and                       achieved ILFI Certification at some level.
                                                   found that over one-third of the ZE                     In May 2017, ILFI and NBI announced
                                                   Emerging projects (36%, or 174                          a collaboration to connect ILFI’s
                                                   projects) and 70% of the ZE Verified                    Zero Energy certification and the NBI
                                                   projects are LEED registered or                         Getting to Zero Buildings List into one
The Rocky Mountain Institute Innovation Center
in Basalt, CO. is both a LEED Certified and Zero   certified. Fully three-quarters of these                integrated Zero Energy platform (see
Energy Certified Building.                         LEED projects are at the Platinum or                    page 13 for details).

     6    2018 Getting to Zero Status Update and List of Zero Energy Projects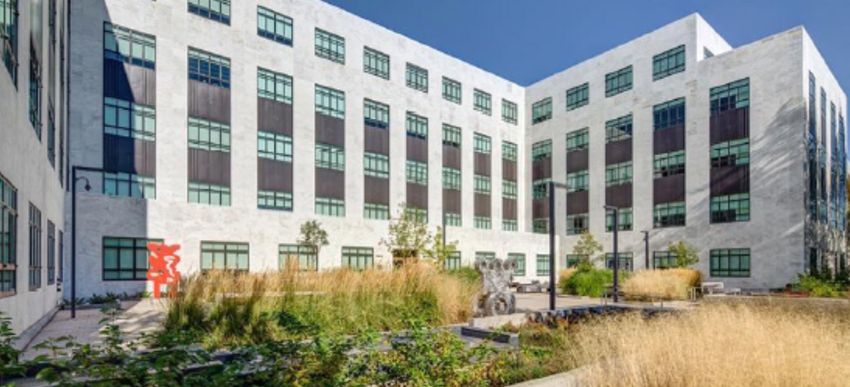
Energy Performance of ZE Buildings
                                                         The ZE Verified projects on the List on average use 60% less energy than comparable
                                                         existing U.S. commercial buildings and 46% less energy than new buildings under
                                                         one of the most stringent U.S. base code.6 The median gross site energy use intensity
                                                         (EUI) of ZE Verified projects is just 18 kBtu/sf/year (before renewables). The ZE
                                                         Emerging projects, which are a blend of measured and estimated energy use, have a
                                                         median gross site EUI of 24 kBtu/sf/year. These extremely low-energy outcomes are
                                                         the result of careful design, aggressive energy targets, and careful building operation
                                                         that typically includes operations and occupant education and engagement.

                                                    Gross EUI Distribuition of ZE Projects

Fig 5. This chart shows the range of energy usage (gross site EUI, not including renewables) for the zero energy projects in this List. The grey band covers the 20th to
the 80th percentile in each group.

                     Size Distribuition by ZE Category                                                        Building Size
                                                                                                              The majority of Verified ZE buildings (roughly
                                                                                                              80%) are smaller than 25,000 square
                                                                                                              feet, reflecting the early trend of small
                                                                                                              demonstration projects getting to zero, but
                                                                                                              the ZE Emerging List tells a very different
                                                                                                              story. The Emerging List building size is more
                                                                                                              evenly distributed suggesting that not only are
                                                                                                              more diverse size projects pursuing ZE, but
                                                                                                              also that large ZE buildings are entering the
                                                                                                              market. In the 2018 Emerging List more than
                                                                                                              40% of all buildings and 88% of the total floor
                                                                                                              space of ZE Emerging buildings are 50,000 sf
                                                                                                              or larger.
Fig 6. Nearly 30% of all buildings and 88% of the
total floor space of ZE Emerging buildings are
50,000 sf or larger.                                     6 For existing buildings, CBECS 2012 provides a useful baseline: the median U.S. office building EUI is 53 kBtu/sf/year.
                                                         For new buildings, California’s Title 24 2016 energy code provides a good comparison, with a baseline new office EUI of
                                                         37 kBtu/sf/year.

                                                                                                                                  new buildings institute                 7
Building Type
                                                 Zero energy buildings can be found across a growing number of building types.
                                                 Even high-energy intensity building types, such as hospitals and restaurants, are
                                                 finding innovative ways to pursue ZE. For example, the Gundersen Health System
                                                                                               in Wisconsin is targeting zero energy
                                   Building Type Breakdown                                     on a portfolio basis and has invested
                                                                                               in a wind farm and a biogas-fired
                                                                                               combined heat and power unit. As in
                                                                                               years past, the combined education
                                                                                               market, which includes K-12 schools,
                                                                                               higher education, and general
                                                                                               education, dominates the 2018
                                                                                               Getting to Zero List, making up 37%
                                                                                               of the projects. Breaking education
                                                                                               into its sub-categories brings offices to
                                                                                               the top: office buildings now account
                                                                                               for one in five ZE buildings, while
                                                                                               K-12 schools are a close second at
                                                                                               18%. The building type distribution
                                                                                               is reasonably consistent across ZE
                                                                                               Verified and ZE Emerging buildings,
Fig 7. Zero energy buildings can be found across
many different building types.                   though multifamily projects are fairly new to the List and few have achieved ZE
                                                 verification to date.
                                                     The ‘Other’ category includes building types ranging from airports to hospitals,
                                                     light industrial to retail, even a ski resort. As a growth trend, based both in terms
                                                     of rate of additions to the 2018 Getting to Zero List and market rate of growth, the
                                                     multifamily sector is poised for continued substantial additions.

                                                     Community, Districts, Portfolios, and Campuses
                                                    Pursuing ZE across sets of buildings is being done through districts, campuses,
                                                    in neighborhoods or city developments, and by portfolio owners such as the
                                                    military or corporations. These approaches to ZE within a physical area or portfolio
                                                    are critical paths to accelerate growth and scaling. Within our 2018 Getting to
                                                                              Zero List, these projects are each counted individually at
        Building Ownership Type                   Distribuition               the portfolio-level rather than at the building-level. While
                                                                              this is not always representative of the total number of
                                                                              ‘buildings,’ it shows each project as a single decision
                                                                              to get to zero as a portfolio. As this trend increases, the
                                                                              dataset will expand, and we hope to dive deeper into
                                                                              energy consumption and generation modes, portfolio
                                                                              scale, influences and decision process in these larger
                                                                              scale, multiple-building projects in the future.

                                                                                Building Ownership
                                                                                The picture is shifting when it comes to who owns ZE
Fig 8. Buildings owned by for-profit companies now making up 26% of the List.   buildings with those owned by for-profit companies now

    8     2018 Getting to Zero Status Update and List of Zero Energy Projects
ZE Growth by Building Sector making up 26% of the List. These companies can provide
valuable references on their business rationale for investing
in zero. The for-profit ZE buildings also now have a larger
market share than K-12 schools (18% of the List) which
are a clear market leader. These are part of the 46% of
the ZE List that are privately held buildings. We anticipate
that as the ZE market matures it will continue approaching
the national distribution where 78% of U.S. commercial
buildings are privately held7.
Most ZE buildings (approximately 65%) owned by private
for-profit organizations are offices and private schools. With
Fig 9. ZE Verified and ZE Emerging projects by ownership. Projects with offices representing half of all for-profit-owned projects while
missing ownership data are excluded private schools represent about another 15%. The remaining
35% varies significantly but is mostly comprised of retail and
public assembly facilities.
Growth by Building Ownership
The majority of publicly owned buildings on the List are
education facilities (60%)—similar to the market proportion of
education within public buildings. Nationally, higher education
accounts for about two-thirds of state-owned ZE facilities.
The remaining ZE projects at the state level are mostly
government offices and public assembly such as visitor
centers, museums and zoos.
As the Building List begins to more closely mirror the
market, the market can see that Getting to Zero is
achievable throughout our built environment.
Fig 10. ZE Verified and ZE Emerging projects by ownership. Projects with Designing the Future
missing ownership data are excluded. It takes a village to design, construct, and operate ZE
buildings, so we are very happy to see an increasing
diversity of firms reflected in the design-end of these leading
buildings. Although we are not always able to capture the
full teams involved in these projects, we recognize the
Top ZE MEP Companies Top ZE Architect Firms important role firms and individuals play in advocating for
advanced design and low-energy outcomes. The List this
Integral Group EHDD
year has approximately 70 unique mechanical-electrical-
CMTA Engineers Maclay Architects plumbing (MEP) firms and over twice that many architecture
PAE Engineering HGA Architects firms. Twenty-one percent (101) of the ZE projects are
Stantec HMC Architects designed by six leading firms. Seven leading architecture
KPFF Consulting Engineers ZGF Architects firms have multiple projects that together represent 7% of
the List. Design firms are at the interface with clients and
Interface Engineering BNIM
projects, and the growth of their skills, knowledge and
Opsis Architecture
confidence in getting to zero expands the opportunity to
mainstream ZE buildings.
7 U.S. Energy Information Administration, Commercial Buildings Energy Consumption
Survey, 2012
new buildings institute 9RESIDENTIAL ZERO ENERGY BUILDINGS
“Zero energy has done Zero energy buildings are appearing in every sector, led by residential. The Net-
Zero Energy Coalition (NZEC), which published its 2016 inventory of ZE housing
more to define our projects in June 20178, identified more than 8,000 housing units across the United
brand than any other States and Canada—33% more than the previous year. The number of projects
strategy we have used. increased even more, by 82%. Both numbers are clear market indicators that
momentum is steadily building in residential ZE. Given the increasing number and
Various programs that power of market and policy drivers pushing for more ZE homes, this growth will
incrementally reduce likely continue in the coming years.
energy consumption Multi-unit housing projects are responsible for 94% of all units identified by NZEC
lack the impact of zero in 2016. The majority (61%) of those are in multifamily buildings, and 39% are in
single-family developments. The average multi-unit single-family project has 33
energy. We call it the units; the average multifamily project has 46 units. The largest multi-unit project is
Power of Zero.” the University of California Davis’ West Village.
- Gene Myers, CEO of Thrive Home Builders A few market-leading builders are responsible for much of the growth in ZE
homes. The top 10 builders and developers identified in the 2016 NZEC Inventory
are collectively responsible for 3,731 units—45% of all housing units inventoried.
These builders report that zero energy is a powerful differentiator in a crowded
market. For these leading companies, making the shift to zero has been more
profitable, sustainable, and rewarding for their businesses and their customers.
Multi-unit projects
PROJECT TYPE BY UNITS8
2,960 4,727 741 4,077 8,203
single-family multi-family projects buildings units
units units
8 This information published with permission from NZEC based on their “To Zero and Beyond: 2016 Residential
Zero Energy Buildings Study.” http://netzeroenergycoalition.com/2016-zero-energy-inventory/
10 2018 Getting to Zero Status Update and List of Zero Energy ProjectsPOLICY California, Oregon, New York, Arizona, Massachusetts. These five states are leading
in the number of zero energy projects across the country with California inarguably
DIRECTIVES holding the highest penetration of ZE Verified and Emerging projects by nearly 10-
fold. So what do these top five states all have in common? Zero energy policies,
AND PROGRAM either statewide, by county, or by municipality, that are sending distinct market signals
SUPPORT: necessary to drive goal setting and investment around ZE projects. Many of them
also have strong energy efficiency programs supporting adoption of zero energy
TAKING ZERO goals with technical assistance and financial incentives.
ENERGY In Oregon, which takes second place on the List, the Energy Trust of Oregon has
TO SCALE been running its Path to Zero Program for several years, nurturing the market
for ZE buildings. That outcome is reflected in a growing number of Emerging
projects—up by 50% from the last Zero Energy Buildings List. A recent Executive
Order from Oregon’s Governor Kate Brown builds on this progress stating: It is
the policy of the State of Oregon to establish an aggressive timeline to achieve net
zero ready buildings as a standard practice.
State zEPI Jurisdictional ZE Emerging ZE Verified Beyond the states leading with ZE projects, NBI’s Library
Score of Advanced Codes and Policies catalogues over 135 local
governments across U.S. and Canada that have adopted
CA 51.7 192 22
a policy that puts them on the path to zero energy. That
OR 59.5 22 2 increase is more than double over the last 18 months,
NY 55.7 13 4 indicating that many cities and states are eager to implement
AZ 65.7 15 1 policies that support ultra-low and ZE performance,
MA 51.7 13 2 and many already have. Given the withdrawal of federal
leadership on climate action, local governments have
emerged as the standard bearers in the battle against climate change resulting in
new and aggressive carbon reduction goals with special emphasis on buildings.
Buildings are responsible for roughly 40% of CO2 emissions in the United States
and as much as 80% in cities.9 Local jurisdictions that are serious about cutting
carbon understand that the local building stock must be addressed, and zero energy
buildings have captured policymakers’ attention as a mechanism to get there.
While each locality is at a different
GETTING TO
zero
starting point with different resources
and stakeholder mix, they all are
positioned to take the first step for
getting to zero. In order to help other
interested jurisdictions learn from a
growing list of ZE policies, NBI created
a ZE Resource Hub to share the ZE RESOURCE HUB
most impactful policies and programs
from around the country. The Hub can
be found at: gettingtozeroforum.org/zero-energy-resources/
9 US Energy Information Administration, https://www.eia.gov/tools/faqs/faq.php?id=86&t=1
new buildings institute 11Setting a Vision for Energy Codes at Zero
Energy codes are a crucial policy lever driving high efficiencies in new construction
projects. Some jurisdictions are employing stretch codes as a means to set a
vision for zero energy codes by a date in the future and then plan incremental
efficiency increases for the intervening code cycles. Jurisdictions accelerating
energy code advancement for climate goals have met less resistance than
assumed. Building developers and product manufacturers understand that
policies need to change and stretch codes give them a clear view of energy
efficient building trends that will be used in future codes.
British Columbia (BC) is one such jurisdiction and has claimed that by 2032 the
province will work to achieve zero energy-ready status in all new construction.
By 2020, BC seeks to reduce the expected increase in electricity demand by
66% and reduce greenhouse gas emissions to 33% below 2007 levels (80% by
2050). To help realize these goals, BC in April 2017 published the BC Energy Step
Code, an incremental stretch code which will ultimately lead the province to zero
energy construction. Jurisdictions within British Columbia may elect to replace the
performance section of the Building Code with the Energy Step Code.
zEPI Jurisdictional Scores Act as a Sign Post
To help states that are utilizing energy codes to achieve energy and climate action
goals understand and track progress, NBI has developed zEPI Jurisdictional Scores,
which rank states based on their adopted energy policy. The scores take into
account statewide energy codes, local stretch codes, and other factors. Ranging
from zero to 100 where “0” is the goal, the scores are based on the Zero Energy
Performance Index (zEPI) scale, originally developed by NBI Fellow Charles Eley. The
zEPI Jurisdictional Scores
2017 zEPI Jurisdictional Scores allow states to see where
they currently stand on the
trajectory to zero and set
milestones for achieving
progress (see more on zEPI
on page 18). Beginning next
year, the American Council
for an Energy-Efficient
Economy (ACEEE) will
use the zEPI Jurisdictional
Score as the key criterion for
scoring state building codes
in their much anticipated
ACEEE State Energy
Efficiency Scorecard in an
effort to more accurately
assess the levels of savings
achieved by each state’s
adopted building energy
Fig 11. NBI has developed zEPI Jurisdictional Scores, which rank states based on their adopted energy policy.
codes.
12 2018 Getting to Zero Status Update and List of Zero Energy ProjectsZERO ENERGY CERTIFICATION:
COLLABORATION AND EXPANSION
Green building certification programs provide confidence that a building is
really walking the walk when it comes to environmentally conscious design and
operation. As zero energy buildings come into the mainstream, certification by a
trusted third-party organization is increasingly important to show that a building’s
zero energy design and performance are real. NBI has teamed up with the
International Living Future Institute (ILFI) to more directly connect the Getting to
Zero List and ILFI Zero Energy Certification through a unified zero energy platform.
In the residential sector, NBI has teamed up with the Residential Energy Services
Network (RESNET) to bring the benefits of ZE certification to homes around
the country.
NBI + ILFI:
In May of 2016, ILFI and NBI announced a collaborative partnership to simplify and
scale up the growth of certified ZE buildings based on actual measured energy
performance. This partnership builds on the strengths of each organization. The
new, streamlined process will provide the buildings industry—design teams, owners,
operators and others—with needed clarity on the standards for ZE performance
using data-driven outcomes for validation. Data requirements for this operational
rating have been substantially simplified and aligned with the Getting to Zero
Buildings Database. The end result will be one seamless system for tracking,
registering, certifying, and evaluating the ZE buildings of today and tomorrow. While
elements of the collaboration have been a work in progress, we expect to fully
launch this unified ZE platform in the first half of 2018.
NBI + RESNET:
The Home Energy Rating System (HERS) Index, administered by RESNET, is an
OPERATIONAL RATINGS asset rating that measures a home’s energy efficiency performance. The HERS
vs. Index is a nationally-recognized standard for inspecting, testing and rating of key
ASSET RATINGS aspects influencing energy use. There are more than 2 million HERS-rated homes
and over 2,000 certified HERS raters in the United States. NBI is teaming up with
Operational Ratings are based RESNET to use the HERS Index
on actual energy usage over as the basis for a zero energy
a period of time (12 months in certification for new single-family
homes at the point of sale10. This
most cases).
new certification will enable ZE
Asset Ratings are based on Homes to achieve mass-market
building characteristics like scale by leveraging RESNET’s
widely known and trusted HERS
insulation and HVAC systems,
Index. We expect to launch
as designed and constructed. this certification program in
mid-2018.
10 This certification is not related to the U.S. Department of Energy’s Zero Energy Ready Homes program.
new buildings institute 13technology spotlight
and case study
Radiant Cooling and Heating Systems
While forced-air distribution systems remain the predominant approach to
heating and cooling in U.S. commercial buildings, radiant systems can provide an
opportunity to contribute significant energy savings. This is due to relatively small
temperature differences between the room set-point and cooling/heating source,
and the efficiency of using water rather than air for thermal distribution. A common
strategy across ZE buildings, radiant systems typically utilize a Dedicated Outdoor
Air System (DOAS) to meet ventilation needs. Radiant heating systems are not
unusual in high performance buildings, but using radiant systems for both heating
and cooling is rarely done. A new study investigates this approach.
In 2016-17, NBI worked with the Center for the Built Environment at UC Berkeley
to study the Energy Performance of Commercial Buildings with Radiant Cooling
The Port of Portland building in Portland, OR and Heating9. This study focused on high thermal mass radiant systems—
was one of the buildings studied in NBI’s recent
radiant technology research project Thermally Activated Building Systems (TABS) with radiant tubing is embedded
in a structural slab. Also included were Embedded Surface
Energy Performance of Radiant-Conditioned Systems (ESS) with tubing embedded in topping slabs and
Buildings ceiling panel systems where the piping is located in metal
panels suspended from the ceiling.
Our research team obtained building design characteristics
and energy use from 23 commercial buildings across seven
climate zones using radiant as the predominant method to
cool and heat the occupied space. The research, which was
funded by a Californian Energy Commission EPIC grant, found
that the set of studied buildings significantly outperformed
peer buildings and national benchmarks.
Although a radiant system is not the sole driver of high-
performance, it is a valuable option for achieving low-energy
outcomes. Selecting a radiant system usually means limiting
the overall design cooling load because there are physical
limitations to how much cooling a radiant system can achieve.
This translates to a better envelope, lower lighting loads,
and efforts to reduce plug loads which in turn reduce overall
building energy consumption.
Alongside the report, nine individual building case studies1 were
published, which further detail the technologies used in the
Fig 12. This boxplot compares the interquartile buildings as well as the energy performance and occupant comfort results.
energy performance of the research set alongside
a comparable subset of buildings from CBECS,
the building performance database (BPD), and
NBI’s ZE Verified Buildings List. The radiant build-
ings included in the study used approximately 11 Full report: https://newbuildings.org/resource/energy-performance-of-commercial-buildings-with-radiant-heat-
30% less energy than national benchmark values. ing-and-cooling/
14 2018 Getting to Zero Status Update and List of Zero Energy ProjectsZE Case Study: Radiant System at the Oregon Department of Transportation Building
The Oregon Department of Transportation (ODOT) headquarters is a five-story,
147,000-square-foot (sf) office building housing 460 employees. The headquarters
is a retrofit of a 1950s-era building and features hydronic radiant systems,
photovoltaic panels, rainwater harvesting, waste water treatment, and ground-
source heat pumps. These technologies enabled the building to achieve LEED
Platinum certification in 2012.
Designed by SERA Architects and engineered by Stantec and PAE Engineers, the
Nine radiant systems case studies are
renovation project reorganized ODOT’s workspaces, providing the employees with available on the NBI website at:
improved daylight, indoor air quality, and collaboration spaces while optimizing the newbuildings.org/case-studies/
HVAC systems to ensure energy efficiency.
Building Energy Use
Energy Performance of ODOT Building vs. Benchmarks
The ODOT building has a whole-
building site EUI of just 36 kBtu/sf. This
is 44% to 56% less than the average
office EUI performance of national,
regional, and state peers. While those
datasets include a mix of construction
ages, ODOT’s building energy use is
also 10% lower than ASHRAE’s best-
practice energy efficiency Standard
100 targets.
Radiant cooling and heating systems
were a major piece of the design
strategy enabling this building to
achieve low-energy success.
Fig 13. The ODOT building outperforms various national and state-level benchmarks. The building uses
slightly more than half the energy of its code baseline.
new buildings institute 15A NEW HOPE: The 2018 Getting to Zero Status Update and List of Zero Energy Projects brings a
spotlight to an impressive and growing diversity of projects, practitioners and owners
ZERO ENERGY striving for the best in design, operations, and occupant benefits. Their low-energy
outcomes and targets reflect what can be done in today’s market and we expect
TODAY AND FOR more innovation ahead. The policy trends show a leap from regulatory methods
THE FUTURE pushing from the bottom of the pack to examples of leading codes and policies
requiring the top end of what’s possible. Here is a summary of noteworthy and
hopeful areas.
Growth in projects, size and type. Tracking of commercial buildings reflects a
"[ZNE] It's the next level of 700% increase in ZE buildings in six years with sizes more reflective of the general
marketplace. As designers become more capable of achieving ZE outcomes, building
ambition"12
sizes are getting larger with over 40% of the projects and 88% of the floor space in
-Clay Nesler, VP of global energy and ZE Emerging buildings over 50,000 sf. Nearly every use type including high energy
sustainability at Johnson Controls (JC) sectors like retail, hospitals, and light industrial are represented, but 72% of the
projects fall into three types: 1) education (36%); 2) offices (20%); and 3) multifamily
(16%).
In the residential sector, over 8,000 housing units in 4,077 buildings and 741 projects
are targeting zero energy. Of those, 61% of units are in multifamily projects and 39% in
single-family with production builders leading the growth with the top 10 builders in the
residential inventory responsible for 45% of the units.
Private sector invests, districts emerge. ZE is finding favor with the private
sector with nearly 26% of the full List representing for-profit private sector buildings
and overall private ownership now at 46%. Home production builders say ZE
residential projects have been “profitable, sustainable, and rewarding for their
businesses and their customers.” The communities and commercial districts are
increasing and carving a critical path to scale ZE developments.
Feasibility remains strong. As we achieve high numbers of projects to analyze we
are more able to set targets for energy performance of building types and in climate
zones. Current examples show an impressive proof of performance with Verified
energy use of just 18 kBtu/sf—46% less than the most stringent new construction
energy codes in the U.S. Location is not a barrier as there are ZE buildings in every
U.S. and Canadan climate zone and almost every U.S. state.
Experience and expertise grows. The ZE corps is expanding with over 70
distinct mechanical and engineering companies and 140 architectural companies
involved in these projects. As interest and awareness of ZE rises, the design
communities’ ability to deliver must keep pace with expanded options for continuing
education for architects, engineers and builders. Trainings and focus on ZE design,
construction and operations within industry conferences continues to grow and
spotlight ZE practices and projects—an encouraging sign.
Policies and programs are a proven driver. While ZE projects are now located
in nearly every state, larger numbers are certainly driven by local policies or programs.
12 In reference to 2016 Energy Efficiency Indicator ZE policies, either statewide, by county, or by municipality, are sending distinct market
survey with more than 1,200 facility and energy and public benefits signals necessary to drive goal setting and investment around ZE
management executives in the U.S., Brazil, China, projects. Efficiency programs are also a strong factor in supporting adoption of zero
Germany and India
energy goals with technical assistance and financial incentives.
16 2018 Getting to Zero Status Update and List of Zero Energy ProjectsContinued market development is crucial. This List is at the forefront of
three key factors intersecting to change the built environment as we know it:
1) optimized energy efficiency through design, technologies and operational strategies,
2) renewable energy integration at the site, community or portfolio level, and 3) grid
harmonization of the building, energy storage and electric vehicles. These factors are
informing our work to move buildings and policies to zero energy and lower carbon.
It’s a long road ahead and there is much work to be done to achieve our zero energy
future. We at NBI will continue to drive momentum for buildings that reflect energy,
environmental and economic goals. Our sights are set on the horizon:
• Carbon. Establish metrics that put the relationship between carbon
and energy use in the spotlight based on actual generation sources at a
building and community level. Connect zero energy buildings to carbon
goals and policies.
• Policies and Programs. Advancing codes, policies and programs that
form the steps to zero energy in the building sector.
• Practitioners. Support practitioners’ abilities and resources to advocate
and create ZE buildings with clients and deliver successful projects.
• Proof. Continue to expand the ‘proof of the possible’ through tracking
and disseminating a growing List of ever-wider types of ZE buildings,
community approaches and case studies.
• Markets. Work on target markets that help swing the majority such as
cities, schools, and multifamily.
BEYOND THE METER: BUILDING-GRID
INTERACTIONS IN THE AGE OF ZERO ENERGY Energy Efficiency
Optimization
For a century, electricity has flowed only one way: from the power plant to the building.
This long-established paradigm is changing fast as distributed renewables and ZE
buildings come online across U.S. and Canada. Already, some grid operators are
Zero
struggling to integrate renewable energy onto the grid. Energy
At the building level there is a lack of knowledge and incentive to encourage grid- Building
Renewable Storage
friendly design and operation. Across U.S. and Canada there are no metrics that
Energy and Grid
define building-level grid citizenship or rate building-grid interaction quality. Current
Generation Harmonization
thinking on the topic is fragmented and different players are using different language to
discuss the topic from a variety of perspectives.
NBI and USGBC are launching the GridOptimal Initiative to provide standards, © 2017 New Buildings Institute
tools, and guidance to improve building-grid interactions in the built environment Grid Harmonization: Buildings, Energy Storage,
and Electric Vehicles
by empowering owners, architects, and engineers with a dedicated building rating
system and certification protocol.
By creating a standardized metric that defines a building’s operational performance as a grid asset, many doors open. Utilities can
incentivize grid-sensitive design. Government agencies can include the metric in their procurement requirements or other policies.
Designers, owners, and operators can consider grid impacts with a sensible, straightforward approach. Future building codes can
begin to encourage the adoption of these solutions and help ensure that new buildings coming online will be good grid citizens.
The GridOptimal Initiative will play a major role in bridging the gap in knowledge, understanding, and priorities across the meter,
including both grid operators and electricity consumers. We welcome your insights and support. To find out more, please visit:
www.newbuildings.org/gridoptimal.
new buildings institute 17THE ZERO ENERGY PERFORMANCE INDEX
Since 2016, NBI has zEPI: A Simple, Versatile Scale for Measuring Commercial Building
Energy Performance
included building
The Zero Energy Performance Index (zEPI) scale represents a fundamental shift
zEPI Scores in the in measurement of building efficiency. zEPI sets energy targets for actual energy
Getting to Zero consumption rather than using a predictive energy model of building energy
performance to calculate a “percent better than code” metric.
Buildings List. The
zEPI score is a simple zEPI is calculated using a building’s EUI and is adjusted based on building type
and climate. zEPI is also the measure by which a building’s energy efficiency is
metric measuring a calculated once operational and occupied based on measured energy use data.
building’s progress zEPI was created to address confusion caused by comparing the energy efficiency
toward zero energy. of buildings by referencing their “percent savings beyond code.” Which code?
What year? Given there have been at least six major commercial energy codes on
the books at any given time in the United States since 2000, identifying the correct
baseline can take some time.
BASELINE
zEPI sets a constant goal of zero
70 FF-EUI
Zero Energy Performance Index (zEPI) scale energy and shifts the conversation
100 Score
from percent better than code to an
BASELINE
index leading to zero, which is the
70 FF-EUI
kind of market shift that is required
100 Score
for buildings to achieve wide-scale
100 80 60 40 20
0 -20
zero energy and exemplary energy
performance. One noteworthy function
of the zEPI scale is that it allows key
0 energy milestones including individual
100 80 60 40 20 -20 project consumption and energy
policies to all be represented on one scale. It permits direct comparisons in order
The ZE Certified Hood River Middle School to understand the relative performance of each of these elements in measurement
Music and Science Building in Hood River,
OR, has a zEPI Score of 0. of energy performance.
Photo Credit: Michael Mathers
18 2018 Getting to Zero Status Update and List of Zero Energy Projects2018
Getting to Zero
List of Zero Energy Projects
We know there are The 482 trailblazing projects listed here are proof positive that zero energy design
and operation is feasible in every climate, market sector, size, and building type
more projects than we across U.S. and Canada. In the six years since NBI produced the first Getting
have captured here. We to Zero List in 2012, the number of ZE projects has increased more than 700%.
encourage you to submit ZE More and more designers, owners, and occupants are gaining valuable ZE
experience and expertise, and new projects are appearing regularly. Projects are
and ULE projects through
listed alphabetically and grouped by year completed or projected for completion.
our registry so we can
New information is included in the 2018 Getting to Zero List about project
recognize these leaders in certification. Projects that have achieved Zero Energy Certification from ILFI are
the growing field of zero listed in the ZE Certified buildings category. For the first time, this List also shows
energy buildings. information about the LEED status of ZE projects.
Be Counted at
newbuildings.org/share.
Definitions
Zero Energy (ZE) projects are buildings, or groups of buildings, (M) after the project name indicates a project that has provided
with greatly reduced energy loads such that, totaled over a year, measured energy use data.
100% or more of the energy use can be met with renewable energy
Site EUI stands for the total gross site-level Energy Use Intensity, a
generation. In this List, projects are categorized as ZE Certified, ZE
metric used to measure annual energy use per square foot of building
Verified, or ZE Emerging.
space. Energy use includes consumption from all fuels (grid-delivered
Zero Energy Certified projects have been awarded Zero Energy, and onsite-generated electricity, natural gas, district energy, and
Net Zero Energy, Living Building, or Energy Petal certification delivered fuels) in thousands of British Thermal Units (kBtu) per year.
by ILFI. ILFI has thoroughly reviewed one continuous year of That sum is divided by the building size in gross square feet, thus the
energy consumption and generation data to certify zero energy units are kBtu/sf/year.
performance. NBI and ILFI are collaborating to launch a new ZE
Source EUI accounts for upstream generation, transmission, and
platform in 2018, including a combined data portal, certification
distribution losses associated with delivering usable energy to the site.
program, and interactive ZE project database.
RPI stands for Renewable Production Intensity, a metric used to
Zero Energy Verified projects have achieved ZE for at least one full
define annual renewable energy generation per square foot. This is
year and NBI has Verified the performance data.
the onsite renewable analogue to EUI. This is shown in both site and
Zero Energy Emerging buildings have publicly stated a goal of source, just like EUI.
reaching ZE but have not yet demonstrated achievement of that
Net EUI is simply EUI minus RPI. A building with a measured net EUI
goal. These buildings may be in the planning or design phase,
(site or source) less than zero has achieved ZE. Some buildings in the
under construction, or have been in operation for less than twelve
ZE Emerging category show a negative net EUI based on modeled or
months. Others may have been operating for at least a year, but their
estimated data.
measured energy use data either has yet to achieve ZE, or the data
to document ZE performance was not available. zEPI is metric on a 0-100 scale that sets a constant goal of ZE and is
normalized by climate and building type. For more information about
(L) after the project name indicates a project has achieved USGBC
zEPI, see page 18.
LEED certification (at any level).
new buildings institute 19zero energy certified
BUILDING SIZE TOTAL SOURCE SITE SOURCE NET NET ZEPI
YEAR PROJECT NAME CITY STATE SOURCE
TYPE (SF) EUI EUI RPI RPI EUI EUI SCORE
2007 IDeAs Z2 Design Facility (M) San Jose CA Office 6,557 22.6 71.2 23.2 73.0 -0.6 -1.8 -1
Chrisney Library (M) Chrisney IN Public Assembly 2,413 16.7 52.6 17.4 55.0 -0.8 -2.4 -1
Living Learning Center at Tyson Eureka MO Education 2,968 24.5 77.1 26.4 83.2 -1.9 -6.1 -2
Research Center (M)
2009
Omega Center for Sustainable Living L (M) Rhinebeck NY Other 6,200 13.2 41.6 21.5 67.6 -8.3 -26.0 -7
Pringle Creek Painter's Hall (M)L
Salem OR Public Assembly 3,595 11.1 35.0 15.4 48.4 -4.3 -13.4 -5
Putney Field House L (M) Putney VT Education 16,800 9.7 30.6 10.4 32.9 -0.7 -2.3 -1
Bertschi School Science Wing L (M) Seattle WA Education 1,425 48.0 151.2 48.4 152.5 -0.4 -1.3 0
DPR Construction San Diego Net Zero San Diego CA Office 24,000 14.8 46.1 17.1 53.9 -2.4 -7.8 -3
Office L (M)
Energy Lab at Hawaii Preparatory
2010 Academy L (M) Kamuela HI Education 5,902 11.0 34.8 28.0 88.2 -17.0 -53.4 -15
Hood River Middle School Net-Zero
Hood River OR Education 5,331 26.8 84.3 27.1 85.4 -0.4 -1.1 0
Addition L (M)
Richardsville Elementary School (M) L
Bowling Green KY Education 72,285 19.0 59.9 21.6 68.0 -2.6 -8.1 -3
Coastal Maine Botanical Gardens Boothbay ME Education 8,200 19.2 60.3 23.5 73.9 -4.3 -13.6 -4
Bosarge Family Education Center L (M)
2011 Locust Trace AgriScience Campus
(High School) (M) Lexington KY Education 70,000 9.9 31.0 10.6 33.3 -0.7 -2.3 -1
TD Bank Branch - Ft. Lauderdale (M) L
Fort Lauderdale FL Office 3,970 91.8 289.3 95.6 301.1 -3.8 -11.8 -4
zHome - Issaquah (M) Issaquah WA Multifamily 5,813 21.0 66.2 22.0 69.3 -1.0 -3.1 -2
Bullitt Foundation Cascadia Center for Seattle WA Office 51,800 9.7 30.6 16.6 52.4 -6.9 -21.8 -10
Sustainable Design and Construction (M)
David and Lucile Packard Foundation L (M) Los Altos CA Office 49,161 24.4 76.8 29.0 91.4 -4.6 -14.6 -7
DPR Construction Phoenix Net Zero Phoenix AZ Office 16,533 26.8 84.3 29.5 92.9 -2.7 -8.6 -3
Office L (M)
2012 Phipps Center for Sustainable Public
Pittsburgh PA 24,350 18.2 57.3 18.7 58.8 -0.5 -1.5 0
Landscapes L (M) Assembly
Sacred Heart Schools Stevens Family Atherton CA Education 6,800 13.2 41.6 30.8 97.0 -17.6 -55.4 -22
Library L (M)
Smith College Bechtel
Environmental Classroom (M) Northampton MA Education 2,500 11.5 36.1 17.6 55.6 -6.2 -19.5 -6
435 Indio Ave (M) Sunnyvale CA Office 31,800 13.5 42.5 28.7 90.2 -15.2 -47.7 -23
Mercantile
PNC Net-Zero Branch L (M) Ft Lauderdale FL (Enclosed and 4,766 59.1 186.0 64.4 203.0 -5.4 -17.0 -5
2013 Strip Malls)
Sandy Grove Middle School L (M) Lumber Bridge NC Education 74,000 20.6 64.9 35.7 112.6 -15.1 -47.7 -15
West Berkeley Public Library L (M) Berkeley CA Public Assembly 9,399 21.7 68.3 25.5 80.4 -3.8 -12.1 -5
Brock Environmental Center L (M) Virginia Beach VA Education 10,500 14.6 45.9 28.6 90.1 -14.0 -44.2 -14
2014 DPR San Francisco Office L (M) San Francisco CA Office 24,010 21.6 68.0 22.1 69.6 -0.5 -1.6 -1
Willow School (M)
L
Gladstone NJ Education 20,000 21.8 68.8 35.0 110.2 -13.1 -41.4 -12
Phipps Conservatory SEED Classroom L
(M) Pittsburgh PA Education 950 14.5 45.8 20.8 65.6 -6.3 -19.8 -6
Rocky Mountain Institute Innovation
2015 Center L (M) Basalt CO Office 15,610 16.8 52.9 26.2 82.7 -9.4 -29.8 -12
Suncoast Credit Union - Bushnell
Service Center (M) Bushnell FL Office 3,743 6.8 21.4 8.4 26.5 -1.6 -5.1 -12
2016 Maclay Architects' Office (M) Waitsfield VT Office 2,568 22.1 69.5 25.0 78.6 -2.9 -9.1 -2
Building names in Bold are new to the List
Buildings with (M) indicate measured data
(L) indicates LEED Certification
20 2018 Getting to Zero Status Update and List of Zero Energy ProjectsYou can also read