Demographic Dividend or Demographic Burden? India's Education Challenge
←
→
Page content transcription
If your browser does not render page correctly, please read the page content below
POLICY BRIEF
    CHRISTOPHE JAFFRELOT AND SANSKRUTHI KALYANKAR

Demographic Dividend or Demographic
Burden?
India’s Education Challenge
“India’s demographic dividend began in the early 1980s and is expected to come to an end towards
 latter part of 2030s. India is, therefore, just beyond the midpoint of its dividend and this once in a
   life time opportunity for our nation is unlikely to last beyond another quarter of a century from
  now. We therefore, need to increase and sustain our GDP growth, reduce poverty, and enhance
human capabilities of our people. Every year lost will never return in the life of a child or youth and
                        in the next 25 years, India will be an ageing society »1.
     “With a large pool of skilled people, India has an opportunity to become a skill provider for the
                            world, particularly the ageing developed world”. 2

India’s population of under 19-year-olds has reached its peak and the country is therefore in a
position to maximize its demographic dividend3. But for that it needs to educate its youth properly.
This is a huge challenge both quantitatively and qualitatively. In terms of numbers, proper training
has to be provided to the 8 million new job seekers who enter the job market every year - according
to a conservative estimate4. In 2017, only 5.5 million had been created and India is facing today a
massive employment problem, the unemployment rate being the highest in 45 years5. According to
an independent statistical institution, the Centre for Monitoring Indian Economy Pvt. Ltd., the Indian
1
 Ministry of Skill Development and Entrepreneurship, Report of the Committee for Rationalization and
Optimization of the Functioning of the Sector Skill Councils, vol. I, Appendices, p. 8, New Delhi, 2016 ().
2
  Pradhan Mantri Kaushal Vikas Yojana, “Scheme Document of Pradhan Mantri Kaushal Vikas Yojana”, New Delhi,
National Skill Development Corporation, 28 April 2015
(https://pmkvyofficial.org/App_Documents/News/PMKVY_Scheme-Document_v1.1.pdf).
3
  Nicholas Newton-Cheh, “India must invest in its human capital, or risk a “’Demographic Disaster’”, South Asia
Program at Hudson Institute, 30 July 2019 (http://www.southasiaathudson.org/blog/2019/7/30/indias-must-
invest-in-its-human-capital-or-risk-a-demographic-disaster). 44% of the Indians are below 24.
4
  These are conservative estimates. According to the National Policy on Skill Development and Entrepreneurship
2015 by Government of India (GOI), the number of young people who potentially enter the work force every year is
estimated at 26 million. Assuming an average labor participation rate of 90% for male and 30% for female, at least
16 million persons will enter workforce and they all, except those opting for higher education (about 12%) need to
acquire skills. This will amount to a staggering 105 million fresh entrants into the workforce by 2022.In addition,
298 millions of existing farm-non-farm sector workers will need to be skilled, reskilled and upskilled. (Nayana
Tara, 2016)
5
  Santosh Mehrotra, “India Does Have a Real Employment Crisis – And it’s Worsening”, The Wire, 6 February 2019
(https://thewire.in/economy/india-worsening-employment-crisis. Manufacturing jobs fell from a little bit less
than 59 million in 2012 to a little bit more than 44 millions in 2017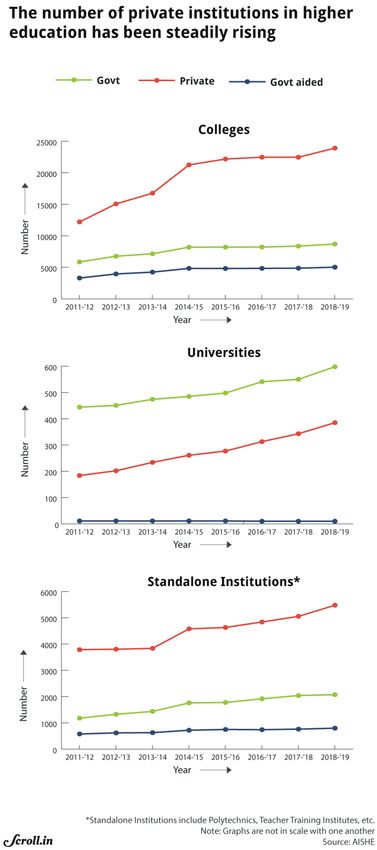
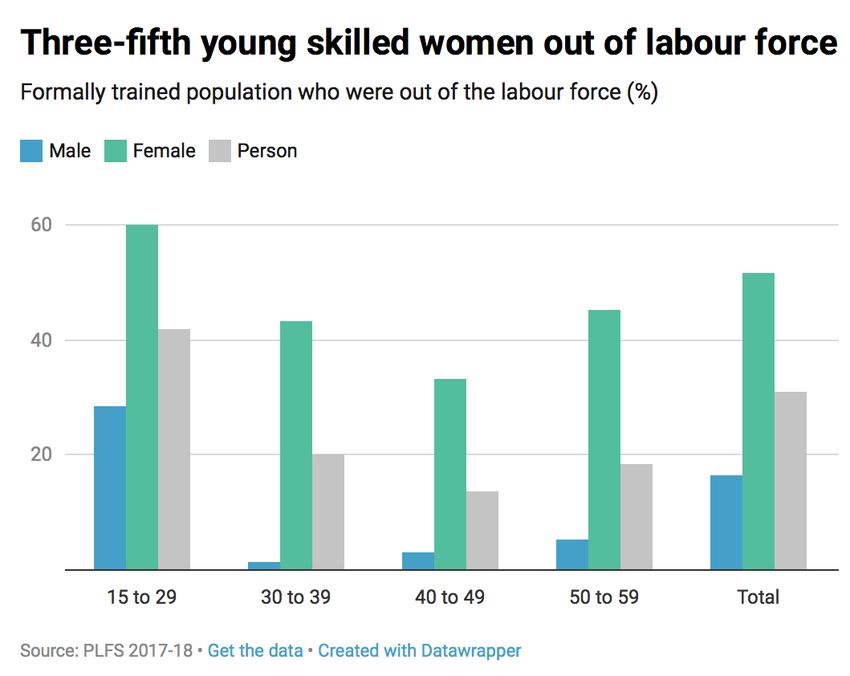
youth is the first casualty of this state of things, as the unemployment rate reached 34% among the
20-24 years old in the first quarter of 2019 – and even 37.9% among the urban lot6. Official sources
emanating from the government of India do not give very different data: according to the last 2018
Periodic Labour Force Survey (PLFS), the unemployment rate among the urban 15-29 years old (a
very large bracket) was 23.7%7. One may hypothesize that this pervasive joblessness was due to
the poor training of the youth as only 7% of the people surveyed in the framework of the PLFS
declared any formal or informal training8.
But there is a paradox there because at the same time, according to a recent survey, “48% of India
employers report difficulties filling job vacancies due to talent shortages”9, so much so that 36% of
them have decided to train their own people. The sector that is the most badly affected is one of the
strong points of India’s economy, the Information Technology (IT), where 140,000 skilled techies
could not be recruited in 2018 in spite of the employers’ efforts (a high proportion of the 500,000
jobs offers that had been made that year)10.
A similar mismatch between supply and demand is also evident from the enormous number of
graduates and post-graduates who apply to unskilled jobs. When the Indian Railways announced
that it would create 63,000 jobs - all situated in the lowest level of its employment ladder -, 20
million candidates applied, including 419,137 BTech degrees holders and 40,751 people with
master degrees in engineering11. At an aggregate level, the CMIE reports are showing that the more
educated Indians are, the more likely they are of remaining unemployed too, the joblessness rate of
graduates reaching 14.7% (for the urban graduates), against 11.1% for those who have left school
in class 10th-12th, 3.6% for those who stopped in class 6th-9th and 1.1% for those who studied till
class 5th only12.
The government of India’s figures are even more disturbing, as the Periodic Labour Force Survey
covering the last quarter of 2018 revealed that 33% of the formally trained 15-29 years old who had
been formally trained were jobless. As a result, many stopped looking for a job: 42% of the formally
trained young people belonging to this age class are not part of the labor force at all. Many of them
moved out “after a fruitless job search”13 to join the huge category known as NEET that is composed
of those who belong to the 15-29 years-old age class and are “Not in Education, Employment or
Training”. This group was 70 million large in 2005; it is now above 115 million according to credible
estimates14. The situation is much worse for women than for men, as evident from the graph below.

6
  Unemployment in India A Statistical Profile. January-April 2019, New Delhi, Centre for Monitoring Indian
Economy Pvt. Ltd., 2019, p. 8 and p. 16. (https://unemploymentinindia.cmie.com).
7
  National Statistical Office, Quarterly Bulletin - Periodic Labour Force Survey (PLFS). Oct.-Dec. 2018, New Delhi,
Government of India, May 2019, p. 8.
(http://mospi.nic.in/sites/default/files/publication_reports/Quarterly%20Bulletin%20Oct-%20Dec%202018.pdf).
For a simplified account, see A. R. Mishra, “Unemployment on the rise among urban youth, finds survey », Mint, 3
June 2019 (https://www.livemint.com/politics/policy/unemployment-on-the-rise-among-urban-youth-finds-
survey-1559500104301.html).
8
  I. Anand and A. Thampi, “33% of India’s skilled youth jobless: official survey”, Mint, 7 August 2019
(https://www.livemint.com/politics/policy/a-third-of-skilled-youth-in-india-jobless-official-survey-
1565161972818.html).
9
  “48% of Indian employers up against talent shortage”, The Economic Times, 18 October 2016
(//economictimes.indiatimes.com/articleshow/54913657.cms?utm_source=contentofinterest&utm_medium=text
&utm_campaign=cppst
10
   “Shortage of skilled IT workforce looms over India: Nasscom”, The Economic Times, 15 February 2019
(//economictimes.indiatimes.com/articleshow/68005627.cms?from=mdr&utm_source=contentofinterest&utm_
medium=text&utm_campaign=cppst).
11
   Arun Kumar Das, “Graduates, Post-Graduates Among Candidates in Race to Become Helpers in Railways”, The
Wire, 19 March 2019 (https://thewire.in/labour/indian-railways-jobs).
12
   Unemployment in India A Statistical Profile, op. cit., p. 12.
13
   I. Anand and A. Thampi, “33% of India’s skilled youth jobless: official survey”, op. cit.
14
   Santosh Mehrotra, “India Does Have a Real Employment Crisis”, op. cit.
Source: I. Anand and A. Thampi, “33% of India’s skilled youth jobless: official survey”, op. cit.

Source: I. Anand and A. Thampi, “33% of India’s skilled youth jobless: official survey”, op. cit.
Source: I. Anand and A. Thampi, “33% of India’s skilled youth jobless: official survey”, op. cit.

In order to understand this situation, in the first part of this article, we will analyze the education
system of India, from primary school to higher education. In the second part, we will focus on the
policies initiated by the Modi government in this domain.
BOX 1: The IT sector lacks qualified engineers
The sector wise Periodic Labour Force Survey data show that the bulk of the jobless trained youth
are in the fields of electronics, IT and mechanical engineering. But according to the National
Employability Report by Aspiring minds, eight out of ten Indian engineers are not employable in
any position in the knowledge economy. About the IT engineers, the report makes an appalling
revelation that mere 3.84% of the engineers have the technical, cognitive and language skills
required for software related jobs in start-ups.
Source: Higher education: https://www.business-standard.com/article/interim-budget-2019/budget-2019-
          what-govt-needs-to-do-to-boost-higher-education-institutions-119013000149_1.html
Primary and secondary education: https://www.indiaspend.com/what-budget-2019-can-do-to-raise-indias-
                                 plummeting-quality-of-school-education/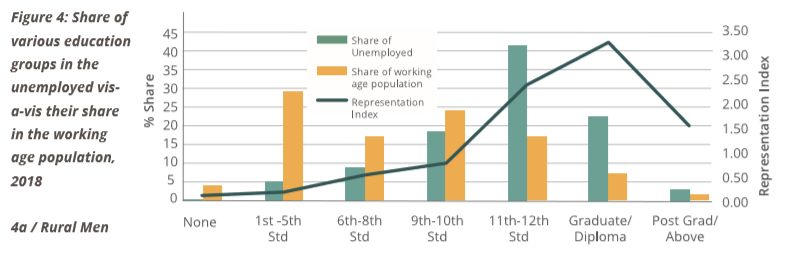
The Indian education system
In this section, we will first assess the performances of India’s public education system and compare
it with what the private system has achieved before looking for explanations.

                                          Assessing achievements15

A proper assessment of India’s public system of education needs to combine official data and
independent surveys from NGOs, not only for the sake of objectivity, but also because of official
data’s paucity.

     -   Primary and secondary schools:

One of the key indicators that the government of India is not updating any more is the dropout rate.
The last official report providing information on that front uses figures released for the year 2015-
2016. It showed that the Right to Education Act, passed in 2009, had resulted in a massive reduction
of the dropout rate (to a meagre 4%) for the Elementary classes (from classes 1 to 8) because the
RTE Act made education compulsory till class 816. The rate, afterwards, jumped to 17% in classes 9
and 1017. In 2018, in response to a question asked in the upper house of the Indian parliament, the
Rajya Sabha, the Minister of State for Human Resources Development, Upendra Kushwaha,
informed the assembly that this rate, still for 2015-2016, was 16,88% for girls and 17.21% for boys18.
These figures are consistent with the Gross Enrollment Ratio (GER), which is the number of
individuals who are actually enrolled in a particular level of education per the number of children
corresponding to this enrolment age. In 2015-16, this ratio had reached 97% for the Elementary
classes, but had dropped to 80% for the Secondary classes (9 and 10) and was only of 56.2% for the
Senior Secondary classes (11 and 12)19. These national averages need to be disaggregated state-
wise. For the classes forming the “Upper Secondary” level the figures are much lower in some states
of the Indian Union: 46% in Madhya Pradesh, 43% in Gujarat, 40% in Karnataka, 36% in Bihar etc.20
While the GER has significantly increased so far as the elementary schools are concerned, the
quality of the education that is offered there remains debatable. It is not easy to measure
comparatively since India dropped out of the Program for International Student Assessment (PISA)
in 2009 after being placed 72nd out of 74 nations (including Brazil, China, Thailand, Indonesia, Viet
Nam etc.). India then claimed that the program was not sufficiently adapted to the Indian context21.

15
    We are grateful to Kiran Bhatty for her comments on this section
16
   On the RTE and the trajectory of the Indian education system that took place before, see S.C. Ghosh, History of
Education in Modern India, Hyderabad, Orient Black Swan, 2013.
17
   “Trends in school enrolment and dropout levels”, The Mint, 2 Oct. 2017
(https://www.livemint.com/Education/k1ANVHwheaCFWCupY3jkFP/Trends-in-school-enrolment-and-dropout-
levels.html).
18
   “Annual average dropout rate of girls is lesser than dropout rate of boys at secondary level”, Rajya Sabha, 23
March 2018 (http://pib.gov.in/Pressreleaseshare.aspx?PRID=1526144). See also the web site of the Ministry of
Human Resources Development where, in 2019, no more recent information is available
(https://mhrd.gov.in/sites/upload_files/mhrd/files/drop%20out%20rate%20release.pdf).
19
   Children in India, 2018 – A statistical appraisal, Social Statistics Division Central Statistics Office Ministry of
Statistics and Programme Implementation, Government of India, New Delhi, 2018, p. 42
(http://www.mospi.gov.in/sites/default/files/publication_reports/Children%20in%20India%202018%20–
%20A%20Statistical%20Appraisal_26oct18.pdf). For more details, see School Education in India:U-DISE2015-16,
National University of Educational Planning and Administration, September 2015,
(http://www.dise.in/Downloads/Publications/Documents/U-DISE-SchoolEducationInIndia-2015-16.pdf)
20
   H. Kaushik, “57% of girl students drop out of schools by class XI: Report”, The Times of India, 1st Dec. 2018
(http://timesofindia.indiatimes.com/articleshow/66900622.cms?utm_source=contentofinterest&utm_medium=te
xt&utm_campaign=cppst). See also “What is the dropout rate among schoolchildren in India?”, The Hindu, 4 January 2019.
(https://www.thehindu.com/education/percentage-of-school-dropouts/article25909306.ece).
21
   A. Vishnoi, “Poor PISA score: Govt blames ‘disconnect’ with India”, The Indian Express, 3 Sept. 2012
(http://archive.indianexpress.com/news/poor-pisa-score-govt-blames--disconnect--with-india/996890/1).
In order to assess the students’ skills, the Government of India created its own National
Achievement Survey in 2012 which analyzed first the learning capacity of Class 8 students. It
showed that 29% of the students “struggled in questions that required reasoning”, and that 33% of
them “struggled with questions that required application and reasoning”22. After taking over in 2014,
the Modi government organized a similar exercise that covered about 2.5 million children of Classes
3, 5 and 10 in the framework of the National Achievement Survey23. Over a quarter of all the Class 5
students scored between zero and 35 out of 100 in reading, mathematics and environmental
science.
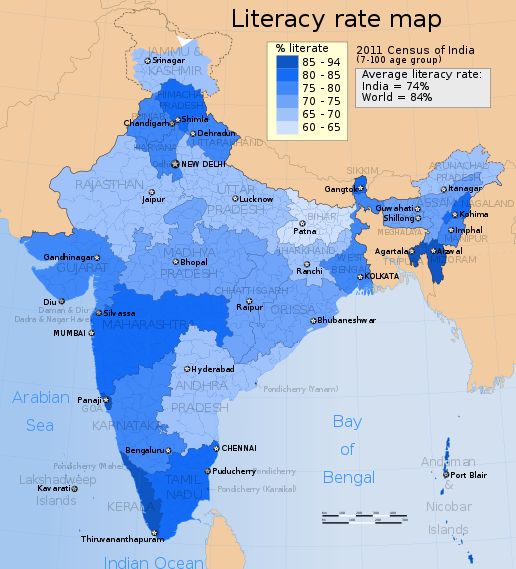
Primary and secondary education being state subjects, some state governments have initiated
policies that have resulted in significant improvement, as evident from the uneven literacy rate that
one finds across the country (see Appendix 1). Delhi is a case in point (see Box 2), but there are
other, older and more convincing success stories, including those of Kerala and Himachal Pradesh.
BOX 2: The case of Delhi
In this state, the government of Arvind Kejriwal, whose party – the Aam Aadmi Party (the Party of
the Common Man) - took over power in 2015 has given a priority to education, and a new kind of
education. The education budget increased by 106% from 2015-16 to 2016-201724, so much that
in 2017-18, it represented 26% of the state’s budget.25 This money was used to build 25 new
schools and 8,000 classrooms in three years.26 But improvement was not only quantitative. Under
the influence of educationists, including Atishi Marlena27, who worked as adviser to Education
Minister Manish Sisodia, the Delhi government has focused on the foundation of students from
grades 6th to 8th who could not even read a simple passage or solve a math problem. A basic
learning material/reading assessment tool for the campaign was developed by the Pratham and
helped to close the gaps of those who lagged behind.28 The Delhi government also promoted “arts
in education by nurturing and showcasing the artistic talent of school students at the secondary
stage in the country through music, theatre, dance, visual arts and crafts”.29 In the same spirit,
students between Class nursery and Class 8 have a 45-minutes 'happiness period' which includes
“meditation, storytelling, question and answer sessions, value education and mental
exercises”.30
The Delhi government has invested a lot in the training of teachers, who have been sent abroad
in order to learn from international experiences and who have benefited from an Online Capacity
Building Programme (OCBP)31. In order to explain these innovations to the parents and to
improve the communication with the teachers and the parents, the Delhi government “instituted
22
What Students of Class VIII know and can do. A Summary of India’s National Achievement Survey, Class VIII,
2012, New Delhi, National Council of Educational Research and Ttraining, 2012
(https://mhrd.gov.in/sites/upload_files/mhrd/files/upload_document/11-March-National-Summary-Report-
NAS-Class-VIII.pdf).
23
For more details, see https://mhrd.gov.in/sites/upload_files/mhrd/files/upload_document/Summary-NAS-
Class-3-Final.pdf
24
A. Bhakto, “The Delhi difference”, Frontline, 12 April 2019 (https://frontline.thehindu.com/cover-
story/article26650791.ece).
25
Vikas, “5 things AAP did to make Delhi govt schools better than they ever were”, One India, 5 May 2019
(https://www.oneindia.com/india/5-things-aap-did-to-make-delhi-govt-schools-a-better-place-to-study-
2745202.html).
26
“5 things AAP did to make Delhi govt schools better than they ever were”
27
A reliable source points out that “the appointment of Atishi Marlena, who worked as adviser to Education Minister
Sisodia at a salary of Rs.1 a month and was at the forefront of conceptualizing and implementing key schemes, was
cancelled along with that of eight other advisers on the grounds that the Delhi government had not taken the
Centreʼs assent for the same”. A. Bhakto, “The Delhi difference”, op. cit.
28
M. Koshy, “9 Programmes That Are Changing How Students Learn In Delhiʼs Government Schools”, Youth ki
Awaaz, no date (https://www.youthkiawaaz.com/2019/01/9-programmes-that-are-changing-how-students-
learn-in-delhis-government-schools/).
29
“9 Programmes That Are Changing How Students Learn In Delhiʼs Government Schools”
30
“5 things AAP did to make Delhi govt schools better than they ever were”
31
“9 Programmes That Are Changing How Students Learn In Delhiʼs Government Schools”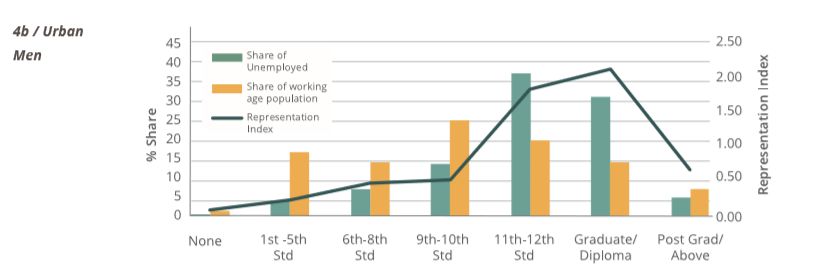
a Mega Parent-Teacher Meeting Scheme, and strengthened and regularized the School
 Management Committees” where parents were represented.32
 Last but not least, the government has established 11 incubation Centres giving them a grant of
 Rs. 15 million for each: “College/university students with creative minds are given an opportunity
 to explore their ideas through a platform and financial assistance”33.
 These innovations bore fruits, as evident from the results of the Central Board of Secondary
 Education (CBSE) examination for Class 12. The pass percentage of Delhi government schools
 increased from 88.36 per cent in 2017 to 90.68 per cent in 2018, even as private schools of the city
 lagged behind at 88.35.34 The overall performance of Delhi government schools was the second
 best in the country, after Thiruvananthapuram (Kerala)”35.
 However, these results are contested by other reports, including the one that the Praja
 Foundation, an NGO specializing in education submitted in 201936. First huge vacancies remain
 (25% as of the latest U-DISE figures). Second the Delhi government continues hiring contract
 teachers (20% of the total, even though RTE expressly bans the practice). Third, it has installed
 cc-TV cameras in classrooms to monitor teachers to increase “accountability”, but this move has
 been counterproductive. Fourth, the teacher trainings held in foreign locales have not translated
 to much use in local classrooms for obvious reasons.

32
   N. Anweer, “Teachers and Parents on the Delhi Govt’s Big Bang Education Reforms”, The Citizen, 7 June 2019
(https://www.thecitizen.in/index.php/en/NewsDetail/index/9/17067/Teachers-and-Parents-on-the-Delhi-
Govts-Big-Bang-Education-Reforms).
33
   “9 Programmes That Are Changing How Students Learn In Delhiʼs Government Schools”
34
   “5 things AAP did to make Delhi govt schools better than they ever were”
35
   A. Bhakto, “The Delhi difference”, Frontline, 12 April 2019 (https://frontline.thehindu.com/cover-
story/article26650791.ece).
36
   K. Sharma, “Under Arvind Kejriwal govt, enrolment & pass percentage have fallen in Delhi govt schools”, The
Print, 26 March 2019 (https://theprint.in/india/education/under-arvind-kejriwal-govt-enrolment-pass-
percentage-have-fallen-in-delhi-govt-schools/210904/).
Source: S. Roy Chowdhury and N. Subramanian, “The Election Fix: Have BJP’s attempts to solve India’s education
problems done more harm than good?”, Scroll.in, 12 May 2019 (https://scroll.in/article/923137/the-election-fix-
have-bjps-attempts-to-solve-indias-education-problems-done-more-harm-than-good).
These findings have been reconfirmed by other surveys, including the Annual Status of Education
Report (ASER), which has been published in 2018 by the NGO Pratham. This remarkably
comprehensive exercise - 546,527 children have been surveyed in 2018 - which is repeated every
year in rural India since 200837, shows that their skills remain lower than what it was at the
elementary level in 2008 from two points of view. First the proportion of the children in government
schools in Standard 5 who can read Standard 2 level text has declined from 53.1% to 44.2%38 and
those who can do a simple division has diminished from 34.4% to 21.1%39.
These figures are not easy to interpret. The decline may be due to the Right to Education Act (2009)
that has suddenly resulted in the enrollment of children from the poor families that till then did not
send their children to school and had a very low intellectual capital40. Indeed, the percentages
mentioned above dropped by nine percentage points between 2010 and 2012 while the GER
increased; but they are going up again, as if schooling started to compensate the low intellectual
capital of the new comers.
Registration is one thing, but attendance is another. The Annual Status of Education Reports show
that there is hardly any improvement on that front. Since 2010, the proportion of children attending
schools in classes 1 to 8 oscillates between 71 and 72%41. One of the reasons for this stagnating,
rather low level of attendance pertains to the available facilities. In spite of the strict conditions
under which a government school can be registered since the passing of the RTE Act (2009), all the
schools don’t have usable toilets – 74.2% of the rural schools visited by Pratham had one - or
separate toilets for girls (66.4% had some), electricity connection (75% had one) or did not give mi-
day meals (91% did)42.
The situation of higher education is better, but is naturally affected by that of the secondary
education.

     -   Higher education43:

India has emerged as the largest higher education system in the world in terms of the number of
institutions and the second largest in terms of the number of students. It has benefited from a
massive investment under the UPA government (2004-2014). The XIth five-year plan (2007-2012)
approved a budget of Rs. 850 bn (compared to Rs. 96 bn in the previous one), which resulted in the
doubling of the number of students in less than five years, from 11.6 million in 2006-07 to 24 million
in 2011-1244. Despite this it fails at inclusivity, as the Gross Enrolment Ratio (GER) in tertiary
education in India is significantly low at 28%, ten percentage points below the global average of
37.88%, according to World Bank estimates. The official Indian figures are even less encouraging,
as evident from the All India Survey on Higher Education (AISHE). In its 2018 report – based on data
collected in 2017 –, the AISHE pointed out that the GER in Higher education, calculated for the 18-
23 years age group was 25.8% (26.3% for males and 25.4% for females) – that is 36.6 million,
including 19.2 million boys and 17.4 million girls45. Besides, most of the students – 79.2% – were

37
   For a summary of the report, see Main Findings All India (Rural) Report, Pratham, 2018
(http://img.asercentre.org/docs/ASER%202018/Release%20Material/aser2018nationalfindingsppt.pdf).
38
   Madhav Chavan, “Something is changing... “, in Annual Status of Education Report (Rural), New Delhi, ASER
Centre, 2019, p. 9.
39
   Ibid., p. 11.
40
   Wilima Wadhwa, “Equity in learning?”, ibid., p. 17.
41
   Annual Status of Education Report, op. cit., p. 56.
42
   Ibid.
43
   On Indian Universities, the best study is Pankaj Chandra, Building Universities that Matter: Where are Indian
Universities Going Wrong?, Hyderabad, Orient Black Swan, 2017.
44
   K. Kamar Jahan and D. Christy Selvarani, “Higher Education in India: Issues and Challenges”, International
Conference on Humanities, Literature and Management (ICHLM'15) Jan. 9-10, 2015 Dubai (UAE)
(https://icehm.org/upload/2797ED0115098.pdf).
45
   For international comparability, AISHE has also calculated the Indian GER taking 18-22 years Population and it
comes out to be 30%. (All India Survey on Higher Education, New Delhi, Government of India. Ministry of Human
Resource Development. Department of Higher Education, 2018, p. 19 (https://epsiindia.org/wp-
content/uploads/2019/02/AISHE-2017-18.pdf).
enrolled in Undergraduate level programs, whereas very few reached the PhD level: a meager 0.5%
of students, that is 161,412, did it. Only 34,400 were awarded PhD level degree in 201746.
This reflects the little interest Indian universities put into research. This big weakness explains that
in 2014-15, the share of Indian institutions of higher education in R&D was a mere 4% in India, when
in other countries it varied from 7% China to 40 % in Canada47. More generally speaking, India is
experiencing a big innovation gap that is partly due to the weakness of its higher education system.
Paradoxically, many Indians have contributed to the innovative quality of the US – especially in the
IT sector – and the other countries where they had migrated –, not to India. And this brain drain is
largely due to the fact that hundreds of thousands of young, bright Indians have to study abroad
because of the poor facilities that the higher education system of their country offers. In 2018,
752,725 Indian students were studying abroad, including 211 703 in the US, 124 000 in Canada,
87 115 in Australia, 50 000 in the UAE, 27 200 in Bahrain, 18,171 in China, 16,550 in UK, 11,000 in
Ukraine, 8,500 in Kyrgyzstan and 6,000 in France48. This brain drain, not only inflicts forex expenses
to India – which have jumped from $ 1,663 mn in 2013 to 2,776 between 2013 and 2018, but it also
affects India’s innovative capacity49. Correlatively, India has been ranked at lowly 104th and 114th
positions so far as its capacity to retain and attract talents was concerned in the global index of
talent competitiveness – below all the other BRICS countries again50.
46
. Ibid., pp. II and III.
47
S. Padmanabhan, “India’s R&D expenditure trebles in a decade”, The Hindu Business Lines, 15 January 2018
(https://www.thehindubusinessline.com/news/science/indias-rd-expenditure-trebles-in-a-
decade/article10033448.ece). This is one of the reasons why India spent only 0.69% of its GDP on R&D in 2014-15,
while Brazil, Russia, China and South Africa spent 1.24%, 1.19%, 2.05% and South Africa 0.73% respectively
(Ibid.).
48
K. Deepalakshmi, “US continues to be preferred destination for Indian students; UAE sees a surge”, The Hindu, 27 July 2018
(https://www.thehindu.com/education/us-continues-to-be-preferred-destination-for-indian-studentsuae-sees-a-
surge/article24533290.ece).
49
This increase is due to the growing number of outgoing students, the rise of fees and the decline of the rupees. In
contrast, the number of foreign students studying in India is declining, from 37, 947 in 2016 to 36,887 in 2017 (P. K.
Nanda and A.R. Mishra, “More Indians going abroad for studies, but foreign students aren’t coming in”, Mint, 17
August 2018. https://www.livemint.com/Education/qVtlWO1E9D923fiDD2o69I/More-Indians-going-abroad-for-
studies-but-foreign-students.html)
50
“India slips to 92nd rank on global talent competitiveness”, The Indian Express, 16 January 2017
(https://indianexpress.com/article/education/india-slips-to-92nd-rank-on-global-talent-competitiveness-
4477103/).Source: S. Roy Chowdhury and N. Subramanian, “The Election Fix: Have BJP’s attempts to solve India’s education
problems done more harm than good?”, Scroll.in, 12 May 2019 (https://scroll.in/article/923137/the-election-fix-
have-bjps-attempts-to-solve-indias-education-problems-done-more-harm-than-good).
Graph 1 : Gross Enrollment Ratio Higher Education in India and other countries in 2016
School Enrollment, tertiary(% gross)
100
90
80
70
60
50
40
30
20
10
0
om
n
es
il
ia
a
ia
sh
a
az
in
ric
tio
d
es
at
e
In
Ch
gd
Br
lad
Af
on
ra
St
n
de
h
ng
d
d
Ki
ut
In
ite
Fe
Ba
d
So
Un
ite
sia
Un
s
Ru
Source: World Bank, 2016 (https://data.worldbank.org/indicator/se.ter.enrr)Since the 1950s, India’s has been striving to develop centers of excellence for higher education
through Indian Institutes of Technology (IITs), Indian Institutes of Management (IIMs), Indian
Institutes of Information Technology (IIITs) and National Institute of Technology (NITs) which
receive more than half of the money the Union government spends on higher education. Yet, none
of the premier institutions manage to make it into decent ranks of the global indexes. India has
managed to increase its representation in the Times Higher Education (THE) World University
Rankings with 49 places compared to last year’s 42 -- but has not made into the top 250 institutions.
Among the ones which featured in the ranking, The Indian Institute of Science -- in the 251-300 band
-- continues to retain the lead, while IIT Indore becomes India’s second highest-ranked university
in the 351-400 rankings bracket. 51
Most students attend local and regional universities that are provided small budgets.
- Vocational training:
Vocational training in India is primarily imparted through Industrial Training Institutes along with
the National Institute for open schooling. There are more than 15,044 it is with capacity of
approximately 26 lakh seats52. Directorate General of Training also governs Regional Vocational
Training Institutions and National Skills training Institutes focusing on specialized and high-end
skill sets and trainers courses. These institutions often face the problem of poor infrastructure and
lack of trainers. It also faces a social stigma of being an option for the less-academically able
students.53 And hence, most of the students would rather pursue formal courses over vocational
education courses.
A recent study by Teamlease Services Ltd., highlights that the current vocational education
ecosystem has not been very successful in creating adequate employable job seekers. It has found
that more than 60% of the candidates and employers find vocational education (voc-edu) courses
to be ineffective. Further, only 18% of the students undergoing voc-edu courses get jobs, of which
merely 7% are formal jobs. 54
As per the study, some of the key reasons for this misalignment between vocational education and
the industry are the absence of rich academic content, inadequate funding and negative perception
about these courses. Another major issue being the lack of awareness for these courses and scope
for continued learning. Moreover, vocational education courses today do not have a structure for
defined outcomes and therefore tend to be ineffective. In fact, around 70% of the employers feel
the quality of training provided by the vocational institutes is not up to the mark. Rather it is poor.
Around 72% of the corporates interviewed felt the employability was also considerably lower with
candidates from the vocational education stream. This discontent over the training process is not
only felt by the employers, the students (42%) themselves agree that the training quality is below
par.
A majority of corporate, as well as students, believe the current vocational education is unable to
cater to their business requirements and aspirations. Moreover, the study found that the current
system is also plagued with a lack of awareness from the public. While the industry (58%) had some
knowledge, the candidates (76%) were unaware of most of the initiatives and courses offered by
the vocational institutes.
51
S.D. Basu, “No Indian institution in top 250 in THE World University Rankings”, The Economic Times, 27
Septembre 2018 (https://economictimes.indiatimes.com/industry/services/education/no-indian-institute-in-
top-250-in-the-world-university
rankings/articleshow/65967796.cms?utm_source=contentofinterest&utm_medium=text&utm_campaign=cppst
or//economictimes.indiatimes.com/articleshow/65967796.cms?utm_source=contentofinterest&utm_medium=tex
t&utm_campaign=cppst).
52
Government of India, Ministry of Skill Development and Entrepreneurship, Lok Sabha unstarred question n°160,
to be answered on 04.02.2019 (http://loksabhaph.nic.in/Members/QResult16.aspx?qref=78359).
53
https://www.thehindu.com/education/the-vocational-way/article21378657.ece
54
TeamLease Services Limited, “Signaling Value of Skill Education and Hands on job Report” 12th February 2018,
(https://www.teamleasegroup.com/sites/default/files/resources/TL-IIJT_SignalingValue_verFinal.pdf)Material and immaterial issues
- Financial limitations:
Critical assessments of India’s public education system have identified two types of issues that can
be defined as material and immaterial.
In the first category, financial considerations prevail. Historically, India has not recognized
education as a priority – as evident from the fact that education was not compulsory in some states
for years55 and from the low level of investment. The overall education expenditure by the Centre
and by the state governments has always been very low. It represented 3.1% of the GDP between
2000 and 2003 and 2 to 2.5% of the total central budgetary expenditure56. According to the UNESCO,
the Indian expenditure on education as a proportion of the total government expenditure declined
from 17% in 1999 to 11% in 2009, before rising again and reaching 14% in 201357. In percentage of
GDP it declined from 4.5% in 1999 to almost constantly, though moderately, from 3.9% in 1999 to
3.1% in 2006, before rising again to reach 3.8% in 201358.
These figures are below those displayed not only by developed countries, but also by emerging
countries, including the BRICS.
Table 1: BRIC public expenditure on education (share of GDP/2000-2012) 2000
2005 2006 2010 2012
Brazil 4.8 4.1 4.3 5.1 5.3
Russia 2.9 3.7 3.8 4.6 4.1
India 3.2 2.6 2.7 3.1 3.7
China 2.9 2.9 3.0 3.1 4.3
Source: J. Werle Rodrigues and P. Ramburuth, “Investment in Education and Impact on Economic Growth within
BRIC Countries”, Proceedings of Sydney International Business Research Conference 2015, University of Western
Sydney Campbelltown, Australia, 17-19 April, 2015; ISBN 978-0-9942714-0-2.
(https://www.researchgate.net/publication/296673785_Investment_in_Education_and_Impact_on_Economic_Gro
wth_within_BRIC_Countries/stats).
Certainly, the situation is different in different states as primary and secondary educations are state
subjects, but these variations are of degree rather than nature. Some states have invested more
funds than others in education and unsurprisingly, those who have been the most generous have
the best results, in terms of literacy for instance (see Appendices 1 to 3) - a clear indication that
public money is not necessarily spent in vain.
55
M. Weiner, The Child and the State in India. Child Labor and Education Policy in Comparative Perspective,
Princeton, NJ., Princeton University Press, 1990.
56
Subhanil Chowdhury and Prasenjit Bose, “Expenditure on Education in India: A Short Note”, Social Scientist, Vol.
32, No. 7/8 (Jul. - Aug., 2004), pp. 85-89. https://www.jstor.org/stable/3518263?read-
now=1&seq=5#metadata_info_tab_contents
57
http://data.uis.unesco.org/Index.aspx?queryid=183#
58
https://data.worldbank.org/indicator/SE.XPD.TOTL.GD.ZS?locations=INTable 2 : Allocation to education as a percentage of seven total state expenditure in five states in
2019-20
States Allocation to education as a percentage of seven total
state expenditure in five states in 2019-20 (The National
Average is 15.9% calculated for the year 2018-19)
Andhra Pradesh 15.7
Bihar 17.9
Kerala 15
Tamil Nadu 14.7
Uttar Pradesh 14.3
Delhi 27.8
Maharashtra 18.9
- Teachers and curricula as problems
The uneven quality of the teachers partly explains the uneven achievements of the children. First,
teachers’ attendance remains low in government schools. According to Pratham, it has declined
from 87 to 85% in rural schools between 2010 and 201859.
Secondly, the teachers’ training leaves a lot to desire. There has been a significant reduction in the
budget allocated to teacher training. Funds for the teacher training component declined by 87%
over six years, from Rs 1,158 crore in 2014-15 to Rs 150 crore in 2019-20, indicating that it is of low
priority to the current government. Because of poor allocation for teacher education, states have
failed to build adequate teacher training institutes and institutional capacity to train teachers. The
District Institutes of Education and Training (DIETS), conceived as teacher training and curriculum
development institutions, have failed to live up to their role60.
Thirdly, remuneration of teachers is problematic. Contrary to popular belief, very few teachers are
paid Pay Commission salaries. Some are even being paid less than minimum wage (ex: Gujarat). In
spite of these low wages, some states prefer to recruit contract teachers or to leave the posts
vacant. In 2017, nine lakh posts of teachers were vacant in elementary schools and more than one
lakh teacher posts was vacant in secondary schools.
Excessive non-teaching duties amounts to a de-professionalization of teachers and the evaluation
mechanisms are rather limited.
The curriculum is over-ambitious whereas “teaching at the right level” experimented by Pratham
has shown that the teachers could keep all the children on board by following it 61. Last but not least,
the standard pedagogical methods are not sufficiently interactive, as the children are supposed to
absorb the information communicated by a school-master – often called “guruji” –, unsurprisingly.
59
Annual Status of Education Report, op. cit., p. 56.
60
Centre for Budget and Governance Accountability (CBGA), 2018
61
Rukmini Nanerji, “Behind the headlines », in ibid., p. 13.In higher education, the University Grant Commission, the regulator, has been incompetent in
tackling challenges of the sector. It overregulates in areas where it needs to back off, such as
admissions and funding, but under-regulates were its interventions are most needed such as
ensuring quality standards.62 Pankaj Chandra points out: "We provided no flexibility and created
water tight rules which are applicable to everybody”. Chandra also highlights the lack of
interdisciplinary programs and emphasis on research in Indian Higher Education63, two things he
tries to promote as head of Ahmedabad University.
Is privatization of education the solution?
The low quality of government school has persuaded many parents to send their children to private
schools. This shift has also been precipitated by the craze for English-medium education,
something every family is longing for today. The rolls of private schools have increased from 44
million in 2010-11 to 61 million in 2016-17, while those in government schools fell from 126 million
to 108 million in 21 of Indiaʼs 29 states for which there is any data64. As a result, in some states, the
number of government schools has diminished: in Rajasthan, it has shrunk from 82,000 to 63,000
between 2013 and 201865.
The proportion of children attending private schools in rural India has gone up, from 22% to 30%
between 2008 and 2018. But this percentage has been stable for a couple of years. First, many
families could not to pay for private education, especially because they also had to finance tuition
62
Harsh V Pant, “The Challenges of Higher Education”, The Business Standard, 20th July 2018,
https://www.business-standard.com/article/opinion/the-challenges-of-higher-education-118073000007_1.html
63
Goutam Das, “What went wrong with Indian higher education”, Business Today, 18 March 2019
(https://www.businesstoday.in/top-story/what-went-wrong-with-indian-higher-education/story/328786.html).
64
“Indian states are struggling to lift public-school attendance”, The Economist, 11 Oct. 2018.
(https://www.economist.com/asia/2018/10/11/indian-states-are-struggling-to-lift-public-school-attendance).
65
Ibid.fees for coaching classes, a very common practice in India. Second, the training the children received in private school was better, but not much better – as evident from the last ASER data regarding rural India. In spite of the fact that these children belong to more affluent and educated social milieu, only 65% of the Standard 5 children can read Standard 2 texts in private schools and only 40% can make a simple division66. The uneven quality of private schools is largely due to the fact that, in many cases, these institutions are money-making machines set up by businessmen or politicians (who have therefore even less interest in promoting government schools) whose pedagogical skills are often limited. The rise of private education is dramatic in higher education since the era of the UPA government which believed in Private Public Partnership in this domain - like in others - for ideological as well as financial reasons67. The success of private universities and colleges is a consequence of the paucity of funds affecting the public higher education (including the shortage of faculty members) and the extension of quotas for lower castes in the name of positive discrimination68. The latter policy is resented by some people in the middle class and upper caste families that attributed the decline of public universities to this affirmative action-oriented policy too. Out of 903 Universities, 343 were private in 2017 and out of 39,050 colleges, 78% were run by the private sector69. These private colleges – which represented 67.3% of the total enrollment – ran only one single program more often than the public ones: among the 33.75% colleges – public and private - which do, 83% are private and more than half (55.1%) of these monolithic private colleges run B.ED. courses only70. It seems, however, that the number of private institutions has peaked and is going down, especially in the Business schools’ sector where the quality of the students was as bad as the quality of the course according to a report of the ASSOCHAM which criticizes these “b-schools” for focusing only “on filling up seats and do not consider the quality of students at the time of intake”71. As a result, only 20% of their students are offered a job according to the report – and people stop applying to this kind of institutions whose number is now declining. Another problem with private institutions in Higher education has to do with the fees. First, they are hardly accessible to the poor who have to fall back on public universities, even if some private institutions offer scholarships and if the Central Scheme for Interest Subsidy has made education loans interest-free for the duration of the course and for an extra year for applicants whose annual family income is under Rs 4.5 lakhs. Second, fees are so high, that students have to take loans – but they cannot reimburse them when they do not get the jobs (and the salaries) they expected. The problem is particularly acute in the domain of technical education72. Between 2013 and 2016, Indian banks have seen a 142% rise in default by students who have taken education loans73. 66 Madhav Chavan, “Something is changing...”, op. cit., p. 9 and p. 11. 67 The then HRD minister, Kapil Sibal declared once: “We will need 800 new universities and 40,000 new colleges to meet the aim of 30 per cent GER by 2020. Government alone cannot meet this aim”. 68 In 2006 Other Backward Classes were granted a 27% quota in the public universities where 15% of the places were already reserved to Dalits – ex-Untouchables – and 7% to Tribals. For more detail, see C. Jaffrelot, "La discrimination positive, nouvelle pomme de discorde entre les partis politiques, le secteur privé et le pouvoir judiciaire en Inde", Droit et cultures, n° 53, 1, 2007, pp. 45-62. 69 All India Survey on Higher Education, p. I. 70 Ibid. 71 “Only 20% students from business schools land job offers”, ASSOCHAM, 11 Dec. 2017 (http://www.assocham.org/newsdetail.php?id=6637). 72 S. Roy Chowdhury, “India’s engineering graduates have loans to pay but no jobs – so who is clearing their debt?”, Scrioll.in, 11 January 2018 (https://scroll.in/article/862623/indias-engineering-graduates-have-loans-to-pay-but-no-jobs- so-who-is-clearing-their-debt). 73 G. Mathew, “142 per cent rise in bad education loans in 3 years”, The Indian Express, 17 July 2017 (https://indianexpress.com/article/business/banking-and-finance/bad-education-loans-in-3-years-have-seen- 142-per-cent-rise-indian-banks-4753878/).
To sum up: Although education is mentioned only by passing in the electoral programs of political
parties, there is a consensus in India about the crisis affecting the country in this domain74. In 2014,
the rise to power of Narendra Modi, the new Prime Minister, brought forward a lot of expectations
in this field like in many others. As he focused on vocational training, we will review his policy in this
sector of education in particular.

74
     G. N. Devy, The Crisis Within: On Knowledge and Education in India, New Delhi, Aleph, 2017.
Source: S. Roy Chowdhury and N. Subramanian, “The Election Fix: Have BJP’s attempts to solve India’s education problems done more harm than good?”, op. cit.
Post-2014 developments 75
Education has not been a priority of Narendra Modi during his first term. Yogendra Yadav, an
academic turned-activist who enjoys a considerable prestige, recently summarized the situation in
these terms:
“Education was a low-priority for the government and received scant attention and meager budget.
The regime went out of its way to destroy whatever remained of the autonomy of the educational
institutions. Liberal spaces were curbed and even mild dissent was punished. Instead of promoting
a spirit of inquiry, political leaders put their ignorance and obscurantism on display.”76
Indeed, the Union government has not spent as much money as its predecessor on education. More
importantly, many measures have been counterproductive as Yadav points out. But two policies
have been initiated – “Skill India” and the creation of Institutes of Eminence - on which we will
concentrate in this second part.
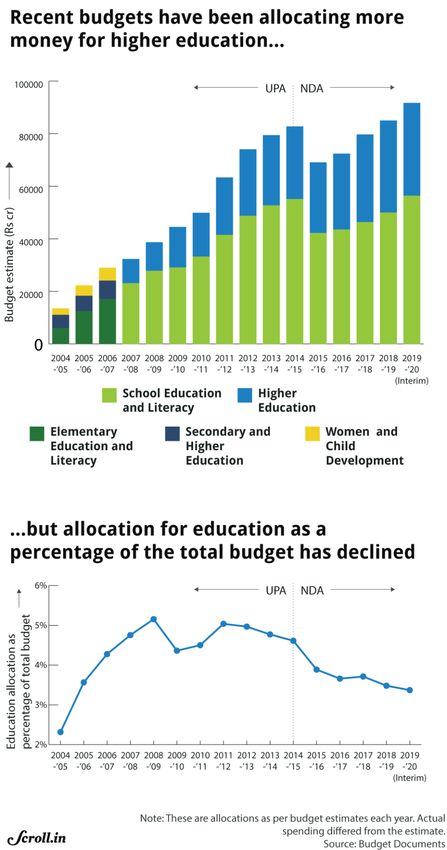
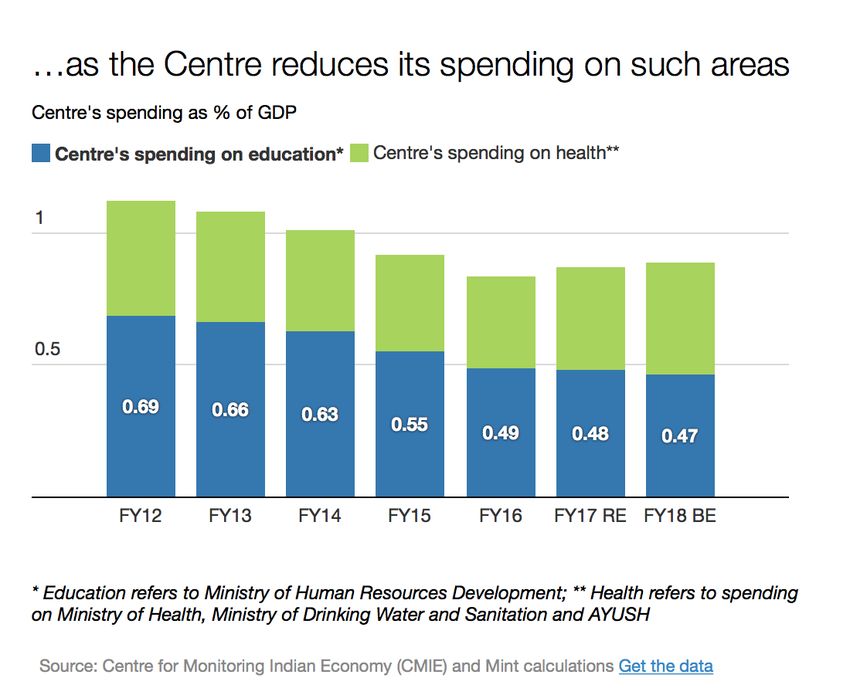
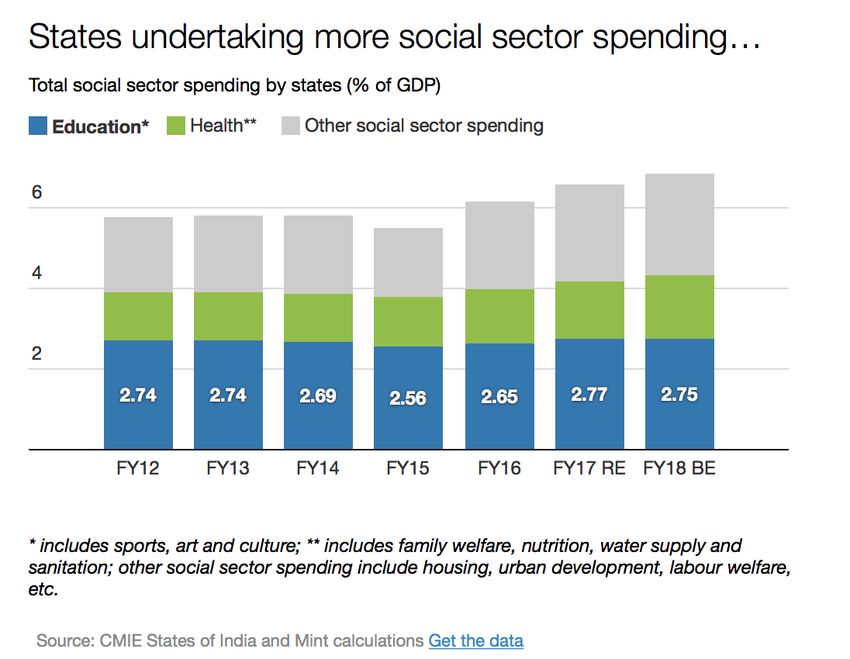
Budget allocations
The public money spent on education has marginally increased since 2015, from 3.11 percentage
points of GDP to 3.25 in 2017. But this is still very low and, in any case, this increase is not due to the
Union government, but to the states: the former reduced its budget allocation to education from
0.55 percentage point in 2015 to 0.48 in 2017, whereas the states increased their share from 2.56 to
2.7777.
75
For a comprehensive assessment of the policy of the Modi government in the domain of school education and
higher education, see, respectively, Kiran Bhatty, “ School Education: Denials and Delusions” in R. Azad, S.
Chakraborty, S. Ramani and D. Sinha (eds), A Quantum Leap Backwards? An Appraisal of the Modi Government,
Hyderabad, Orient Black Swan, 2019, pp. 114-130 and Ayesha Kidwai, “The Price of Freedom: The Modi
Government’s Report Card on Higher Education”, in ibid., pp. 131-156.
76
Yogendra Yadav, “India’s draft education policy isn’t a conservative conspiracy. But it may never take off”, The
Print, 26 June 2019 (https://theprint.in/opinion/indias-draft-education-policy-isnt-a-conservative-conspiracy-
but-it-may-never-take-off/254648/).
77
P. Bhattacharya and T. Kundu, “How are state governments spending on education, health, and irrigation?”, Mint,
26 April 2017 (https://www.livemint.com/Politics/PGqjz0bMYX3uF2rZcIFd7H/How-are-state-governments-
spending-on-education-health-and.html).Source: P. Bhattacharya and T. Kundu, “How are state governments spending on education, health, and irrigation?”, Mint, 26 April 2017 (https://www.livemint.com/Politics/PGqjz0bMYX3uF2rZcIFd7H/How-are-state-governments- spending-on-education-health-and.html). IITs, NITs, IIMs and IIITs continue to receive a disproportionate part of the money the Union government devotes to higher education. In 2015-2018, only 3% of the country’s students end up at these “premier” institutions, which enjoy the allocation of more than 50% of the central
government’s funds78, whereas the 865 other public institutions of higher education – where 97% of
the students are registered – get less money. This ratio, which offers a good illustration of Indian
higher education’s elitist character, is especially favorable to the IITs. They get 27% of the Centre’s
higher education budget though they represent 1.18% of the students. Yet, the figures regarding
the NITs are equally disproportionate (18% of the budget for 1.37% of the students), whereas
figures regarding the IIMs (3.35% of the budget for 0.12% of the students) and the IIITs (2.3% for
0.05%) reflect their fund-raising activism.
Because funding’s paucity, many issues have remained, including the problem of vacancies in
schools and higher education institutions (see graph). Thousands of posts remain unfilled in
Central Universities (and in IITs, in spite of the imbalance mentioned above).

78
  K. Sharma, “IITs, IIMs, NITs have just 3% of total students but get 50% of government funds”, The Print, 3 July
2018 ( https://theprint.in/india/governance/iits-iims-nits-have-just-3-of-total-students-but-get-50-of-
government-funds/89976/).
Source: S. Roy Chowdhury and N. Subramanian, “The Election Fix: Have BJP’s attempts to solve India’s education
problems done more harm than good?”, Scroll.in, 12 May 2019 (https://scroll.in/article/923137/the-election-fix-
have-bjps-attempts-to-solve-indias-education-problems-done-more-harm-than-good).
Allocation for primary and secondary education as % of total budget on the Indian Union
Allocation For School Education And Literacy As %
Of Total Budget, 2007-08 To 2017-18
Year
3,27% 3,29%
3,24%
3,23%
3,00 2,89%
2,81%
2,50 2,55%
2,40% 2,19%
2,35%
2,17%
% of Budget
2,00 2,05%
1,50
1,00
0,50
0,00
2007-08
2008-09
2009-10
2010-11
2011-12
2012-13
2013-14
2014-15
2015-16
2016-17
2017-18
2018-19
Source: S. Raman, “What Budget 2019 Can Do To Raise India’s Plummeting Quality Of School Education”, IndiaSpend,
25 January 2019 (https://www.indiaspend.com/what-budget-2019-can-do-to-raise-indias-plummeting-quality-
of-school-education/).
Allocation For Higher Education As Percentage Of
Total Budget, 2007-08 To 2017-18
Year
1,60 1,62
1,60 1,55
1,60 1,47
1,43
1,40 1,45 1,47
1,40 1,43
1,37
Expenditure (As % of Budget)
1,29
1,20
1,00
0,80
0,60
0,40
0,20
0,00
2007-08
2008-09
2009-10
2010-11
2011-12
2012-13
2013-14
2014-15
2015-16
2016-17
2017-18
2018-19
Source: S. Raman, “Interim Budget 2019: What govt needs to do to boost higher education bodies”, Business
Standard, 30 January 2019 (https://www.business standard.com/article/interim-budget-2019/budget-2019-
what-govt-needs-to-do-to-boost-higher-education-institutions-119013000149_1.html).The Higher Education Financing Agency (HEFA) is tasked with the creation of high-quality
infrastructure in premier educational institutions by raising funds from the market. All the centrally
funded higher educational institutions are eligible for joining as members of the HEFA. The idea is
to replace government grants with infrastructure loans for established public institutions looking to
expand. The Higher Education Financing Agency (HEFA) has been allocated Rs 21,000 million for
2019-20, a 24% decrease over the revised estimates of 2018-19. HEFA is jointly promoted by Canara
Bank and the Ministry of Human Resource Development with an authorized capital of Rs 100,000
million. The HEFA has been tasked to mobilize Rs 1,000 billion to meet the infrastructure needs of
higher educational institutions by 2022. So far, the HEFA has approved projects of higher and
medical educational institutions amounting to Rs 244,300 million.79
Measures
Instead of pursuing an explicit global policy, the Modi government, over the last five years, has
multiplied ad hoc measures.
In 2015, it introduced the Credit Guarantee Fund Scheme for Education Loans, allowing applicants
to borrow up to Rs 7.5 lakhs without collateral.
In 2017, the Ministry of Human Resource Development decided that the 110,000 teachers who
appeared to have no qualification had to be trained. Under the RTE Act, they should have completed
a diploma in elementary education by 2015 – but they had not. A special course was designed for
them80.
In January 2019, the Modi government amended the RTE Act (2009) in order to allow states to hold
examinations in Classes 5 and 8 and make children repeat those classes if they failed81. The
assumption is that fear of failing exams will encourage children to work harder, but the
educationists who were responsible for the 2009 Act claim that fear of the exams will push them out
of the class room and make the dropout rate increase again.
Two series of measures have been revealing of a more sustained and continuous efforts, those
regarding the rewriting of history textbooks and those targeting the Jawaharlal Nehru University.
Ideology in the textbooks and on the campus
The education system has always been a priority target of the Hindu nationalist movement that aims
to reshape society’s mindset according to its ideology. While it relies primarily on its political party,
the BJP, the movement also used its student union to influence the university system.
- The rewriting of textbooks – and history:
The textbooks put out by the National Council of Educational Research and Training (NCERT), which
can be used in schools affiliated with the Central Board of Secondary Education (CBSE), have been
extensively rewritten after the BJP took over power in 2014. According to the Indian Express, 1,334
79
http://www.prsindia.org/sites/default/files/budget_files/DfG%202019-
20%20Education%20for%20upload_0.pdf
80
M.P. Gohain, “11 lakh teachers to be trained by March 2019”, The Times of India, 28 August 2017
(http://timesofindia.indiatimes.com/articleshow/60251054.cms?utm_source=contentofinterest&utm_medium=te
xt&utm_campaign=cppst)
81
S. Roy Chowdhury, “Right to education: Elementary school kids will have to take more public exams – but not just
yet”, Scroll.in, 9 March 2019 (https://scroll.in/article/915882/right-to-education-elementary-school-children-
will-have-to-take-more-exams-but-not-just-yet).You can also read