The International Center for Development and Decent Work
←
→
Page content transcription
If your browser does not render page correctly, please read the page content below

ICDD working Papers | Paper No. 20 | March 2018

                                 Praveen Jha
                                 India’s Macroeconomic
                                 Policy Regime and
                                 Challenges of Employment:
                                 Some Reflections on the
                                 Manufacturing Sector

                                 The International
                                 Center for Development
                                 and Decent Work

-- ICDD WP20_Praveen_06.indd 1                                                     21.02.18 09:33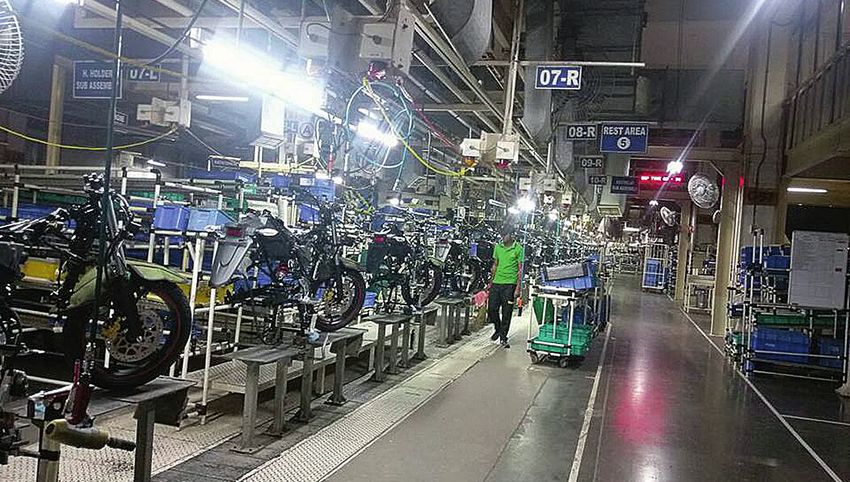
Praveen Jha is with the Centre for Economic Studies and Planning and the Centre for
Informal Sector and Labour Studies, School of Social Sciences, Jawaharlal Nehru Uni-
versity, New Delhi. He was the Ela Bhatt Visiting Professor at this International Centre
for Development and Decent Work (ICDD), University of Kassel, Germany, during the
summer term 2017. In the preparation of this paper, important inputs from Prof. Dr.
Christoph Scherrer, (Director ICDD) and Dr. Martin Wiehle (University of Kassel) are much
appreciated. The author is grateful to Dr. Satadru Sikdar, Economist at National Institute
of Public Finance and Policy, New Delhi for his valuable research assistance.
Editorial Board
Prof. Dr. Scherrer (University of Kassel)
The ICDD Working Papers are peer-reviewed.
Contact Address
Prof. Dr. Christoph Scherrer
ICDD – University of Kassel, Germany
Mailing address: Mönchebergstr. 19, D-34109 Kassel
Visitors’ address: Kleine Rosenstr. 3, D-34117 Kassel
Contact: felmeden@icdd.uni-kassel.de
Design / Layout: Nina Sangenstedt, gestaltvoll.de
ICDD Working Papers
ISBN: 978-3-7376-0440-6 (print)
ISBN: 978-3-7376-0441-3 (e-book)
DOI: http://dx.medra.org/10.19211/KUP9783737604413
© International Center for Development and Decent Work. All rights reserved.
The material in this publication may not be reproduced, stored or transmitted without
the prior permission of the copyright holder. Short extracts may be quoted, provided the
source is fully acknowledged. The views expressed in this publication are not necessarily
the ones of the ICDD or of the organization for which the author works.
First published 03 / 2018 in Kassel, Germany
Publishing House:
kassel university press GmbH
www.upress.uni-kassel.de
-- ICDD WP20_Praveen_06.indd 2 22.02.18 09:21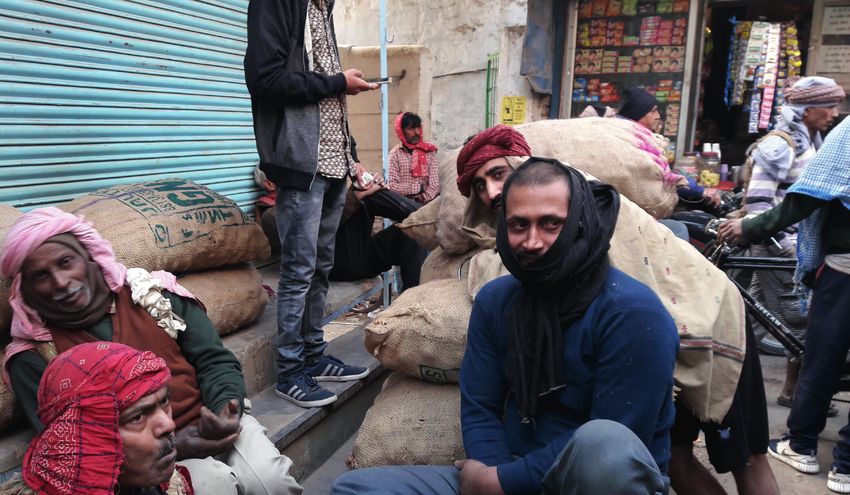
Praveen Jha
                                 India’s Macroeconomic
                                 Policy Regime and
                                 Challenges of Employment:
                                 Some Reflections on the
                                 Manufacturing Sector

-- ICDD WP20_Praveen_06.indd 1                               21.02.18 09:33
ICDD | India’s Macroeconomic Policy Regime and Challenges of Employment: Some Reflections on the Manufacturing Sector

                            Contents

                                    Abstract ............................................................................................................. 3

                             1      Introduction ..................................................................................................... 5

                             2      A Brief Overview of India’s Growth Strategy
                                    and Performance since Independence ................................................... 7

                             3      The Manufacturing Sector ........................................................................ 19

                             4      Industrial Structure and Policies ............................................................ 27

                             5      Conclusions .................................................................................................... 34

                             6      References ...................................................................................................... 36

                                    Annexure ......................................................................................................... 38

                                    ICDD working Paper Series ...................................................................... 57

                                                                                          2

-- ICDD WP20_Praveen_06.indd 2                                                                                                                                 21.02.18 09:33
ICDD | India’s Macroeconomic Policy Regime and Challenges of Employment: Some Reflections on the Manufacturing Sector
Abstract
On would hardly quibble with the view that eradication of poverty and promotion of
decent work depends on sustained and inclusive economic growth, and not simply high
rates of growth per se. This of course requires necessary intervention on several fronts, in
particular adequate macroeconomic space for national governments while being open to
equitable multilateral trading systems. Investments in physical and social infrastructure
with due emphasis on rural areas, necessary structural reforms, appropriate fiscal and
monetary policies and a climate favourable to micro, small and medium enterprises are
among the more important elements in a coordinated macroeconomic policy framework
that can take the country in the direction of sustainable and inclusive growth.
It is well-acknowledged that the period since the early 1990s has witnessed a fundamental
repositioning of the State versus the Market in the Indian economy. Essentially, the
transition has been characterized by a strong push towards a policy reform programme,
resulting in a very substantial degree of internal and external economic liberalization.
Such a paradigm has been seriously deficient in terms of a whole range of macro-eco-
nomic interventions required for a growth process which can be inclusive and promote
decent work. Sure enough, as per the official figures, the period since the early 1990s
clearly shows an acceleration in the trend growth rate compared to the 1980s, but it
has been seriously flawed in terms of labour market outcomes. Furthermore, it may not
be advisable to see the spurt in growth rates as a decisive transition to a significantly
higher growth path.
Source: ICDD
3
-- ICDD WP20_Praveen_06.indd 3 21.02.18 09:33ICDD | India’s Macroeconomic Policy Regime and Challenges of Employment: Some Reflections on the Manufacturing Sector
Among the most worrisome labour market outcomes is the fact that the pace of employ-
ment generation has been completely out of tune with the rate of growth of GDP and
there has been a significant fall in the elasticity of employment with respect to output.
In other words, the key message that gets reinforced by the employment data for almost
three decades now is that the transition to a high growth trajectory has not delivered
much on the employment front. Moreover, organized manufacturing and services appear
to contribute very little additional employment creation, and the expectation that these
would add significantly to the generation of employment opportunities once neo-liberal
policies succeeded in delivering growth has hardly materialized. On the contrary, there
has been a significant dip in the absolute count of the workers in organized segments of
the economy. Much of the small increase in employment has been in the categories of
casual and self-employment opportunities, which have extremely adverse distributional
and social welfare implications. By now it is well acknowledged that most of the impor-
tant labour market outcomes have shown little improvement during the reform period.
Furthermore, deterioration with respect to employment is also reflected in different
dimensions of quality such as growing informalization, high incidence of vulnerable
self-employment, etc. This paper draws on the relevant secondary sources, including
the major data systems, to underscore the argument that there is hardly any strategy to
realize adequate and decent employment in contemporary India.
Keywords: Employment challenges, India’s macroeconomic policy regime,
Industrial policies, Make in India.
4
-- ICDD WP20_Praveen_06.indd 4 21.02.18 09:33ICDD | India’s Macroeconomic Policy Regime and Challenges of Employment: Some Reflections on the Manufacturing Sector
1 Introduction
It hardly needs any emphasis that sustained and inclusive economic growth and not
simply high rates of growth per se is critical for eradicating poverty and promoting decent
work in general. This of course requires necessary intervention on several fronts, par-
ticularly adequate macroeconomic space for national governments while being open to
equitable multilateral trading systems. Investments in physical and social infrastructure
with due emphasis on rural areas, necessary structural reforms, appropriate fiscal and
monetary policies and a climate favourable to micro, small and medium enterprises are
among the more important elements in a coordinated macroeconomic policy framework
that can take the country in the direction of sustainable and inclusive growth, which also
addresses the issues related to decent employment. In fact, it is important to emphasise
that without addressing the concerns related to employment, sustainability of any growth
process may not be feasible and, in any case, it is not desirable.
Source: ICDD
5
-- ICDD WP20_Praveen_06.indd 5 21.02.18 09:33ICDD | India’s Macroeconomic Policy Regime and Challenges of Employment: Some Reflections on the Manufacturing Sector
It is well-acknowledged that the period since the early 1990s has witnessed a funda-
mental repositioning of the state versus the market in the Indian economy. Essentially,
the transition has been characterized by a strong push towards a neo-liberal policy
regime, resulting in a substantial degree of internal and external economic liberalization.
Although the process had begun in the second half of the 1980s, it was in July 1991 that
a rapid and sharp shift in the economic policy towards neo-liberalism was officially
enunciated, making a transition from a ‘mixed economy’ policy to a ‘market-driven’
paradigm. Such a frame work has been seriously deficient in terms of the whole range
of macroeconomic interventions required for a growth process which can be inclusive
and can promote decent work. As per the official figures, the period since the early 1990s
clearly shows an acceleration in the trend growth rate compared to the 1980s, but in
terms of labour market the outcomes have been seriously flawed. Furthermore, it may
not be advisable to see the spurt in growth rates in some years, since the early 1990s,
as a decisive transition to a significantly higher growth path.
This paper is structured as follows: Section 2 provides a brief overview of the develop-
ment strategy and economic performance of the Indian economy since independence,
with special focus on the recent years. Section 3 highlights important dimensions and
policies related to the manufacturing sector, particularly highlighting the major features
of the current non-agricultural employment scenario in India, drawing largely from the
Sixth Economic Census and some other large-scale relevant data sources. Section 4
seeks to examine the challenges before the industrial policy in India to underscore the
argument that there is hardly any strategy to realize adequate and decent employment.
Section 5 concludes the paper.
6
-- ICDD WP20_Praveen_06.indd 6 21.02.18 09:33ICDD | India’s Macroeconomic Policy Regime and Challenges of Employment: Some Reflections on the Manufacturing Sector
2 A Brief Overview of India’s Growth Strategy
and Performance since Independence
India has witnessed substantial economic transformation in the last seven decades, with
significant differences in the processes at work at the regional and sub-regional levels
(Figure 1), which are not possible to engage with in our brief remarks here. Rather, the
aim of the section is to provide a bird’s eye-view of the nature and direction of India’s
economic development, at a high level of generality, since independence, and the under-
lying policies accounting for it.
Figure 1: Annual growth rate of GDP at factor cost (2004–05 prices)
Phase I – 1st FYP Phase III – 2nd & 3rd FYP
Gross domestic product (%)
Gross domestic product (%)
12 12
10 10
8 8
6 6
4 4
2 2
0 0
-2 1951–52 1952–53 1953–54 1954–55 1955-56
1956-57
1957-58
1958-59
1959-60
1960-61
1961-62
1962-63
1963-64
1964-65
1965-66
-2
-4 -4
-6 -6
Phase III – 3rd FYP Phase IV – 4th & 5th FYP
Gross domestic product (%)
Gross domestic product (%)
10
12
10 8
8 6
6 4
4 2
2 0
0
1961–62 1962–63 1963–64 1964–65 1965–66 -2
-2
1969-70
1970-71
1971-72
1972-73
1973-74
1974-75
1975-76
1976-77
1977-78
1978-79
-4
-6
Phase V – 6th & 7th FYP
Gross domestic product (%)
10 Agriculture & allied activities Industry
8
6
4
2
0
-2
1980–81
1981–82
1982–83
1983–84
1984–85
1985–86
1986–87
1987–88
1988–89
1989–90
Source: Central Statistics Office (CSO).
7
-- ICDD WP20_Praveen_06.indd 7 21.02.18 09:33ICDD | India’s Macroeconomic Policy Regime and Challenges of Employment: Some Reflections on the Manufacturing Sector
It may be useful to organize the different phases of the relevant period in a chronological
sequence1. The underlying rationale of distinguishing between these phases, as listed
below, is rooted largely in the shifts in official perceptions regarding the overriding
economic issues and problems the country was confronted with and the associated
policy thrusts and changes.
I. The preparatory phase in planning for development
(from independence to the mid-1950s, Figure 2);
II. The phase of heavy industry-led industrialization
(from the mid-1950s to the mid-1960s);
III. The phase of pulling up agriculture (the late 1960s and 1970s);
IV. The phase of pump-priming of aggregate demand (the decade of the 1980s); and
V. The phase of economic liberalization (from July 1991 to the present). The first Five
Year Plan (FYP), which emphasized the importance of raising the level of savings
in the economy to accelerate the rate of growth, was a sort of a loose affair to put
together a set of important projects, particularly in infrastructure and agriculture,
and not an analytically rigorous formulation in terms of coordinating investment
decisions in different sectors.
Figure 2: Sectoral growth in the first phase
12
8
Growth (%)
4
0,0
1951–52 1952–53 1953–54 1954–55 1955–56
Agriculture & allied activities Industry Services
–4
1 Observers of Indian economy have, of course offered a variety of typology of phases. Obviously it is
not possible to go into a detail discussion of this issue here. The most commonly used distinction is:
the dirigiste era (1947–91) and the reform era (i.e., since the early1990s). Some of the recent quantita-
tive literature has tried to think different phases as growth episode (Sen and Kar, 2016).
8
-- ICDD WP20_Praveen_06.indd 8 21.02.18 09:33ICDD | India’s Macroeconomic Policy Regime and Challenges of Employment: Some Reflections on the Manufacturing Sector
According to most commentators, intellectually the most exciting moment in India’s
planning strategy comes with the second FYP (i.e., at the beginning of the second phase
in terms of the classification suggested at the outset). The central idea underlying this
strategy is well conveyed by recalling the following statement from the relevant plan
document: ‘If industrialisation is to be rapid enough, the country must aim at developing
basic industries and industries which make machines to make the machines needed for
further development’. Third FYP was largely a continuation of its predecessor.
Figure 3: Sectoral growth in the second phase
12
8
4
Growth (%)
0
1956–57
1957–58
1958–59
1959–60
1960–61
1961–62
1962–63
1963–64
1964–65
1965–66
–4
–8
Agriculture & allied activities Industry Services
– 12
By mid-1960s, India’s development trajectory came under substantial stress both due
to factors intrinsic to the planning process as well as external reasons (in particular two
military engagements and terrible monsoon failures of 1965 and 1966). The basic policy
wisdom emerging from the economic difficulties that the country confronted at this
juncture was to pull up its agriculture. Hence, the fourth FYP launched in 1969, adopted
a strategy popularly known as the ‘Green Revolution’ that marked a shift in development
from an emphasis on heavy industry to agricultural development strategy.
9
-- ICDD WP20_Praveen_06.indd 9 21.02.18 09:33ICDD | India’s Macroeconomic Policy Regime and Challenges of Employment: Some Reflections on the Manufacturing Sector
Figure 4: Sectoral growth in the third phase
16
13
10
7
4
Growth (%)
1
–2
1969–70
1970–71
1971–72
1972–73
1973–74
1974–75
1975–76
1976–77
1977–78
1978–79
–5
–8
– 11
Agriculture & allied activities Industry Services
– 14
This, as per the chronological classification suggested at the outset, is the beginning of the
third phase. It may be recalled that a number of economic analysts in India had been quite
critical of the earlier strategy for not taking up thorough land reforms. As it happens, the
‘agriculture-first’ strategy, which came into being with the fourth plan and also continued
to be the hallmark of the fifth FYP, did not address the issue of land reforms and simply
focused on technological modernisation and ‘betting on the strong’. A variety of support
mechanisms, including credit and price support were devised to this effect. Sure enough,
in terms of propping up the agricultural growth rate, the new strategy, in spite of its dis-
tributional limitations, delivered good results; so much that the dependence on frequent
imports of food became a thing of the past after the mid-1970s, and the government could
claim that finally India had become ‘self-sufficient’ in this regard.
Further, apart from the above-noted aspect of agriculture, it had also dawned on India’s
policymakers by the late 1960s that the ‘trickle-down’ mechanism was hardly evident as
problems of unemployment and poverty were pervasive and persistent. Consequently,
an important response from the policy establishment was to start thinking about the
strategies of so-called direct attack on poverty and unemployment, in particular from the
fifth FYP (1974–79) onwards, and gradually a variety of programmes got devised and put
in place to this end. Such programmes gained substantial significance during the sixth
(1980–85) and seventh (1985–90) FYPs and have continued to remain an important feature.
10
-- ICDD WP20_Praveen_06.indd 10 21.02.18 09:33ICDD | India’s Macroeconomic Policy Regime and Challenges of Employment: Some Reflections on the Manufacturing Sector
Figure 5: Sectoral growth in the fourth phase
16
13
10
7
4
Growth (%)
1
–2
1979–80
1980–81
1981–82
1982–83
1983–84
1984–85
1985–86
1986–87
1987–88
1988–89
1989–90
–5
–8
– 11
Agriculture & allied activities Industry Services
– 14
Another notable challenge confronting India’s policymakers since the mid-1960s was
a significant deceleration in industrial development and overall economic growth rate.
Apart from some of the major policy decisions around agriculture as well as poverty
alleviation, which, of course, indirectly impacted the industrial and overall growth rate,
a significant policy feature from the early 1980s was that of pump-priming the aggregate
demand. In terms of the classification suggested at the outset, this made up the fourth
phase. However, this strategy ran into serious difficulty soon, due to mounting public
debt (both internal and external). Further, the situation was exacerbated due to major
changes in the international geo-political context, particularly during the Gulf War of
1990–91. One of the consequences of the changes in domestic as well as international
conjuncture for India was a crisis of foreign currency reserves, which was one of the
compelling reasons for the country to seek help from World Bank and IMF.
As is well known, help from the Bretton Woods Institutions came with conditionality
and thus, compared to the preceding four decades, India embarked on quite a different
policy trajectory in its economic journey since July 1991. The period since then, that of
so-called economic reforms / liberalization, has been designated as the fifth phase. It is
worth emphasizing here that the balance of payments crisis of 1991 was an important
input, but certainly by no means the only one in effecting a sharp break from the earlier
policy regime. By the late 1960s, a number of economists had already started questioning
India’s overall development strategy, particularly the wisdom of a state-led development
paradigm, as adopted after independence. For instance, the critiques were claiming that
the idea of autonomous development was a recipe for backwardness; the public sector,
instead of being the flagship of rapid growth, is a drag on society´s resources, and so on.
11
-- ICDD WP20_Praveen_06.indd 11 21.02.18 09:33ICDD | India’s Macroeconomic Policy Regime and Challenges of Employment: Some Reflections on the Manufacturing Sector
Basically the change in India’s macroeconomic strategy since the beginning of the fifth
phase was premised on the significant play of market forces in different product and
factor markets, including financial markets, coupled with a decreasing role of the state,
particularly as producer and promoter but also as regulator of the economy. Without
going into the details here, we may note that the policy changes since July 1991 in case
of the Indian economy are enough to view it as a case of transition from the state-led
or dirigiste development paradigm, which characterized the earlier four decades to a
liberalization paradigm2.
Leaving aside the perspectives of the neo-liberal, liberal or the left, which evoked intense
debate among economists working on India, there has been little doubt that the outright
condemnation of the earlier strategy by the neo-liberals had little merit. The achieve-
ments of the earlier strategy, although fell short of expectations, cannot be dismissed
completely. On the whole, the performance of the Indian economy during the dirigiste
and the neo-liberal era continues to be a subject of intense debate 3, especially with
respect to adequate and sustainable livelihood options for a large section of the popu-
lation. In my assessment a central feature of the essential picture that emerges is one of
overall worsening in employment and conditions of work even though there has been a
significant acceleration in output growth in the non-agricultural sector. As regards the
agricultural sector4, its performance has tended to worsen considerably not only with
respect to employment but also output growth. Fundamentally, there has been a change
in the pattern of growth where the non-agricultural sector (essentially the services) has
shown substantial acceleration in output per worker compared to the agricultural sector,
and thus the gap between the two has tended to increase very substantially. Furthermore,
employment content of growth process has gone down significantly during the reform
era. In particular, rural India which houses more than two-thirds of the working population
of our country has been among the worst hit during the period of reforms. According to
2 As already said, it is not possible to engage with the debates and issues pertaining to the dramatic
shift in the country’s macroeconomic strategy in the early 1990s. There is a very large literature on
this subject; some of the important contributions include Patnaik (1995), Patnaik and Chandrasekhar
(1995), Bhagwati (1993), Bhagwati and Srinivasan (2002), Drèze and Sen (1995).
3 Some of the important contributions include: contributions in Byres (ed.) (1994, 2000), C
handrasekhar
and Ghosh (2002, 2007a, 2014, 2015), Drèze and Sen (2013), and Patnaik (2006), Sen (2003), Sen and
Himanshu (2004), Bhagwati, (1993, 2007), Bhagwati and Panagariya (2013a. & 2013b.), Bardhan (1998),
Sen and Kar (2014, 2016).
4 It is symptomatic of the employment crisis in the country that even for relatively lower ranked
government job vacancy applications pour in thousands; according to a recent report in The Hindu
(Ali Mohammad, ‘23 lakh apply for 268 peon posts in Uttar Pradesh’,, The Hindu, 17th September, 2015
“Over 2.3 million candidates, including 222 thousands engineers and 255 Ph.D. holders have applied
for 368 posts of peon in the State Secretariat, Uttar Pradesh”).
12
-- ICDD WP20_Praveen_06.indd 12 21.02.18 09:33ICDD | India’s Macroeconomic Policy Regime and Challenges of Employment: Some Reflections on the Manufacturing Sector
the Situation Assessment Survey by National Sample Survey in the 70 th Round (2013), the
average net receipt from cultivation per household was Rs 3081 only. If we include other
sources of income for agricultural households, such as farming of animals, wages and
non-farm business, the average monthly income of agriculture households was Rs 6426.
Figure 6: Sectoral growth rates (at 2004–05 prices) since the early 1990s
14.0
10.5
Growth (%)
7.0
3.5
0.0
2008–09
2009–10
2010–11
2011–12
2012–13
1992–93
1993–94
1994–95
1995–96
1996–97
1997–98
1998–99
1999–00
2000–01
2001–02
2002–03
2003–04
2004–05
2005–06
2006–07
2007–08
– 3.5
– 7.0
Agriculture & allied activities Industry Services
Linear (Agriculture & allied activities) Linear (Industry) Linear (Services)
In terms of the FYP chronology since the beginning of the new macroeconomic policy
regime, India has completed five FYPs, i.e., 8 th (1992–97), 9 th (1997–2002), 10 th (2002–07),
11th (2007–2012), and the 12 th FYP (2012–17)5. The experience of approximately the last
two and half decades has been quite mixed; for instance, as already mentioned at the
outset, a sustained high GDP growth rate for much of this period is well acknowledged
but in terms of the structure of growth as well as its distribution, employment outcomes
etc., there have been serious concerns. In fact, these concerns have given us an insight
into the basic professed philosophy of the last two plans (11th and 12 th), namely, ‘inclusive
growth’ and ‘faster, more inclusive and sustainable growth’. These two plans aimed to
spread the benefit of growth process ‘to the mass of the population’. Further, the 12 th
FYP aimed to shift substantial population from agricultural to higher productivity non-ag-
ricultural occupations and to accelerate the growth rate of the manufacturing sector.
It also claimed to sharpen the thrust in terms of redefining the role and responsibility of
5 The NDA Government after coming to power decided to do away with the Planning Commission and
has replaced it with NITI Aayog; perhaps FYPs have been permanently removed.
13
-- ICDD WP20_Praveen_06.indd 13 21.02.18 09:33ICDD | India’s Macroeconomic Policy Regime and Challenges of Employment: Some Reflections on the Manufacturing Sector
state for delivering social services, like health and education and essential services and
where private sector is able to deliver these services, it advocated for reducing the role
of the state further. As the documents put it: ‘Thus, while the state should withdraw from
areas where the private sector is able to deliver well, this does not amount to advocating
a reduction in the role of the state: what is needed is a restructuring in the role of the
state, reducing its role in some areas but increasing it in others’ (12 th FYP, 1: xii).
The sectoral composition of the employment and value added has witnessed a major
change in the last three decades. Since the employment intensity in the non-agricultural
sectors is lower than that of agriculture, employment diversification of the economy has
not kept pace with the diversification of the economy in terms of value added. Conse-
quently, although the share of agriculture in GDP went down significantly from 38 % to
16 % over the period (1981–2012), the structure of the workforce was still dominated by
agriculture (68 % in 1983 to almost 50 % in 2011–12).
It is also worthwhile to mention here that the current federal Indian government has
changed the methodology of calculating GDP, with the 2011–12 prices as the base, and has
adopted a ‘System of National Accounts’ (SNA), 2008 methodology (UNSTAT, 2009) with a
new classification system. Also, the data are now representing Gross Value Added (GVA)
in each sector instead of gross output. Share of total GVA has changed across different
sectors with the adoption of a new methodology. New series has increased the coverage
of corporate sector, both in manufacturing and service sector, and has also expanded
the coverage of unincorporated manufacturing and service enterprises. Furthermore, this
includes service tax as an indicator of growth in respective services6. However, the new
methodology has been criticized by many economists from different perspectives (Anant,
2015, 2016; Barman, 2016; Nagaraj, 2015, 2016, 2017; Dev, 2017). Even Chief Economic
Advisor, Arvind Subramanian, on the event of releasing the Economic Survey 2014–15
(Karnik, 2015), mentioned the numbers of GDP growth by new methodology were ‘puz-
zling’, ‘baffling’, ‘mystifying’, and ‘confusing’. Some economists have cited the problem
of comparison among previous series with new series. Some have criticized the new data
series. For instance, data series of the Ministry of Corporate Affairs (MCA)-21 have many
unfilled observations. Also, the database of quasi government may overestimate the GDP
growth figure for some of the sectors. To add more fuel to the fire, there are debates on
ground realities relating to credit growth, volume growth, private investment, exports, etc.
6 For further details in the changes in methodology one can see ‘Changes in Methodology and Data
Sources in the New Series of National Accounts base year 2011–12, MOSPI, June 2015’.
14
-- ICDD WP20_Praveen_06.indd 14 21.02.18 09:33ICDD | India’s Macroeconomic Policy Regime and Challenges of Employment: Some Reflections on the Manufacturing Sector
Figure 7: Sectoral growth rates (at 2011–12 prices) since 2011–12
12.0
10.0
8.0
Growth (%)
6.0
4.0
2.0
0.0
2011–12 to 2012–13 2012–13 to 2013–14 2013–14 to 2014–15 2014–15 to 2015–16 2015–16 to 2016–17
– 2.0
Agriculture & allied activities Industry Services
Even if we choose to ignore, the contentious issues regarding the changed methodology,
the point worth highlighting is that there is a significant deceleration during the last couple
of years, even with the new series (of sector-wise GVA ). In fact, the industry and services
sectors have logged slowing down of their growth rates since 2014–15. Although there have
been frequent loud claims regarding pro-growth measures such as ‘Make in India’, ‘Digital
India’, ‘Smart City Mission’, etc., by the current government led by Prime Minister Narendra
Modi, most of these are on the same track as the policies of previous Union Progressive
Alliance (UPA) Government between 2004–14; at best, the current government can claim
further acceleration only in few such initiatives. The big ticket new interventions by the
current government appeared to be a mixed bag. For instance, though the 2016 insolvency
and bankruptcy code which seeks to address the problem of bad loans and Non-Performing
Assets (NPAs) may appear to be promising, its implementation, however, is likely to be
a long drawn and complex process. On the other hand there are highly controversial
measures such as demonetization and the rolling out of the Goods and Services Tax (GST).
15
-- ICDD WP20_Praveen_06.indd 15 21.02.18 09:33ICDD | India’s Macroeconomic Policy Regime and Challenges of Employment: Some Reflections on the Manufacturing Sector
Narendra Modi, issued the fiat through a televised address to the nation on 8 November
2016 at 8:15 p.m., that the currency notes of Rs 500 and Rs 1000 will cease to be legal
tenders, thus resulting in summary de-recognition of over 86 % of the currency notes
under circulation. The basic claim of the government was that it would prove to be a
masterstroke in combating corruption and black money, as also in dealing deathblows to
the presumed, large stock of counterfeit currency supporting ‘anti-national’ and ‘terrorist’
activities. Cheerleaders of the ruling dispensation celebrated the announcement as the
most effective policy intervention by any government since independence.
Of course, full throated claims made by the Prime Minister in his demonetization broad-
cast were greeted with considerable skepticism by sections of the media and several
economists, including many who occupied high offices, either in the earlier or current
government, such as ex-governor of India’s central bank (Reserve Bank of India) Raghuram
Rajan and former Chief Economic Advisor during the UPA era, Kaushik Basu. Many other
eminent economists and policymakers were completely taken aback by this announcement
and argued that this policy misadventure would result in massive dislocation of the Indian
economy. They expressed their apprehension that it would inflict huge misery and pain on
substantial sections of the population without delivering any of the intended objectives.
It did not take long for the horrendous adverse impacts to start unfolding. As with most
policy misadventures, the government and its spokespersons kept shifting the goal posts,
as regards what were supposed to be the ‘intended benefits’. By now there is a substantial
literature on the demonetization experiment – the goals, intended objectives and actual
outcomes – from different quarters and there is near consensus, explicit or implicit, that
this has been an unmitigated disaster (Ghosh, Chandrasekhar and Patnaik 2017).
As regards the GST, this has been for the making for a long time. The ancestry of GST in
India’s official discourses can be traced to the VAT proposal by Jha committee (1978) and
followed by several others. In recent times, a consolidated national GST was proposed by
former Finance Minister P. Chidambaram’s budget of 2006–07. The current government
finally decided to roll it out from 01 July 2017, in the hope that it would boost investment
and medium-term economic growth. Although it is too early to assess the impacts of
the GST on economy as a whole, the first couple of months have been quite chaotic
with significant adverse impact on growth rate as well several sectors of the economy.
16
-- ICDD WP20_Praveen_06.indd 16 21.02.18 09:33ICDD | India’s Macroeconomic Policy Regime and Challenges of Employment: Some Reflections on the Manufacturing Sector
Coming back to the standard indicator of economic performance, viz., the rate of growth
of GDP, it is quite clear there has been a steady decline in the last six quarters: from 9.2 %
at the end of the quarter ending March 2016to 7.9 %, 7.5 %, 7.0 %, 6.1 %, and now 5.7 %
at the end of the June quarter in the current fiscal. Recent growth performance of the
Indian economy has received flak from the whole spectrum of economists and policy
think tanks including many staunch advocates of neo-liberal reforms, as also prominent
leaders and economist within the ruling party 7. Former finance minister (during the first
National Democratic Alliance (NDA) government) and prominent member of current
ruling party, Yashwant Sinha has expressed his disappointment in a scathing piece, and
argues that the current government lacks any coherent economic strategy 8.
Source: Ashwin – Fotolia.com
7 For some recent commentaries, readers may look at pieces by economists such as Ghosh and
Chandrasekhar in Frontline and Business Line, Ranade (2017), Dubey (2017).
8 ‘Private investment has shrunk as never before in two decades, industrial production has all but col-
lapsed, agriculture is in distress, construction industry, a big employer of the work force, is in the dol-
drums, the rest of the service sector is also in the slow lane, exports have dwindled, sector after sector
of the economy is in distress, demonetisation has proved to be an unmitigated economic disaster, a
badly conceived and poorly implemented GST has played havoc with businesses and sunk many of
them and countless millions have lost their jobs with hardly any new opportunities coming the way of
the new entrants to the labour market. For quarter after quarter, the growth rate of the economy has
been declining until it reached the low of 5.7 % in the first quarter of the current fiscal, the lowest in
three years. The spokespersons of the government say that demonetisation is not responsible for this
deceleration. They are right. The deceleration had started much earlier. Demonetisation only added
fuel to fire’ (Sinha, ‘I Need To Speak Up Now’, Indian Express, 27 September 2017).
17
-- ICDD WP20_Praveen_06.indd 17 21.02.18 09:33ICDD | India’s Macroeconomic Policy Regime and Challenges of Employment: Some Reflections on the Manufacturing Sector
Apart from the poor performance in terms of the GDP growth rate, there are serious
concerns related to almost every macro indicator, as is evident even from most official
reports in the last few months. For reasons of space, it is not possible to examine many
of these challenges in a satisfactory manner here. As suggested at the outset the next
section of the paper focuses on the manufacturing sector, especially the challenge of
employment generation. It is estimated that on an average 10–12 million new job seekers
enter the labour market every year which obviously requires a massive upscaling of job
generation; the trends regarding employment generation since the early 1990s have been
seriously inadequate, to say the least, to meet the requisite demand for jobs. As regards
generation of decent job the story is even more dismal. The latest estimates available
from the Labour Bureau paint an extremely depressing picture with respect to the pace of
job creation in the formal sector. Apart from being nowhere near what would be required
to facilitate near full employment, there has been a staggering decline by about 90 % as
new jobs have come down from about 1.1 million in 2010 to 0.15 million in 20169.
9 Recent report suggests significant job losses across sectors. As per a recent report in The Indian
Express, 67 textile units closed down recently impacting over 17,600 workers; Larsen & Turbo has
laid off about 14,000 employees during the first two quarters of the fiscal year ending on 31 March
2017. Among the ICT majors, Tata Consultancy Services, Infosys and Tech Mahindra have downsized
their workforce by 1414, 1811 and 1713, respectively. As the news report puts it: ‘Textile to capital
goods, banking to I-T, start-ups to energy, the economy’s downward spiral is leaving a trail of job
losses across both old and new economy sectors. In the near absence of consolidated employment
numbers, disaggregated data collated from across these sectors by The Indian Express points to
spreading employment distress in a market where fresh hiring opportunities are increasingly limited’
(Saini Anil (2017), ‘From textiles to I-T: Wave of job losses hits new and old economy’, The Indian
Express, Delhi Edition, 3 October 2017)
18
-- ICDD WP20_Praveen_06.indd 18 21.02.18 09:33ICDD | India’s Macroeconomic Policy Regime and Challenges of Employment: Some Reflections on the Manufacturing Sector
3 The Manufacturing Sector
The GDP share of the manufacturing sector has been almost stagnant, around 15 %–16 %
since the early 1990s to 2012–13, and the same is true of its share of employment, which
increased marginally from 11.2 % in 1983 to 12.2 % in 2004–05 and 12.6 % in 2011–12. In
other words, the shift away from agriculture has not led to a significant increase in the
share of employment in the manufacturing sector. On the other hand, the GDP share
of trade, hotels and transport, storage, and communication increased by almost 10 %
points between 1981 and 2013. In terms of growth rate also, these activities, along with
financing, real estate and business services, increased their share rapidly (Table 1).
Further, dividing the overall manufacturing sector into registered and unregistered man-
ufacturing industries, the former which is, in general, characterized by relatively high
earnings and better working environment, appears to have played an insignificant role
in overall occupational transformation of the labour force in India for over last three or
more decades. As per the Annual Survey of Industries (ASI) and Directorate General of
Employment and Training (DGET), as reported in the Handbook of Statistics on Indian
Economy by the RBI, which provide figures on registered manufacturing sector employ-
ment, we get slightly different trends. The figures given by ASI show that registered
manufacturing employment rose between the mid-1980s and mid-1990s and declined
subsequently for a few years touching a low in 2002–03, before picking up again. There
was some increase between early 1980s and the present, but figures available for the
recent couple of years show a flattening gain (Figure 8).
Figure 8: ASI estimates of registered manufacturing employment
14
Number of workers Total person engaged
12
Number (mio)
10
8
6
4
2
0
1981–82
1982–83
1983–84
1984–85
1985–86
1986–87
1987–88
1988–89
1989–90
1990–91
1991–92
1992–93
1993–94
1994–95
1995–96
1996–97
1997–98
2002–03
2003–04
2004–05
2005–06
2006–07
2007–08
2008–09
2009–10
2010–11
2011–12
2012–13
2013–14
1998–99
1999–00
2000–01
2001–02
Source: Annual Survey of Industries (AIS), Central Statistical Organization (CSO), 2013–14
19
-- ICDD WP20_Praveen_06.indd 19 21.02.18 09:33ICDD | India’s Macroeconomic Policy Regime and Challenges of Employment: Some Reflections on the Manufacturing Sector
As outlined in Figure 9 the change relating to organized manufacturing sector using the
DGET data reported in RBI’s Handbook of Statistics on Indian Economy is indicated. As
is clear, since the early 1990s, there has been a small decline in the number employed
in the public sector along with a small increase of the private sector: on the whole there
is little to cheer about.
Figure 9: Employment in organized sector manufacturing
50
Number of persons (mio)
40
30
20
10
0
1990–91
1991–92
1994–95
1997–98
2011–12
1992–93
1995–96
1998–99
2002–03
2003–04
2004–05
2005–06
2006–07
2008–09
2007–08
2009–10
2010–11
1993–94
1996–97
1999–00
2000–01
2001–02
Private Sector (end-March) Public Sector (end-March) Public & Private Sector (end-March)
Source: Handbook of Statistics on Indian Economy, 2016–17
As regards the overall regular employment and the National Sample Survey Organisation
(NSS), the last three decades have been a period of tremendous stress (Table 1). For rural
male, the proportion of regular employed was about 10.3 % in 1987, which declined to
8.5 % in 2009–10, and again improved to 10 % in 2011–12. Also, in urban areas, the share
of regular employed in male category, declined from 43.7 % in 1987–88 to 40.6 % in
2004–05 and again improved and reached to 43.4 % in 2011–12. The increase in regular
employment during the period from 1983 to 2011–12 for both rural and urban females was
too small to raise the share of those regularly employed in total employment (Table 2).
We may also note that the annual increment in regular employment was about 2 million
during 1993 to 2005, which declined to approx. 1 million during 2005 to 2010. Although,
the data for the 61st and 68 th NSS rounds show that the rate of regular employment
generation in the private organized sector has picked up recently, it is also clear that
this was more than offset by decline in the share of regular employment in rest of the
economy. In fact, it is quite striking that over 80 % of all new jobs created in the recent
years have been of casual nature, with construction alone accounting for a substantial
share (Jha, 2016; Chandrasekhar and Ghosh, 2007b, 2015).
20
-- ICDD WP20_Praveen_06.indd 20 21.02.18 09:33ICDD | India’s Macroeconomic Policy Regime and Challenges of Employment: Some Reflections on the Manufacturing Sector
In other words, in spite of the high growth rate in the Indian economy the process of infor-
malization and casualization in the labour market has been on the rise during the last three
decades. A substantial segment of workers who are unable to find even casual employment
often remain ‘self-employed’, which, to a large extent, is same as being underemployed
or disguisedly unemployed. Further, it is quite clear that the process of casualization and
contractual employment has gained momentum in the organized sectors (Bhalla, 2005;
Dutta, 2005; Neethi, 2008; Mathur and Mishra, 2007; Srivastava 2012; Ghosh 2015, Mitra
2015, among others). As regards sectoral distribution, the proportion of informal workers
to total workers has been the highest in trade, followed by manufacturing, transport and
real estate, and business services. In terms of composition of employment, manufacturing
and trade constitute around 70 –75 % of the total informal sector employment (Table 4). In
urban areas, the share of trade exceeds the share of manufacturing. Hence, the dominance
of the tertiary activities in the informal sector, which was observed almost three decades
ago, does not appear to have undergone any major change.
As per the latest (Sixth) Economic Census (EC) conducted from January 2013 to April
2014, there are 58.5 million establishments (private and public) in the country. It may
be noted that the said EC enumerated all establishments engaged in various activities
excluding crop production, plantation, public administration, defence and compulsory
social security. Thus, it is a good source to draw the sketch of non-agricultural sector, both
for output and employment. As per this source, of the total enumerated establishments,
35.0 million (59.9 %) were in rural area and the remaining 23.5 million (40.1 %) in the
urban sector. Furthermore, 20.5 % of the establishments operate from outside household
without fixed structure and these obviously constitute extremely vulnerable entities.
Table 6 provides a profile of the distribution of persons employed across different kinds
of ownerships and establishments; almost 74 % are employed in private proprietary
establishments and it is worth noting that around 45 % of all private proprietary estab-
lishments do not hire even one worker.
It is also interesting to note, that only five states, namely, Uttar Pradesh, Maharashtra,
West Bengal, Tamil Nadu, and Andhra Pradesh together account for approximately 48 %
of all establishments in the country. However, as already hinted, the overwhelming pro-
portion of establishments does not generate any paid employment. For instance, 80 % of
establishment in West Bengal are without any hired worker, but account for almost US$
36.3 employment among the surveyed establishments in the state. Similarly, in Uttar
Pradesh and Maharashtra 75.5 and 71.9 % establishments are without hired worker and
account for 37.6 and 47.2 % employment, respectively (Table 7).
21
-- ICDD WP20_Praveen_06.indd 21 21.02.18 09:33ICDD | India’s Macroeconomic Policy Regime and Challenges of Employment: Some Reflections on the Manufacturing Sector
The comparable information on non-agricultural establishments, taking both organiszed
and unorganized sectors together, can also be collated from the ASI and the National
Sample Survey Organisation (NSSO). As is well known, for Indian economy, the ASI is the
most important source of industrial statistics for the organized10 manufacturing sector,
whereas the NSSO plays a similar role for the unorganized sector as it provides the req-
uisite information on unincorporated non-agricultural enterprises and various indicators
of economic and operational characteristics of enterprises in manufacturing, trade and
other service sectors (excluding construction) at the national and state level. As per the
recent relevant data from the ASI and NSSO (Table 8), the total number of non-agricultural
establishments in India was 57,832,182 of which the organized component accounted
for 158,877 only or barely 0.28 %. If we take into account only the manufacturing sector,
the share of the organized component was just about 0.85 %. These are indeed startling
numbers as regards to the structure of Indian industry / broader economy. It is true that in
terms of the contribution to the GDP, the organized sector punches hugely above its weight
with respect to its numerical share, as indeed in guiding the economic policy destiny of the
country, especially at the current juncture. As may be seen from Table 9, the contribution
of the organized and unorganized non-agriculture GVA in Indian economy is almost evenly
matched, although the distribution of specific subsectors varies dramatically.
10 A neat separation between organized (formal) and unorganized (informal) is conceptually quite
a slippery exercise as is often acknowledged in literature. In India, the conventional basis of this
distinction is the definition used in the Factories Act of 1948, as per which an establishment with 10
workers or more and using power, or 20 workers or more without power, is categorized as organized.
It is compulsory for economic units in the organized sector to have registration with the relevant
authorities. Hence, sometimes ‘organized’ and ‘registered’ are used interchangeably. However, it may
be noted that not all registered units are organized.
22
-- ICDD WP20_Praveen_06.indd 22 21.02.18 09:33ICDD | India’s Macroeconomic Policy Regime and Challenges of Employment: Some Reflections on the Manufacturing Sector
Tables 10a–c provide a profile of the organized sector in India (based on the ASI data)
since the late 1980s onwards with respect to the distribution of factories, output and
employment within the sector. As should be evident, there have been some notable
changes across a few subsectors (both within ‘traditional’ as well as modern activities) in
terms of their contributions. What may well be a matter of serious concern is the slippage
with respect to presumably the cutting edge manufacturing segments such as ‘computer,
electronic and optical products’ and ‘pharmaceuticals, medicinal, chemical and botanical
products’, whose shares in number of factories, output as well as employment have
plummeted dramatically. We may also recall here that generation of employment in the
organized sector has been a major challenge, particularly in the recent years; employment
elasticity of output for the economy as a whole and in particular for the organized sector,
in fact, has come under considerable pressure during the period of economic reforms11.
As evident from Table 11, there is hardly any increase in overall employment in the
organized sector for the country as a whole in the recent years, which has increased
marginally from 27.0 to 29.6 million between 2006 to 2012; segments in the organized
private economy which have shown incremental increase include ‘finance, insurance,
real estate etc.’ (1.26 million), ‘manufacturing’ (0.98 million), ‘wholesale and retail trade’
(0.21 million), and ‘transport, storage and communications’ (0.12 million). In the public
organized sector, ‘community, social and personal services’ (0.54 million) and ‘transport,
storage and communications’ (0.19 million) account for most of the decline. However, if
we look at the relevant numbers between mid-1980s and the recent years, it is a story of
almost stagnation in the overall organized employment in the country.
11 This comes out clearly from NSS 1983 and 2011–12. The same is also confirmed by assessments done
by other well-known institutions. For instance, as per the RBI’s report on ‘Estimating Employment
Elasticity’ (2014), UNDP Population Estimates and the HDFC Bank (2016) estimates, during the period
1977–78 to 1999–2000, employment elasticity was 0.39, which declined to 0.23 between 1999–2000 to
2011–2012 and further to a measly 0.15 between 2012–13 to 2015–16. It is important to highlight that
this is happening at a juncture when addition to working age population is 12 million per annum.
23
-- ICDD WP20_Praveen_06.indd 23 21.02.18 09:33ICDD | India’s Macroeconomic Policy Regime and Challenges of Employment: Some Reflections on the Manufacturing Sector
As regards the unincorporated non-agricultural enterprises (excluding construction),
Table 12, taking both rural and urban India, almost 60 % of these operate with only
one worker and another 26 % with two workers. Obviously, this sums up not only the
overwhelming smallness of the Indian non-agricultural sector but also its vulnerability.
Tables 13a–d based on the 67th round of the NSS, provide a profile of the distribution of
enterprises by broad activity category (manufacturing, trade and other services), as well
as the distribution of workers in rural and urban India. As is evident from these tables,
manufacturing is just about 30 % of the total number of enterprises as well as the total
number of workers in these activities. Furthermore, the distribution of unincorporated
enterprises, in the aggregate, across rural and urban India is almost even, although the
rural areas account for a much larger share of the Own Account Enterprises (OAEs). Using
the same database, Tables 3 and 4 provide information on formal and informal segments,
both by broad activities as well as number of enterprises and workers. For the country
as a whole, over 98 % of the enterprises and close to 90 % of the workers constitute the
informal component. Furthermore, if we look at the distribution of the formal, as well as
the informal in unincorporated enterprises, manufacturing accounts for just about one-
third of both the estimated number of enterprises as well as the workers. We may also
note here that in the recent years there has been a significant acceleration in the growth
of informal employment even in the formal sector (Table 5). In 1999–2000, the share of
informal workers in the formal sectors was already 37.8 % which jumped to 54.4 % in
2011–12 (NSS 68 th round). Thus, as per the latest count of workers in the country, which
stood at 484.7 million in 2011–12, 447.2 million were informal workers.
As mentioned earlier, the share of the manufacturing sector in the country’s GDP has been
stagnant at about 15–16 % for almost 25 years now. Furthermore, a disturbing feature of
industrial development, particularly organized manufacturing, in the country has been
regional unevenness and concentration in a handful of states. Apart from Maharashtra
and Gujarat accounting for almost 37 % of the organized manufacturing, a small number
of states (Andhra Pradesh Haryana, Punjab, Karnataka, and Tamil Nadu) have tended to
increase their share in the overall manufacturing value added, whereas most other states
have tended to lose out over time. As per the ASI data, eastern states such as West Bengal,
Bihar, and Orissa account for a measly share of the country’s manufacturing output.
Important point to note is that there were some checks and balances on regional inequality
during the dirigiste era, although it was no great success. However, the policy of regional
dispersal of industries, which was followed up to the 1980s, had resulted in at least a few
enclaves in most states (even though a couple of better-off states, such as Maharashtra
and Gujarat had benefited disproportionately). The process of regional spread has clearly
been reversed since the early 1990s with the dismantling of the regulatory regime.
24
-- ICDD WP20_Praveen_06.indd 24 21.02.18 09:33You can also read