AID FOR TRADE AND VALUE CHAINS
  IN TRANSPORT AND LOGISTICS
←
→
Page content transcription
If your browser does not render page correctly, please read the page content below
AID FOR TRADE AND VALUE CHAINS IN TRANSPORT AND LOGISTICS
Aid for Trade and Value Chains in
     Transport and Logistics

ACKNOWLEDGEMENTS – 3

                                                   Acknowledgements

             This report was written by Ben Shepherd. The author is grateful to Frans Lammersen
         and Michael Roberts for their many inputs into this paper. In addition, the following
         people provided helpful information and comments: Jean Acri, Susanne Aigner, Jean-
         François Arvis, Heike Barczyk, Deborah Barker, Janaina Borges, Milena Budimirovic,
         Olivier Cattaneo, Paulo Cravero, Matthias Helble, William Hynes, Gerard McLinden,
         Evdokia Moise, Aime Murigande, Se Eun Park, Shishir Priyadarshi, Conor Trodden,
         Matthew Wilson, and Trudy Witbreuk.

AID FOR TRADE AND VALUE CHAINS IN TRANSPORT AND LOGISTICS © OECD/WTO 2013
TABLE OF CONTENTS – 5
Table of contents
Acknowledgements ................................................................................................................................ 3
Acronyms ................................................................................................................................................ 9
Executive Summary ............................................................................................................................. 11
1. Why do transport and logistics matter for development?............................................................ 15
Indirect impacts on development outcomes ....................................................................................... 16
Direct impacts on development outcomes.......................................................................................... 18
2. Measuring delays and their impacts: The toolkit ......................................................................... 23
3. Emerging trends: Where and why is progress being made?........................................................ 27
Overall performance ........................................................................................................................... 27
Customs and other border procedures ................................................................................................ 30
Transport and ICT infrastructure........................................................................................................ 32
Private services and service providers................................................................................................ 34
Logistics regulation and the business environment ............................................................................ 36
Governance......................................................................................................................................... 38
Red tape .............................................................................................................................................. 41
Summary ............................................................................................................................................ 43
4. Ensuring alignment and maximizing impact of aid for trade ...................................................... 47
Beneficiary priorities .......................................................................................................................... 47
Aid for transport and logistics ............................................................................................................ 50
Partners, programs, and projects ........................................................................................................ 53
5. Conclusions ....................................................................................................................................... 59
References ............................................................................................................................................. 61
Annex A Indicators of delay - An overview ...................................................................................... 65
Tables
Table 1 Factors listed as the ‘most important’ or ‘important’ impacts of trade
on the economy – particularly through GVCs....................................................................... 15
Table 2 Customs and other border procedure factors identified by the private sector ....................... 30
Table 3 Transport and ICT infrastructure factors identified by the private sector ............................. 33
Table 4 Factors listed as national supply-side constraints by the private sector in
entering, establishing, or moving up GVCs .......................................................................... 34
Table 5 Logistics regulation and the business environment factors identified by
the private sector ................................................................................................................... 37
Table 6 Governance factors identified by the private sector .............................................................. 38
AID FOR TRADE AND VALUE CHAINS IN TRANSPORT AND LOGISTICS © OECD/WTO 20136 – TABLE OF CONTENTS
Table 7 Type of aid-for-trade support listed by the private sector as being the
‘most effective’ in helping them enter, establish, or move up transport
and logistics value chains ..................................................................................................... 48
Table 8 Donors identifying the listed effects as impacts of their aid-for- trade
and/or value chain support ................................................................................................... 53
Table 9 Donors identifying the type of support as a way in which their aid-for-trade
strategy seeks to promote the development of value chains................................................. 57
Figures
Figure 1 Cross-country correlation between LPI scores and proportion of parts
and components in total exports .......................................................................................... 17
Figure 2 Cross-country correlation between LPI scores and diphtheria, pertussis,
and tetanus (DPT) immunization rates ................................................................................ 19
Figure 3 Cross-country correlation between ‘doing business’ export times and the
total value of exports to the rest of the world in 2005 ......................................................... 24
Figure 4 Cross-country correlation between ‘doing business’ export times and
number of CN 8-digit product lines exported to the EU in 2005 ........................................ 25
Figure 5 LPI scores by income group ................................................................................................ 28
Figure 6 LPI scores by region ............................................................................................................ 28
Figure 7 LPI survey respondents (2012) indicating that customs and other border
procedures that have ‘improved’ or been ‘much improved’ in their country
relative to 2009, by region ................................................................................................... 31
Figure 8 LPI survey respondents (2012) indicating that transport and ICT infrastructure
has ‘improved’ or been ‘much improved’ in their country relative to 2009,
by region.............................................................................................................................. 34
Figure 9 LPI survey respondents (2012) indicating that the quality of private logistics
services is ‘improved’ or ‘much improved’ in their country relative to 2009,
by region.............................................................................................................................. 35
Figure 10 LPI survey respondents (2012) indicating that logistics regulation is
‘improved’ or ‘much improved’ in their country relative to 2009, by region ................... 38
Figure 11 LPI survey respondents (2012) indicating that solicitation of informal
payments in connection with logistics activities is ‘improved’ or ‘much
improved’ in their country relative to 2009, by region ..................................................... 39
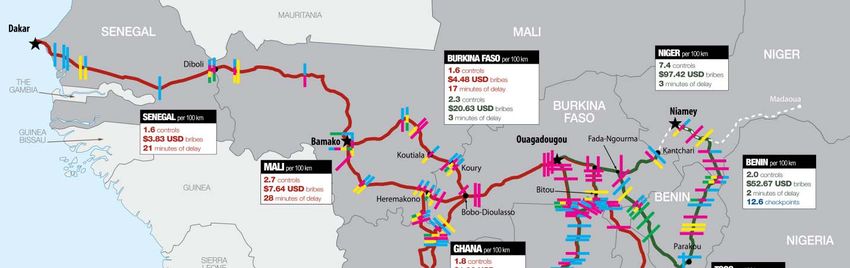
Figure 12 Checkpoints, delays, and unofficial payments in West African countries ......................... 40
Figure 13 Number of documents required for export and import, 2009-2012,
by region ............................................................................................................................ 41
Figure 14 Cost to export and import, 2009-2012, by region .............................................................. 42
Figure 15 Aid disbursements related to the transport and logistics sector ......................................... 51
Figure 16 Aid disbursements for transport and logistics by category ................................................ 52
Boxes
Box 1 Logistics and the global food crisis ......................................................................................... 20
Box 2 The LPI and logistics and transport reforms in Indonesia ....................................................... 29
Box 3 World Customs Organization-led customs reform .................................................................. 32
Box 4 Facilitating cross-border trucking services .............................................................................. 35
AID FOR TRADE AND VALUE CHAINS IN TRANSPORT AND LOGISTICS © OECD/WTO 2013TABLE OF CONTENTS – 7 Box 5 Successful red tape reforms in the doing business database .................................................... 42 Box 6 Shipping containers and quarantine pests ................................................................................ 44 Box 7 WTO agreement on trade facilitation ...................................................................................... 49 Box 8 Roads and trade facilitation for the Europe-Caucasus-Asia corridor ...................................... 53 Box 9 Regional transport corridors in Africa ..................................................................................... 54 Box 10 Simplification of border procedures in Africa ....................................................................... 55 Box 11 Private sector development in Brazil ..................................................................................... 56 Box A.1 TRS-led reform in a landlocked developing country........................................................... 66 AID FOR TRADE AND VALUE CHAINS IN TRANSPORT AND LOGISTICS © OECD/WTO 2013
ACRONYMS – 9

                                                           Acronyms

        AfDB                      African Development Bank
        AFT                       Aid for Trade
        APEC                      Asia-Pacific Economic Cooperation
        ASEAN                     Association of Southeast Asian Nations
        ASYCUDA                   Automated System for Customs Data
        COMESA                    Common Market for Eastern and Southern Africa
        CRS                       Creditor Reporting System
        DPT                       Diphtheria, Pertussis, and Tetanus
        ETI                       Global Enabling Trade Index
        EU                        European Union
        FDI                       Foreign Direct Investment
        GATS                      General Agreement on Trade in Services
        GATT                      General Agreement on Tariffs and Trade
        GCI                       Global Connectedness Index
        GDP                       Gross Domestic Product
        GNI                       Gross National Income
        GVCs                      Global Value Chains
        HDI                       Human Development Index
        ICT                       Information and Communication Technologies
        IPPC                      International Plant Protection Convention
        IRU                       International Road Transport Union
        LPI                       Logistics Performance Index
        OECD                      Organisation for Economic Co-operation and Development
        OSBP                      One Stop Border Posts
        PPP                       Public Private Partnerships
        SPS                       Sanitary and Phyto-sanitary

AID FOR TRADE AND VALUE CHAINS IN TRANSPORT AND LOGISTICS © OECD/WTO 2013
10 – ACRONYMS
TFI Trade Facilitation Indicators
Intergovernmental Commission for the Transport Corridor Europe-
TRACECA
Caucasus-Asia
TRS Time Release Studies
WCO World Customs Organization
WEF World Economic Forum
WTO World Trade Organization
AID FOR TRADE AND VALUE CHAINS IN TRANSPORT AND LOGISTICS © OECD/WTO 2013EXECUTIVE SUMMARY – 11
Executive Summary
Transport and logistics is a sector in which global value chains (GVCs) play a vital
role in connecting countries, spreading technology, and promoting best practice around
the world. The transport and logistics GVC is notable for the variety of lead firms
involved in it—including major shipping, express delivery, and freight forwarding
firms—and the range of local operators they partner with. Increasingly, transport and
logistics GVCs are extending their reach into developing countries, including some low
income countries and least-developed countries.
In addition to its role as a GVC in its own right, the transport and logistics sector is
also key for the performance of other sectors of the economy. Manufacturing and
agriculture both depend on being able to ship their goods to consumers quickly, cost-
effectively, and reliably. Indeed, the GVC business model that has become so important
in sectors such as electronics or agrifood is impossible to implement without a strong
transport and logistics sector in each of the countries involved. The data suggest that
countries with better logistics performance tend to specialize more in manufacturing
GVCs. Delays, which are related to poor transport and logistics performance, can be
costly: an extra day can reduce exports by at least 1%, and can also impede export
diversification.
Indeed, transport and logistics have a number of direct and indirect links with
important economic and social development goals. On the one hand, transport and
logistics can boost trade performance, which, under appropriate circumstances, leads to
higher incomes, employment gains, and lower poverty rates. Sectoral performance is also
a key determinant of a government’s ability to move important human development
goods—like basic foodstuffs and vaccines—to its population, particularly in remote
areas, at the lowest possible cost.
The available data suggest that there is an encouraging trend of improvement in many
aspects of transport and logistics sector performance in the developing world. Of course,
performance varies considerably from one region to another—which suggests that there is
a significant potential for South-South knowledge exchange to take place in this area. In
terms of the main areas that influence performance of the transport and logistics value
chain, new OECD/WTO survey data from the private sector as well as cross-country
datasets from the World Bank reveal the following trends:
1. Infrastructure: Trade and transport infrastructure remains a serious constraint in many
developing countries. However, there is some evidence of improvement over recent
years in Sub-Saharan Africa, and the Middle East and North Africa. The most striking
trend, however, is the rapid diffusion of information and communication technologies
(ICTs) in most developing regions. It stands out as an area in which donors—
multilateral and bilateral—partner country governments and the private sector have all
made important contributions to a significant development outcome.
2. Customs and Other Border Procedures: Although improvements are evident in most
regions in border procedures, they are more pronounced in customs than in other areas.
In part, this dynamic reflects the global dispersion of best practice through international
AID FOR TRADE AND VALUE CHAINS IN TRANSPORT AND LOGISTICS © OECD/WTO 201312 – EXECUTIVE SUMMARY
instruments, as well as the active involvement of donors and partner countries in
upgrading customs. However, other border agencies, such as health/quarantine agencies
and agencies administering sanitary and phyto-sanitary measures also need attention in
order to improve supply chain performance. These other agencies are particularly
important for developing countries involved in emerging agrifood value chains.
3. Private Services and Regulation: The data suggest that the quality of private providers
of transport and logistics services is generally improving around the world. Efforts at
private sector development in this area would therefore appear to be bearing fruit. By
contrast, improvement in the regulatory measures that support and shape the private
sector’s performance is taking place at a slower pace. It is important that policymakers
and sectoral regulators ensure that further private sector upgrading is not inhibited by an
unduly restrictive regulatory environment.
4. Red Tape: Data from the World Bank’s Doing Business project suggest that although
performance improvements are evident in many areas of the transport and logistics
value chain, red tape still remains a serious issue facing importers and exporters in
many developing countries. Reductions in documentary formalities have been minimal
in recent years, and costs have actually increased in many countries. Many countries
have scope to further reduce delays and improve supply chain performance by
rationalizing red tape burdens.
5. Governance: More red tape often means that operators are more willing to make
unofficial “speed money” payments, which undermines the objective of improving
governance. Indeed, the data suggest that governance remains a significant constraint in
many developing countries. The uncertainty associated with poor supply chain
governance can translate into increased indirect costs for operators. Transport and
logistics service providers often find it easier to deal with a known delay, even if it is
not as short as it could be, than with a highly uncertain one. Governance should
therefore be an important aspect of value chain upgrading around the world.
Going forward, there is a clear case for donor countries, partner countries, and the
private sector to continue to work together to improve the transport and logistics value
chain, and help bring about the positive economic and social development outcomes it
can support. In a new OECD/WTO survey analyzed in this paper, partner countries
consistently see domestic and foreign private investment, as well as official development
assistance, as important sources of financing for development of the transport and
logistics value chain.
According to the priorities expressed by partner countries in the same survey, the
following areas will remain key for the aid-for-trade (AfT) agenda in the transport and
logistics sector:
1. Hard infrastructure: Many developing countries still require significant investments in
basic infrastructure like ports, airports, roads, and rail links. Mobilizing funds for an
initial investment is not enough, however. It is also important to ensure that funds are
available for continuous maintenance, so that facilities remain productive in years to
come.
2. “Soft” infrastructure: Hard infrastructure development only brings maximum benefits if
it is combined with other components of a comprehensive AfT agenda. Transport sector
AID FOR TRADE AND VALUE CHAINS IN TRANSPORT AND LOGISTICS © OECD/WTO 2013EXECUTIVE SUMMARY – 13
regulation is important, because it governs the conditions under which operators can do
business, and often determines the conditions under which they can access key
international gateways. Customs and border procedures also matter, as they can have
serious impacts on delays and uncertainty faced by traders. The multilateral Agreement
on Trade Facilitation, currently under negotiation at the WTO, would help promote
more efficient customs and border procedures to allow goods to cross borders more
quickly and more cheaply and ensure legal certainty between trading partners. Finally,
private sector development is also key, as the private sector is the engine of
technological upgrading in the sector, a role that is enhanced as the transport and
logistics GVC develops further.
3. Coordination and collaboration: The case studies examined in this paper show that the
best results are achieved when multilateral and bilateral donors, as well as partner
countries and the private sector, are all engaged in improving transport and logistics
performance. It is important for the process to be driven by partner country priorities,
with the private sector playing a key role in their development. In terms of donor
collaboration and coordination, different agencies clearly have comparative advantage
in different areas, but transport and logistics work is inherently multi-dimensional. It
therefore requires coordinated input from a range of sources.
AID FOR TRADE AND VALUE CHAINS IN TRANSPORT AND LOGISTICS © OECD/WTO 20131. WHY DO TRANSPORT AND LOGISTICS MATTER FOR DEVELOPMENT? – 15
1. Why do transport and logistics matter for development?
There are many connections—both direct and indirect—between the transport and
logistics sector and important development outcomes. The significance of transport and
logistics for development is reflected in the fact that over 80% of partner country
respondents to an OECD/WTO survey on Aid for Trade (AfT) included transport and
trade facilitation among their top three new AfT priorities. Moreover, all respondents
indicate that their national development strategies identify transport as a specific source
of growth. No other sector has such unanimous recognition as a core lever for growth and
development.
One well known connection between transport and logistics and development is in
facilitating international trade transactions, which, under appropriate circumstances, boost
national income, reduce poverty, and thus contribute to economic and social
development.1 The OECD/WTO survey of partner countries provides a useful overview
of the development effects of increased trade connections, in particular through global
value chains (GVCs). Partner countries clearly have a strong belief that increased
participation in GVCs can be good for economic growth and social development. The
areas they highlight are listed in Table 1. For a full overview of the rise of GVCs, the
issues involved in measuring countries’ participation in them, and their development
implications, see OECD (2013).
Table 1 Factors listed as the 'most important' or 'important' impacts of trade
on the economy – particularly through GVCs
Factor Percent of Respondents
Increased exports 100%
Increased exports and imports 98%
Export diversification 100%
Increased economic growth 100%
Employment 100%
Poverty alleviation 100%
Greater environmental sustainability 87%
Women’s economic empowerment 89%
Source: OECD/WTO.
Since there is an intervening mechanism in this case—international trade—we discuss
such linkages in the next sub-section, under the heading of “indirect effects”. Such effects
1
Although gross national income (GNI) is not itself a social development indicator, it is one of three pillars of
the broader Human Development Index (HDI) used by the United Nations, along with health and
education. Simple statistical analysis using data from the most recent Human Development Report
shows that the HDI and (log) GNI correlate very strongly (r = 0.94). Squaring the correlation
coefficient gives the coefficient of determination (R2 = 0.88), which indicates that variation in (log)
GNI accounts for 88% of the observed variation in the HDI. Income is therefore an extremely
important determinant of both economic and social development.
AID FOR TRADE AND VALUE CHAINS IN TRANSPORT AND LOGISTICS © OECD/WTO 201316 – 1. WHY DO TRANSPORT AND LOGISTICS MATTER FOR DEVELOPMENT?
are generally well known, so we deal with them first. Less well known are the “direct
effects” of transport and logistics on development outcomes of importance. We discuss
them in the second sub-section.
Indirect impacts on development outcomes
International trade can, under the right circumstances, be an important engine of
economic growth and poverty alleviation. There is now overwhelming evidence that trade
liberalization is associated with faster productivity growth among developing country
firms (e.g., Pavcnik, 2002 for Chile). Productivity growth, in turn, is a crucial source of
economic growth and technological upgrading.
However, trade does not affect all of a country’s economic activity equally. On the
one hand, trade can cause dislocation of workers within sectors, for which appropriate
adjustment policies need to be put in place. The impact of tariff liberalization on poverty
depends to a certain extent on whether particular households tend to be net buyers or net
sellers of goods in liberalized sectors. In the former case, they tend to gain from
reductions in import protection. In the latter, they may lose. Particularly in areas such as
agricultural production the impact of trade liberalization on poverty may be ambiguous
(OECD, 2012b). However, emerging empirical evidence suggests that trade liberalization
can, in many cases, reduce poverty, particularly if the right complementary policies are
put in place (Hertel and Winters, 2005; OECD, 2012b).
On the assumption that increased trade due to broad-based liberalization can, under
the right circumstances, promote economic and social development through increased
productivity and decreased poverty, then the transport and logistics sector has a crucial
role to play in this process. Transport and logistics service providers are deeply involved
in the mechanics of international trade transactions. It is difficult for a manufacturer to
export at a competitive price or import at a competitive cost if the transport and logistics
sector is dysfunctional. High prices, poor service, and a lack of certainty in transport and
logistics translate into the effective isolation of a country from world markets. Transport
and logistics—understood as air and maritime connectivity, and logistics performance—
together seem to contribute as much to the costs of international trade as geographical
distance (Arvis et al., 2013). Similarly, OECD (2011b) finds that a one day decrease in
time spent at sea could increase trade by about 4.5%.
Of course, transport and logistics performance matters more for some parts of the
trading economy than others. Participation in global value chains (GVCs) in
manufacturing is one part of the economy that depends fundamentally on transport and
logistics for its success. Goods moving through GVCs typically cross multiple borders
during the production process of the final product. Parts and components can be
assembled in various different countries, before being brought together in a different
country for final assembly. Rather than manage inventory, many lead companies in GVCs
now build redundancies into their supply chains, which means that the same component
for the same final good can be sourced from different locations. This approach is a way of
managing the risk that comes with relying on a single component producer who might
experience production problems due to outside causes, thus holding up the entire process.
The end result is a complex network of producers and assemblers, all performing related
functions, before the final product is shipped to the consumer, again in a different
country.
AID FOR TRADE AND VALUE CHAINS IN TRANSPORT AND LOGISTICS © OECD/WTO 20131. WHY DO TRANSPORT AND LOGISTICS MATTER FOR DEVELOPMENT? – 17
Transport and logistics performance is also key for ensuring effective participation in
agrifood value chains. Transport and logistics costs may be less in the case of agrifood
products, which are part of simpler supply chains than manufactures, but they have a
greater proportional impact on the price of most agricultural products because of their low
value-to-weight ratio. Furthermore, perishable products suffer particularly from delays,
one of the most significant factors leading to post-harvest losses. Recent OECD research
has found that a 10% improvement in transport and trade-related infrastructure quality
can increase developing countries’ agricultural exports by 30% (OECD 2013).
The bottom line from a commercial point of view is that this kind of business model
is simply impractical without strong transport and logistics performance. GVCs need to
manage cost and risk at all points in the production process. This means that transport
costs have to be kept down, times have to be kept low, and uncertainty has to be
minimized. “New generation” trade facilitation programs, such as APEC’s Supply Chain
Connectivity Initiative, directly recognize the importance of these three objectives.
Similarly, recent research confirms that logistics performance matters more for trade
within GVCs than for other types of trade (Saslavsky and Shepherd, 2012). Using the
proportion of parts and components in total exports as a proxy for manufacturing GVC
participation, Figure 1 confirms that countries with stronger logistics performance tend to
specialize in GVC-related exports. The importance of this type of trade for development
is reflected in the fact that almost half of partner country respondents to an OECD/WTO
survey on AfT identified value chains as among their new AfT priorities.
Figure 1 Cross-country correlation between LPI scores and
proportion of parts and components in total exports
(Logistics Performance Index, ranging from 1-5 percent)
25%
Share of Parts and Components in Total
20%
Exports (%)
15%
10%
5%
0%
1 1.5 2 2.5 3 3.5 4 4.5 5
LPI Score
Source: Arvis et al. (2010).
In addition, transport and logistics services are themselves GVCs in many respects.
Lead firms—usually multinationals—work with a variety of local and international firms
to provide a final service to the consumer. Improving performance therefore means not
just working on individual sources of delay, cost, or uncertainty, but taking a GVC-wide
AID FOR TRADE AND VALUE CHAINS IN TRANSPORT AND LOGISTICS © OECD/WTO 201318 – 1. WHY DO TRANSPORT AND LOGISTICS MATTER FOR DEVELOPMENT?
view of performance. Since transport and logistics are services GVCs, rather than the
more common manufacturing GVCs, it is important to consider the role that barriers to
trade in services can play in holding back performance. Since many services can only be
traded efficiently by establishment of the exporting company in the importing country
(GATS Mode III), restrictions on foreign direct investment (FDI), such as foreign equity
limits, also need to be part of the discussion. Indeed, respondents to the OECD/WTO
partner country survey nearly always identify FDI (98%) and local private investment
(96%) as “most important” or “important” sources of financing for their firms to connect
to regional, South-South, and global markets. As a point of comparison, only 71%
similarly identify official development assistance, and 85% cite local public investment.
From the donor perspective, however, the order is reversed: 92% of respondents to the
OECD/WTO donor questionnaire indicate that official development assistance is a “most
important” or “important” source of financing, while 79% cite FDI and 61% cite local
public investment.
The industrialization process is, of course, dynamic rather than static. As a result,
countries do not want to enter a GVC at one point and remain there for a long period.
Rather, the objective is to “move up the value chain” towards higher value added (higher
productivity) activities (e.g., Baldwin, 2011). China, for example, is well known as an
assembly point for many consumer electronics, which is a labor-intensive, relatively low
value-added activity. However, the country is increasingly moving into other parts of the
value chain, including manufacturing of important components, and even, in some cases,
design or research and development. Although such changes inevitably take place at
different paces in different countries, they provide the opportunity for sustained
productivity growth based on a GVC model, and can thus support important
industrialization and development objectives.
Again, the transport and logistics sector is key to efforts to move up the value chain.
As the manufacturing process become more complex at higher layers of a GVC, so it
becomes even more important to be able to move both inputs and outputs across borders
rapidly, at low cost, and with as little risk as possible. At the top of a GVC—the position
of the “lead firm”—it is necessary to coordinate the activities of firms at all points
throughout the chain, and manage the movement of goods and services from the various
producers to the end consumer. Such operations are only possible in an environment
where the transport and logistics sector exhibits high performance.
Just as transport and logistics performance is more important for some sectors of the
economy (e.g., manufacturing GVCs) than for others, so too is it more important for some
countries than for others. Countries that are geographically isolated—including
landlocked countries and small island developing states—depend all the more strongly on
efficient transport and logistics operations to develop linkages with world markets.
Indeed, geographically disadvantaged economies can do much to reduce their relative
isolation by focusing on policies designed to improve performance in key services sectors
like transport and logistics (Borchert et al., 2012).
Direct impacts on development outcomes
Although the indirect impacts of transport and logistics on development are more
familiar to policymakers, there are also a number of direct impacts that deserve greater
attention. The first is that an efficient transport and logistics sector is in fact key to the
achievement of important social development goals, such as the distribution of vaccines.
Many vaccines have to be moved quickly, under strict temperature controls, in order to
AID FOR TRADE AND VALUE CHAINS IN TRANSPORT AND LOGISTICS © OECD/WTO 20131. WHY DO TRANSPORT AND LOGISTICS MATTER FOR DEVELOPMENT? – 19
retain their efficacy. In a country where transport and logistics performance is poor, it is
therefore difficult to conduct effective vaccination programs outside major population
centers, where distances traveled are short. Preliminary econometric evidence indeed
suggests that better logistics performance is linked to higher rates of vaccination, even
after controlling for other factors, including the level of national income, the proportion
of national income spent on health, and a common measure of government effectiveness
(Pasadilla and Shepherd, 2011). Figure 2 reproduces the same basic correlation, although
without controlling for other factors. The same study finds, moreover, that the link
between logistics performance and vaccination rates is stronger in poorer countries than
in richer ones. These findings are one example of a direct way in which the transport and
logistics sector can contribute to important human development outcomes.
Figure 2 Cross-country correlation between LPI scores and
diphtheria, pertussis, and tetanus (DPT) immunization rates
(Logistics Performance Index, ranging from 1-5 percent of the population)
100%
90%
80%
DPT Immunization Rate (%)
70%
60%
50%
40%
30%
20%
10%
0%
1 1.5 2 2.5 3 3.5 4 4.5 5
LPI Score
Source: Pasadilla and Shepherd (2011).
Similarly, greater efficiency in transport and logistics means that other socially
important goods, such as basic foodstuffs, can be moved within countries more quickly
and at lower cost. Consumers benefit by gaining access to lower cost goods.
Improvements in transport and logistics can also help producers, including agricultural
smallholders, by bringing them closer to local and regional markets. If distribution
markets work effectively, lower transport costs mean that a higher proportion of the
consumer price can be returned to the producer, thereby increasing incomes among some
of the poorest members of society, improving affordability of food, and helping address
problems of global hunger (OECD 2012b). Indeed, better functioning transport and
logistics markets can make it possible for farmers to access entirely new markets, either
in different regions, or, potentially, internationally. Recent research by Porto et al. (2011),
for example, shows that the income of smallholders in a number of African countries
could potentially be increased by improving infrastructure.
AID FOR TRADE AND VALUE CHAINS IN TRANSPORT AND LOGISTICS © OECD/WTO 201320 – 1. WHY DO TRANSPORT AND LOGISTICS MATTER FOR DEVELOPMENT?
Box 1 Logistics and the global food crisis
One way that an efficient transport and logistics sector can directly improve development outcomes is by
reducing consumer prices for essential goods, such as basic foodstuffs. In countries with poor internal
connectivity, where transport and logistics services are under-developed, and where supply chain governance is
poor, the direct and indirect costs of moving food from the farm gate to the consumer are higher than they need
be. This effect is inevitably passed on the form of higher prices. In many countries, transport and logistics costs
can be as high as 20%-60% of the price the final consumer pays. Indeed, in some circumstances, the blow can be
double: a lack of competition in transport and logistics can not only increase prices and decrease availability for
consumers, but it can also result in lower farm gate prices received by farmers, many of whom are themselves
poor.
Transport and logistics services also matter for food distribution more dynamically, in the sense that they
affect a country’s ability to respond to price shocks. Lower transport costs can lower the domestic prices of
imported goods and ensure that a greater share of the price of exported goods accrues to the producer. The effect
on price volatility is more ambiguous: although efficient transport and logistics services can increase world price
transmission to domestic markets, they can also help affected countries respond to food price peaks. By
improving the accessibility of imported grains, on which many developing countries rely heavily, and limiting
the very high product losses (up to 5% in the Middle East and North Africa according to a World Bank/FAO
assessment) linked to extremely lengthy transit times, improvements in transport and logistics can do much to
mitigate the effects of high world food prices.
Source: Arvis et al. (2012); OECD (2012b).
A third way in which efficient transport and logistics sectors contributes directly to
development outcomes is as a source of employment. Jobs growth is vital in the
developing country context, where unemployment rates can be high, and important
segments of the population can be entirely excluded from the formal labor market.
Transport and logistics operations tend to be relatively more labor intensive in developing
countries than in developed ones, due to differences in production technology. Recent
research shows that as low-income countries grow their economies towards middle-
income status, the size of the transport and logistics sector—as measured by its
contribution to GDP—tends to increase (Shepherd, 2011).2 One possible reason is that
there is increased development of specialized transport and logistics firms, which leads to
greater (low cost) outsourcing opportunities for manufacturers that previously had to
conduct such activities in-house (and at high cost). The implication of these findings is
that for the poorest developing countries, transport and logistics can—as part of a broad-
based approach to job creation—provide employment opportunities for a significant
number of people. Like vaccine distribution, access to the labor market is important from
the points of view of both economic and social development.
A fourth set of direct linkages between transport and logistics on the one hand and
development outcomes on the other are in the area of governance and anti-corruption.
Transport and logistics operators are unfortunately in a perfect position to be made
subject to a “hold up” problem in the face of (potentially) corrupt police, customs agents,
or other officials. By their very nature, operators need to confront binding constraints
2
The relationship becomes inverted at around USD 10,000 in PPP terms. After that point, an increase in per
capita income is associated with a smaller transport and logistics sector, probably because
productivity (technology) effects dominate the outsourcing effect referred to in the main text.
AID FOR TRADE AND VALUE CHAINS IN TRANSPORT AND LOGISTICS © OECD/WTO 20131. WHY DO TRANSPORT AND LOGISTICS MATTER FOR DEVELOPMENT? – 21
such as access to crucial facilities (roads and ports), or the completion of necessary
processes (customs formalities and other border checks). Poor governance along the
supply chain means that, in some cases, the only way to deal with binding constraints is
by making unofficial payments. Indeed, payments of “speed money” are common in
some developing countries (e.g., Olken and Barron, 2009). Shepherd (2009) shows that
less efficient official processes tend to foster a greater prevalence of speed money
payments, as operators are required to use unofficial channels to expedite their business.
The OECD/WTO private sector survey confirms that governance issues, including
unofficial payments, are a serious issue in the development of transport and logistics
value chains (see Subsection 3, Governance below).
AID FOR TRADE AND VALUE CHAINS IN TRANSPORT AND LOGISTICS © OECD/WTO 20132. MEASURING DELAYS AND THEIR IMPACTS: THE TOOLKIT – 23
2. Measuring delays and their impacts: The toolkit
This section examines the data currently available for policymakers to assess the
prevalence, seriousness, and sources of trade delays in their countries. Full details of
individual indicators are available in the Annex A. Indicators can be divided into two
broad groups: single country sources, i.e. those which cannot easily be compared across
countries; and cross-country sources, which are designed and implemented in a
standardized way and can more convincingly be compared from one country to another.
OECD (2012) similarly uses cross-country data as a starting point to analyze the impacts
of aid for trade on particular intermediate and final outcomes of policy interest.
There exists an extensive toolkit for policymakers to use in assessing the prevalence
and sources of supply chain impediments that increase direct and indirect costs for supply
chain participants in their countries, and which can inhibit the growth of GVCs by
making countries less competitive internationally. Of course, all of the cross-country
indicators are necessarily somewhat coarse-grained, as they sacrifice specificity in order
to retain standardization. They are not the end of an analytical process, but rather the
start. Ideally, the reform process should begin with a first level diagnostics exercise in
which broad indicators are consulted to give an idea of where the most serious problems
are. The second step is then to undertake detailed, country-specific work to uncover the
causes of those problems and develop possible remedies to improve time, cost, and
predictability of supply chain transactions. The final step is to implement the proposed
solutions on the ground, monitor progress, and make any changes necessary to ensure
maximum possible results.
At this point, an obvious question arises: what do we know about the trade impacts of
supply chain impediments? Recent academic research provides useful clues as to the
economic effects that delays can have. Hummels (2001) is one of the first papers to
examine the impact of time on trade flows. Using data for US imports, he finds that
reducing international shipping times by one day is associated with an increase in trade of
0.8%. The same reduction also increases the probability that the US will source imports
from a country by 1%-1.5%. To show the importance of delays caused by international
transport, Hummels (2001) estimates that the increasing use of faster transport methods
over recent decades—which reduces trade times—boosted trade by an amount equivalent
to a tariff reduction from 32% to 9% over the 1950-1998 period.
One limitation of the Hummels (2001) study is that it only considers international
transport times. It does not consider other factors that contribute to trade times, such as
internal transit, document preparation, and customs and border formalities. Djankov et al.
(2010) use Doing Business data on export times—discussed in detail in the Annex A—to
examine the impact of those factors on trade. Their results are similar to those of
Hummels (2001) in terms of quantitative magnitude: a one day reduction in pre-shipment
delays is associated with a trade increase of about 1%. (Figure 3 illustrates this negative
correlation.) In effect, countries with long export times are isolating themselves from
world markets: Djankov et al. (2010) estimate that an additional day’s delay in an average
country is equivalent to moving it away from its trading partners by about 70km. The
implication is that trade delays are particularly important for countries that already suffer
from geographic disadvantages, such as being landlocked, or being small island
AID FOR TRADE AND VALUE CHAINS IN TRANSPORT AND LOGISTICS © OECD/WTO 201324 – 2. MEASURING DELAYS AND THEIR IMPACTS: THE TOOLKIT
developing states: they can reduce the effects of geographical isolation by improving their
delay performance prior to shipment, including by improving border processes.
Interestingly, Djankov et al. (2010) find that pre-shipment delays matter more for some
products that for others: specifically, time sensitive products—including some
manufactured goods and perishable agricultural products—benefit more from improved
performance than others.
Figure 3 Cross-country correlation between ‘doing business’ export times and
the total value of exports to the rest of the world in 2005
(in logarithms)
35
30
25
Log(Export Value)
20
15
10
5
0
0 0.5 1 1.5 2 2.5 3 3.5 4 4.5 5
Log(Export Time)
Source: WITS-Comtrade for exports; Doing Business for export times.
Recent work by the OECD (OECD, 2013c) goes in the same direction as this
emerging body of evidence. Using data for 133 countries, they find that trade facilitation
performance (in the sense of streamlining border procedures) accounts for around 14% of
the observed variance in bilateral trade costs. The analysis also shows that trade
facilitation measures not only increase imports but also boost exports, in particular
through better access to inputs for production and greater participation in global and
regional value chains. Border process improvements through trade facilitation affect trade
costs, which in turn affect the pattern of bilateral trade flows. Arvis et al. (2013) also
provide econometric evidence that goes in the same direction for a set of 178 countries.
Martincus et al. (2013) focus specifically on the case of customs, but use firm-level
export data from Uruguay, rather than cross-country data as in all the other papers. They
find that customs delays on their own—without considering other aspects of transport,
logistics, and trade facilitation—can be responsible for significant trade reductions.
Concretely, an extra day spent in customs translates into a 2.8% decline in the growth rate
of exports.
It is thus well-established that export delays—from a variety of sources—can have
serious trade-inhibiting effects. However, their trade impacts are also felt in other ways
that are particularly important for developing countries. For example, Dennis and
AID FOR TRADE AND VALUE CHAINS IN TRANSPORT AND LOGISTICS © OECD/WTO 20132. MEASURING DELAYS AND THEIR IMPACTS: THE TOOLKIT – 25
Shepherd (2011) show that pre-shipment delays are associated with a lower degree of
export diversification in developing countries, as evidenced by the downward sloping line
of best fit in Figure 4. Export diversification is a serious issue for many developing
countries that tend to concentrate their exports on a few well-established products, and
which therefore see it as an important development aim to develop broader export
bundles. The mechanism in this case is that higher trade costs—to which delays
contribute—mean that only the most productive firms can export, and since they make a
limited range of products, the country’s export bundle becomes correspondingly
concentrated. Shepherd (2010) shows that a similar mechanism is at work in the area of
geographical diversification of developing country exports. Exporting to a range of
markets is an important way of dealing with the risk of a foreign economic slowdown,
with a consequent drop-off in demand for exports. Trade costs—including those that are
related to delays—again mean that only some markets can be profitably accessed, with a
corresponding contraction in the range of countries used as export destinations. Finally,
OECD research shows that complex and non-transparent border procedures and
regulations, as well as weak law enforcement at the border, are significant factors
encouraging informal cross-border trade, with negative economic and developmental
consequences for concerned countries (OECD 2008).
Figure 4 Cross-country correlation between ‘doing business’ export times and
number of CN 8-digit product lines exported to the EU in 2005
(in logarithms)
10
9
Log(Number of Exported Products)
8
7
6
5
4
3
2
1
0
0 0.5 1 1.5 2 2.5 3 3.5 4 4.5 5
Log(Doing Business Export Time)
Source: Dennis and Shepherd (2011).
AID FOR TRADE AND VALUE CHAINS IN TRANSPORT AND LOGISTICS © OECD/WTO 20133. EMERGING TRENDS: WHERE AND WHY IS PROGRESS BEING MADE? – 27
3. Emerging trends: Where and why is progress being made?
The previous sections have highlighted the importance of transport and logistics
services for development and participation in GVCs, as well as the tools available to
measure delays and impediments that inhibit development of the transport and logistics
value chain itself. In this section, we examine recent data on performance, using
responses from an OECD/WTO private sector survey on value chains that highlight the
constraints currently identified by firms as the most important, the factors that most
influence sourcing decisions in their value chain, and the most typical difficulties faced in
providing transport and logistics services in developing countries. In transport and
logistics, the survey involved 96 respondents from a variety of developing and developed
countries. Although it is therefore a small sample, and results need to be treated with
caution, it provides a useful indication of private sector sentiment in the transport and
logistics value chain.
In addition, we look at recent trends contained in data from the OECD Trade
Facilitation Indicators, and the World Bank’s LPI and Doing Business projects. The first
dataset gives us information on general trade facilitation performance, the second dataset
presents areas that the private sector considers to have improved between surveys (2009-
2012), while the last source allows us to track changes in red tape burdens affecting
transport and logistics transactions that facilitate international trade.
Overall performance
There is no question in the OECD/WTO survey dealing with overall transport and
logistics performance, so we turn to the World Bank data as a starting point. As discussed
in the Annex A, the International LPI provides an overall measure of transport and
logistics performance in up to 155 countries around the globe. Since the methodology is
basically unchanged between reports, a comparison of scores in 2007, 2010, and 2012 is
therefore one way of identifying country groups and regions that have seen significant
progress over time, as well as those where additional challenges remain.
We first break out the data by income group, taking simple averages (Figure 5). For
ease of presentation, we consider OECD and non-OECD high income countries as a
single group. For the developing countries—which we consider to be all but the high
income countries—there is clear improvement in all cases between 2007 and 2010. In the
two middle income groups, there is also a small improvement between 2010 and 2012,
but the difference in average scores is very small. Low income countries, by contrast,
exhibit a small lowering of their average score between 2010 and 2012, but the difference
is again very small. Overall, these results are indicative of substantial improvements at
least in the early years of the sample, with a possible slowing down of that progress
towards the end. One important point of comparison is, of course, with the high income
group, where performance is relatively steady over time. One of the most notable points
emerging from Figure 5 is not so much the change in performance of the developing
countries, but the continued large gap between the high income countries and the other
groups in terms of overall logistics performance. This “logistics gap” (Arvis et al., 2012)
AID FOR TRADE AND VALUE CHAINS IN TRANSPORT AND LOGISTICS © OECD/WTO 201328 – 3. EMERGING TRENDS: WHERE AND WHY IS PROGRESS BEING MADE?
suggests that expansion of the transport and logistics GVC in developing countries,
including to support integration into other GVCs, still faces very significant obstacles.
Figure 5 LPI scores by income group
(Logistics Performance Index ranging from 1-5, 2007-2012)
5
4.5
4
LPI Score
3.5
3
2.5
2
1.5
1
High income Upper middle income Lower middle income Low income
2007 2010 2012
Source: LPI database.
The second way in which we can divide up the data is by region, again taking simple
averages. These groupings exclude high income countries, and therefore are limited—in
our definition—to developing countries only. Results are in Figure 6. East Asia and the
Pacific consistently has the highest average LPI score of any developing region.
Importantly, all developing regions exhibit evidence of performance improvements
between 2007 and 2012, although in some cases there is slight backsliding in the latter
part of the sample. Calculating improvement rates between 2007 and 2012 identifies two
groups of countries. The first group—South Asia, Europe and Central Asia, and the
Middle East and North Africa—exhibit fast rates of improvement, between 8% and 12%
over the five year sample period. The second group—Latin America and the Caribbean,
Sub-Saharan Africa, and East Asia and the Pacific—has experienced slower growth in
their LPI scores, of between 4% and 5% over the same period.
Figure 6 LPI scores by region
(Logistics Performance Index ranging from 1-5, 2007-2012)
5
4.5
4
LPI Score
3.5
3
2.5
2
1.5
1
East Asia & Pacific Europe & Central Latin America & Middle East & South Asia Sub-Saharan
Asia Caribbean North Africa Africa
2007 2010 2012
Source: LPI database.
AID FOR TRADE AND VALUE CHAINS IN TRANSPORT AND LOGISTICS © OECD/WTO 20133. EMERGING TRENDS: WHERE AND WHY IS PROGRESS BEING MADE? – 29
Findings from the regional breakdown suggest two policy conclusions. The first is
that there is an important stock of developing country examples where logistics
performance is relatively strong compared to the rest of the group. It is no coincidence
that it is East Asia and the Pacific—the area where manufacturing GVCs are best
developed—that has the highest average LPI scores. There is thus considerable South-
South knowledge sharing that can take place in the area of transport and logistics, and the
potential for improvement in other regions is significant. Second, the data show that some
developing regions are experiencing rapid improvements in overall performance. In some
cases, such as South Asia, that improvement is taking place from a low baseline.
However, the rate of change demonstrates that some developing countries are succeeding
in developing and implementing reforms that are very positively received by private
sector operators on the ground. These reforms can be expected to boost development of
the transport and logistics GVC in those regions, and by extension, make the business
environment more favorable for manufacturing GVCs. Again, there is significant
potential for South-South exchanges to disseminate these successful examples of reform.
Box 2 The LPI and logistics and transport reforms in Indonesia
One function of a globally visible index like the LPI is to raise national awareness of transport and logistics
issues, and provide momentum for on-the-ground reforms. Indonesia provides an interesting example of this
process. Shortly after publication of the 2007 LPI report, government officials launched a wide-reaching public-
private dialogue on transport and logistics issues in the country. This process led to the preparation of an action
plan focusing on trade costs in its major ports, and the particular challenges faced by a country made up of over
10,000 islands. The World Bank became involved in 2008, working with the government to develop strategies to
improve operations at the country’s largest port.
Of course, the LPI on its own cannot provide the detailed information policymakers need to design detailed
and complex reforms. Rather, it highlights broad issues that can then be investigated further using other
complementary tools, and it can then also serve a monitoring function as a broad indicator of progress. In the
Indonesian case, the government took a number of steps to improve port performance, such as offering 24-hour
service throughout the week. Although a number of issues still remain to be resolved, these initial reforms are
perhaps starting to bear fruit: the country’s LPI rank increased from 75th to 59th between the 2010 and 2012
reports.
Source: Arvis et al. (2012).
Of course, the comparison of overall LPI scores can only give us a general indication
of the degree to which progress is taking place on the ground. More useful for
policymakers is a consideration of individual areas in which performance improvements
have taken place, and those in which progress has been slower. The Domestic LPI
contains such information, highlighting particular areas where 2012 survey respondents
indicated the degree of improvement since 2009 (the time of the previous survey). As in
Arvis et al. (2012), we present the data by indicating the percentage of respondents
indicating that a particular area is “improved” or “much improved” relative to the
benchmark. (For data on time and cost, see Subsection 3 on red tape, where we make
extensive use of the Doing Business data on these points.) In the specific area of customs
and other border procedures the OECD Trade Facilitation Indicators (TFIs) offer the most
AID FOR TRADE AND VALUE CHAINS IN TRANSPORT AND LOGISTICS © OECD/WTO 2013You can also read