R 496 - The distribution of well-being among Europeans by Andrea Brandolini and Alfonso Rosolia - Banca d'Italia
←
→
Page content transcription
If your browser does not render page correctly, please read the page content below
Questioni di Economia e Finanza
             (Occasional Papers)

             The distribution of well-being among Europeans

             by Andrea Brandolini and Alfonso Rosolia
April 2019

                                                                       496
                                                              Number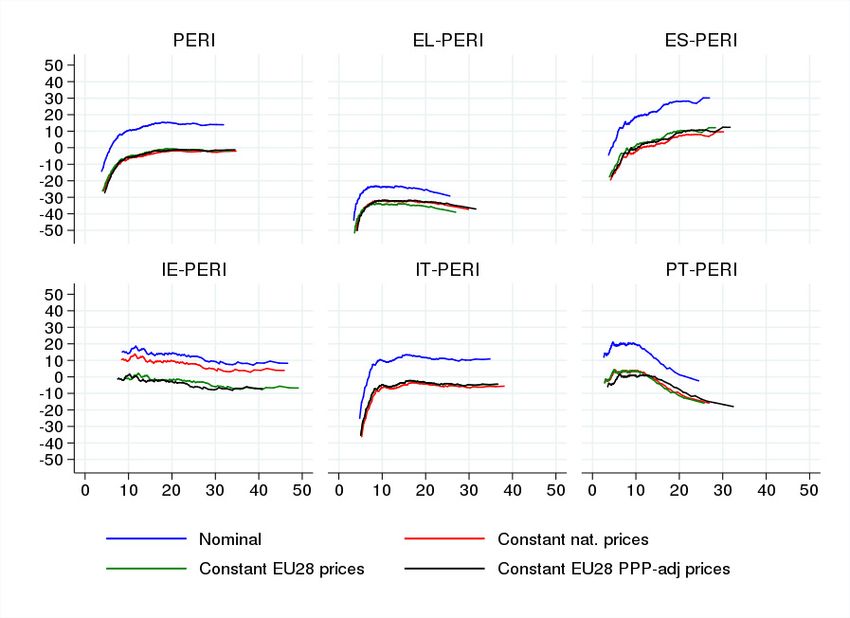
Questioni di Economia e Finanza
(Occasional Papers)

The distribution of well-being among Europeans

by Andrea Brandolini and Alfonso Rosolia

Number 496 – April 2019
The series Occasional Papers presents studies and documents on issues pertaining to
the institutional tasks of the Bank of Italy and the Eurosystem. The Occasional Papers appear
alongside the Working Papers series which are specifically aimed at providing original contributions
to economic research.

                 The Occasional Papers include studies conducted within the Bank of Italy, sometimes
in cooperation with the Eurosystem or other institutions. The views expressed in the studies are those of
the authors and do not involve the responsibility of the institutions to which they belong.

                 The series is available online at www.bancaditalia.it .

ISSN 1972-6627 (print)
ISSN 1972-6643 (online)

Printed by the Printing and Publishing Division of the Bank of Italy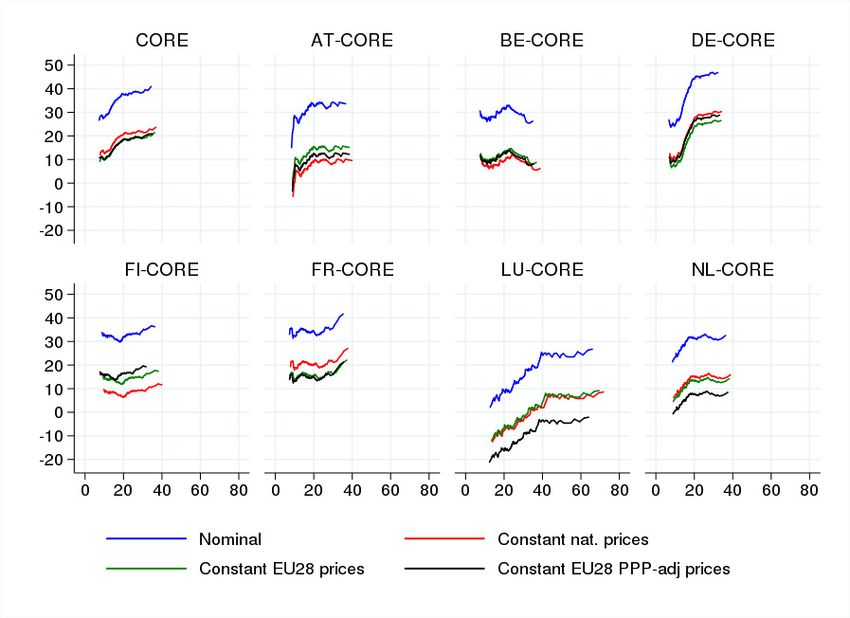
THE DISTRIBUTION OF WELL-BEING AMONG EUROPEANS

                                    by Andrea Brandolini* and Alfonso Rosolia*

                                                               Abstract

        We analyse the evolution of EU citizens’ living standards, considering the EU as a
single country. Average living standards have improved considerably as the European
integration process has unfolded. EU28 income inequality has steadily declined, mostly as a
result of the macroeconomic convergence of new EU-accession countries. EU15 income
inequality fell steadily until the mid-1980s, but picked up again during the economic turmoil
following the Great Recession, largely reflecting the divergence between periphery and core
countries in the euro area. Using a common EU standard reveals more progress in terms of
poverty reduction. It also shows that the patterns of income convergence across member states
differ across categories of residents, thus calling for a more careful consideration of the
personal and national dimensions of EU policies.

Keywords: European Union, Euro Area, European integration, income inequality, welfare
analysis. JEL Codes: D31, D63, E01, I32.

                                                               Contents

1 Introduction ........................................................................................................................... 5
2 An aggregate view of post-war developments ...................................................................... 8
3 Inequality in national income distributions ......................................................................... 12
4 Estimates of the EU-wide income distribution .................................................................... 18
5 A look inside EU inequality developments in the last decade ............................................ 22
6 Conclusions ......................................................................................................................... 26
Appendix 1: Data sources and measurement definitions ......................................................... 31
Appendix 2: Estimates of the EU-wide distribution ................................................................ 34
References ................................................................................................................................ 37
Figures and tables ..................................................................................................................... 48

_________________________
* Bank of Italy, DG Economics, Statistics and Research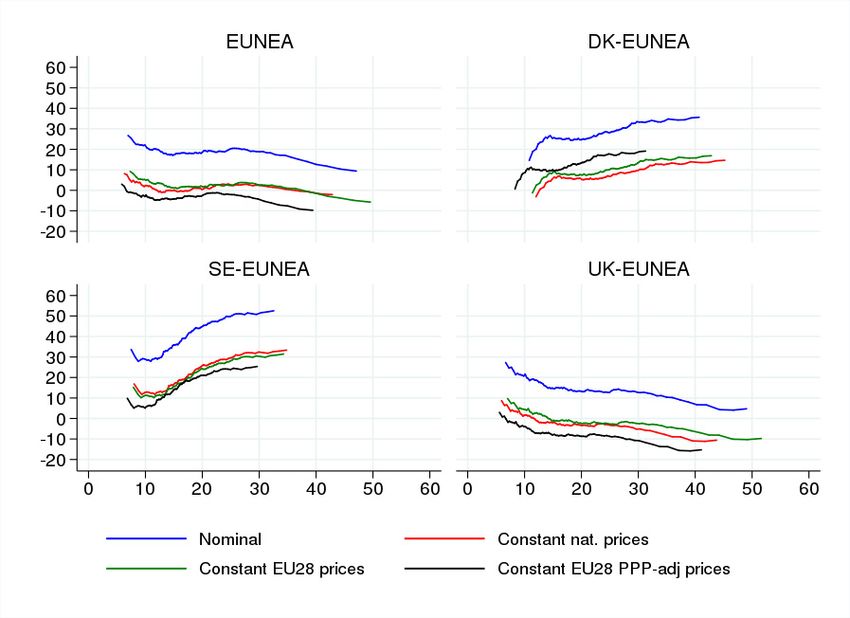
‡
1.     Introduction

           European countries are engaged in a process of economic and political integration
which has no parallel at the global level. It has taken place by steps over the last sixty years,
moving from the original six countries that signed the Treaty of Rome on 25 March 1957 and
formed the European Economic Community in 1958 to the 28 countries comprising the
European Union (EU) in 2018, before the withdrawal of the United Kingdom (UK). The
common currency, the euro, was introduced in 1999 and is currently used by 19 countries.
Integration has undeniably gone hand in hand with the continent’s economic development,
though establishing causal links is arduous. But how has the well-being of European citizens
changed during such a long process?
           In this paper we address this question by taking personal income as a proxy of well-
being. Well-being is multifaceted and can be hardly reduced to income alone, but there is
little doubt that it fundamentally depends on people’s income – “a crucial means to a number
of important ends” (Anand and Sen 2000: 100). Thus, investigating the evolution of the
distribution of income among Europeans would go some way toward assessing the social
progress of the EU. This approach is rarely taken, however. Aside from data limitations, one
important reason lies in the design of the integration process.
           Creating a fairer and inclusive society is the declared aim of integration, but the
political priority at the European level has always been the establishment of a common
market. This has constantly been seen as the primary route to enhance economic growth and
hence people’s well-being, while devolving the attainment of social objectives to

‡    Acknowledgements
     Earlier drafts of this paper were presented at the 56th Annual Conference of the Italian Economic Association
     (Naples, 22 October 2015), the Department of Economics and the European Union Centre of Excellence of
     Dalhousie University (Halifax, Nova Scotia, 12 February 2016), the book-project workshop ‘Europe Volume
     – Global Trends in Income, Wealth, Consumption, Wellbeing and Inequality’ (Paris, 20 April 2017), the 35th
     IARIW General Conference (Copenhagen, 20-25 August 2018), the 3rd Workshop of the EC’s Community
     of Practice on Fairness ‘Income inequality and its policy determinants – beyond a MS level
     analysis’ (Brussels, 11 September 2018) and the workshop ‘Economic and Social Inequality in
     Europe’ (Ravenna, 12 October 2018). In addition to participants in these meetings, we are indebted to
     Giovanni D’Alessio, Georg Fischer, Marco Magnani, Wiemer Salverda, Robert Strauss, Roberto Tedeschi
     and John Verrinder for their many valuable comments. We thank Luis Ayala Cañon, Zsombor Cseres-
     Gergely, Stefano Filauro, Fabrice Murtin, Andrew Sharpe and Francesco Vercelli for sharing their estimates
     with us and Wim Bos for explanations about the Dutch official inequality statistics. The views expressed
     here are solely those of the authors and they do not necessarily reflect those of the Bank of Italy or the
     Eurosystem.

                                                          5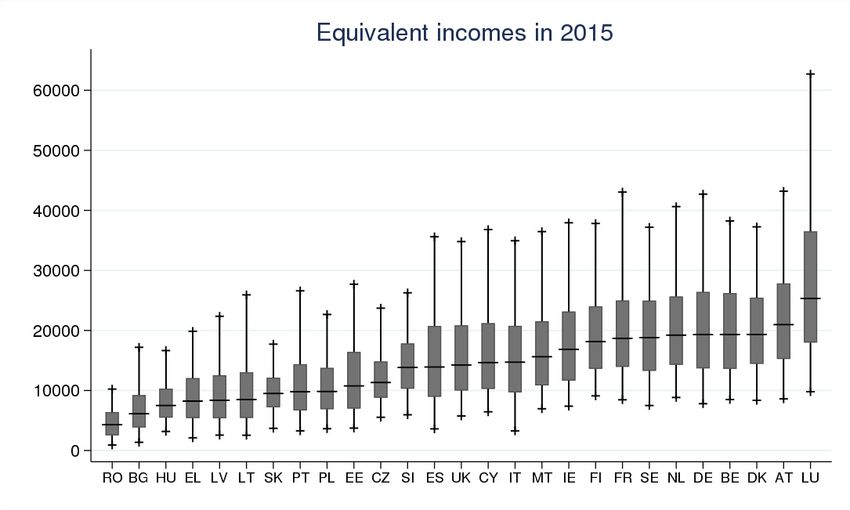
redistributive policies and welfare measures decided at the national level, though subject to
limitations due to EU membership. This approach has led to decouple the assessment of
macroeconomic convergence and territorial cohesion, focusing on countries or regions, from
the evaluation of social exclusion and inequality, concerned with people living in nations
taken in isolation.
         Accordingly, Eurostat calculates the EU-wide statistics for poverty and inequality as
“the population-weighted arithmetic average of individual national figures” (Eurostat 2017).
This practice amounts to overlook differences in income levels among countries, either in the
setting of poverty thresholds or in the calculation of overall inequality. As Atkinson warned
as early as 1989, whenever the at-risk-of-poverty threshold is set as a proportion of the
national median, “the impact of growth on poverty in the Community [depends] solely on
what happens within each country”, whereas it would be affected “by the relative growth rates
of different member countries” (1995: 71) if the threshold was proportionate to the overall
EU-wide median.1 Likewise, taking an inequality index that is exactly decomposable by
population subgroups, Eurostat practice simply means ignoring the between-country
component of European inequality. This exact decomposition does not hold for the two
inequality measures standardly released by Eurostat, the income quintile ratio and the Gini
index,2 but even with these indices the level of EU inequality measured as average of national
levels clearly does not depend on how much, say, the average Dutch is richer than the average
Slovakian: only within-country income gaps matter.
         In this paper we adopt a different perspective: we study the distribution of living
standards among European citizens by measuring income distribution in the EU as if it was a
single country rather than taking it to be the average of national values. One straightforward
implication is that measured inequality does not depend on where a person lives within the

1
  Differently from statistics based on household incomes, two European indicators use common standards across
the EU: the severe material deprivation indicator counts persons who experience at least 4 out of 9 deprivation
items due to lack of resources; the low work intensity indicator counts children and adults living in households
where adults work a small proportion of their annual work potential. Together with the at risk-of-poverty rate,
both indicators concur to define the headline indicator of the Europe 2020 strategy “People at risk of poverty or
social exclusion”. The notion of material deprivation was introduced to mitigate the shortcomings from using
purely national standards in poverty measurement (e.g. Guio 2005, Goedemé and Rottiers 2011).
2
  The income quintile ratio is the ratio of total income received by the richest 20 per cent to that received by the
poorest 20 per cent of a country’s population; the Gini index is the mean absolute difference of all pairs of
incomes divided by the overall mean and varies, for non-negative values, between 0 (perfect equality) and 1
(maximum inequality). Two common additively decomposable inequality measures are the mean logarithmic
deviation and the Theil index; both belong to the broader class of the generalised entropy indices.

                                                          6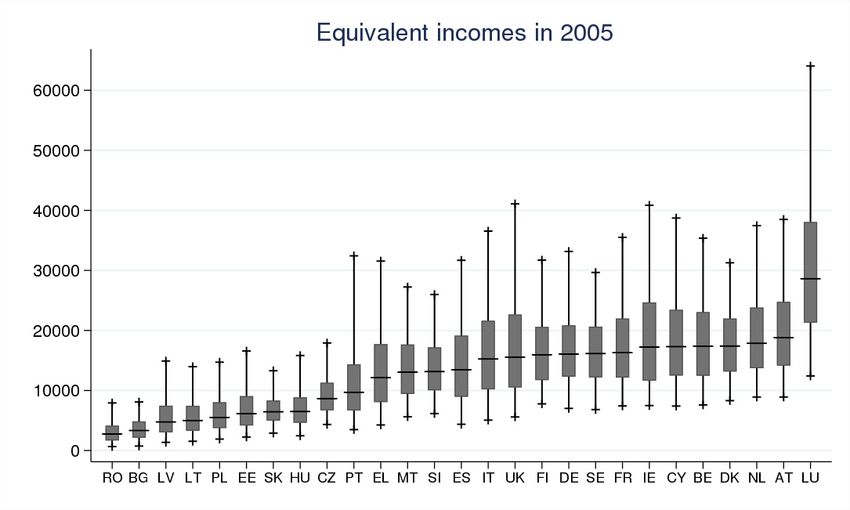
EU, whereas it does by using an average of individual national figures (Brandolini and Carta
2016). At a more conceptual level, it means that the well-being of European citizens is
assessed by reference to the whole of European citizens rather than to the people living in
their same country, consistently with the fact that they share a single market and can move
freely within the EU.3 This different approach to inequality measurement may appear purely
technical but it has, in fact, a deep political meaning which is discussed in the conclusions.
         The remaining of the paper is organised as follows. We start Section 2 by
summarising the main dates of European integration. So far we have loosely used the term
EU, but in the empirical analysis we need to be precise about the supranational aggregate to
which we refer to. Throughout, we indicate by EU the European Union (Community before
1993) in general, according to its varying historical composition, by EU15 the group of 15
countries that formed the EU in 1995-2003, and by EU28 the group of 28 countries that form
the EU since July 2013 (but before the withdrawal of the UK). Similarly, EA stands for the
Euro Area in its historical composition, EA12 for the group of 12 member states participating
in the monetary union in the early 2000s, and EA19 for the group of 19 countries which
currently share the common currency. We then use national accounts to describe the European
economic development since the Second World War, taking the United States (US) as a
reference. These data show the considerable improvement of the average living standards in
the EU, both in terms of goods and services produced and in lower time spent at work. On
average, differences among people living in different countries also diminished. This long-run
process slowed down with the sovereign debt crisis and the associated divergence between the
“core” and the “periphery” of the EA.
         While national accounts provide valuable evidence on the evolution of average living
standards as the integration process has deepened, they are silent on how unequal the
distribution of living standards has been among Europeans. We move to this question in
Section 3. We first compare the distributions of real incomes in EU countries (except Croatia)
in 2005 and 2015, using microdata from the EU Statistics on Income and Living Conditions

3
  This is an explicitly normative choice which does not require that Europeans actually take the whole EU as a
reference to assess their living standards. Some authors have seen the “Europeanisation of reference groups” as a
justification for adopting the EU-wide approach to the measurement of poverty and inequality, based on the
finding that in the upper middle classes of new accession countries people were and felt poorer than those
belonging to the lower middle classes in most advanced European countries (Fahey, Whelan and Maître 2005,
Delhey and Kohler 2006, Fahey 2007). As Fahey (2007: 45) writes, “in the EU as a whole those who are
disadvantaged on uniform EU-wide measures also tend to feel disadvantaged in proportion”. The issue is
controversial (Heidenreich and Wunder 2008, Whelan and Maître 2009a,b, Nolan and Whelan 2011). Following
a distinction suggested by Goedemé and Rottiers (2011), our choice is closer to the notion of “publicly oriented”
reference groups than to the concept of “privately oriented” reference groups which is used in the psychological
literature on the assessment of personal outcomes.

                                                       7
(EU-SILC), and show that income disparities are considerable. We then turn to long-run
changes and find evidence of some U-shaped pattern in most of the 12 countries considered,
though the shape of the U greatly varies. Our brief review of the literature suggests that the
reversal of the post-war downward trends has been driven by a combination of general
economic forces, such as globalisation and technical change, and national policy choices.
Despite their national specificities, these choices shared common objectives, such as making
labour markets more flexible and reducing the redistributive role of government. Irrespective
of the drivers, the substantial dispersion of personal incomes and its changes over time must
be taken into account in investigating the well-being of Europeans.
We examine the EU-wide income distribution and its evolution in Section 4. The
evidence for old decades is fragile but it seems to confirm some narrowing of income
distribution until the mid-1980s, consistently with the macroeconomic evidence and with
national patterns. With the more reliable data available for recent years, between 2005 and
2015 inequality shows a descending trend in the EU28 but a rising one in the EU15 and the
EA. Expressing incomes at nominal market exchange rates raises estimates of inequality
relative to adjusting incomes for international differences in price levels, but has little effects
on trends. Around 2015 incomes appear to be more unevenly distributed in the US than in the
EU, and especially so in the EA. This outcome stems from the greater income redistribution
achieved by European welfare states. We delve into inequality developments in the EU during
the last decade in Section 5, where we analyse the consequences of the Great Recession in
2008-09 and the sovereign debt crisis in 2011-12 for the geographic clustering of income
inequality in the EU and for specific socio-demographic categories.
In Section 6 we draw the main analytical conclusions and place our EU-wide analysis
of inequality into the broader context of the social dimension of European integration. We
discuss technical measurement aspects in Appendix 1 and review estimates of the EU-wide
distribution in Appendix 2.
2. An aggregate view of post-war developments
The process of European integration started in 1957 when Belgium, France, Italy,
Luxembourg, the Netherlands and West Germany signed the Treaty of Rome. The Treaty
created the European Economic Community that came into force on 1st January 1958.
Denmark, Ireland, and the UK joined in 1973, Greece followed in 1981, and Portugal and
Spain in 1986. The Eastern German Länder became part of the European Community as a
8consequence of the country’s reunification in October 1990.4 In 1993 the Maastricht Treaty
established the European Union, which was joined by Austria, Finland, and Sweden in 1995.
The enlargement in 2004 brought ten new member states in the Union: Cyprus, the Czech
Republic, Estonia, Hungary, Latvia, Lithuania, Malta, Poland, Slovakia and Slovenia.
Bulgaria and Romania joined in 2007, and Croatia in 2013. On 1st January 1999 eleven
countries irrevocably fixed the exchange rates of their currencies and adopted the euro:
Austria, Belgium, Finland, France, Germany, Ireland, Italy, Luxembourg, the Netherlands,
Portugal and Spain. Eight countries joined in the following years: Greece (2001), Slovenia
(2007), Cyprus (2008), Malta (2008), Slovakia (2009), Estonia (2011), Latvia (2014) and
Lithuania (2015).
The different stages of the integration process are evident in the stepwise increase in
the EU population and employment (Figure 1; the vertical lines indicate the changes in EU
membership). By virtue of this gradual accession of new countries, between 1958 and 2015
the population sharing the EU membership tripled from 170 to 514 million persons, although
the population living in the whole of the 28 countries currently comprising the EU (EU28)
only rose by around 30 per cent. The number of people in employment follows broadly
similar long-run tendencies. The impact of the Great Recession is evident in the sharp drop in
employment in 2009, followed by return to pre-crisis levels only in 2013 in the US and two
years later in Europe. European employment fell considerably also during the early 1990s, a
period characterised by extensive restructuring in transition economies, by the German re-
unification, and by the currency crisis that forced Italy and the UK to leave the European
Exchange Rate Mechanism in September 1992. The employment-to-population ratios show
wide fluctuations, though not as large as in the US. In Europe, the trend was downward until
the mid-1980s. The higher ratios characterising planned economies decreased during the
transition to a market economy, and aligned with those observed in the EU15 by mid-1990s.
In subsequent years employment ratios went up till the Great Recession. In 2015, 45 per cent
of all persons were employed in the EU vis-à-vis 47 per cent in the US. Note that these ratios
refer to the whole population rather than the working-age persons: hence, they reflect also
changes in the demographic structure (e.g. ageing). While employment ratios are not too
different from their values in the 1950s, despite wide fluctuations, the average annual hours of
4
In the remaining, West Germany and East Germany refer to the Federal Republic of Germany and the
Democratic Republic of Germany before reunification, and the Western and Eastern Länder afterwards.
9work per employed steadily fell. Since the 1950s they have declined by over a fourth in the
EU15, against around a tenth in the US, as a result of both a shortening of working times and
a spreading of part time occupations. The considerable fall in the proportion of lifetime spent
at work since the Second World War indicates a rise in leisure time and an improvement in
the well-being of a typical European.
Mean gross domestic product (GDP) per capita grew until the Great Recession and
then flattened out, both in the EU15 and the EU28 (Figure 2, top panels). (Throughout, all
statistics from national accounts are population-weighted values.) From 1958 to 2008, it
increased 3.5 times in the EU15 against 3 times in the US. However, the European
convergence stopped in the early 1980s: the gap vis-à-vis the US widened from 17 per cent in
1982 to 27 in 2015. For the EU28, GDP per capita in 2015 fell short of the US level by 33 per
cent. These statistics also provide us with a first rough indication of the dispersion of
economic well-being among Europeans. This is obtained by looking at cross-country
convergence, as measured by the Gini index of real GDP per capita (Figure 2, bottom panel;
results would not change by considering the coefficient of variation). From 1958 income
disparities fell considerably within the EU15, but in the second half of 2000s returned to
widen. In the EU28, cross-national income gaps sharply rose around the collapse of
communist regimes but then significantly narrowed, thanks largely to the catching-up of
Eastern European economies. The lessening of disparities since the early 1990s for the EU28
appears to match by intensity that for the EU15 in the two decades following the Second
World War.5 As summarised in the European Commission’s Employment and Social
Development in Europe 2016, “all in all, while the gradual catching-up process appeared
consistent with previous decades for the Member States that joined the EU since 2004, since
the mid-2000s and the crisis in 2008-09, convergence patterns in the Euro area have come to a
halt. The divergence largely reflected the adverse impact of the crisis on Southern and Eastern
EA Member States” (Bontout et al. 2016: 74).
5
These national accounts data are estimated by The Conference Board, which regularly updates calculations
originally made by Maddison (2001). While there is virtually no difference for the US, the story partly changes
for the EU according to the Penn World Table (Figure A1 in Appendix 1). The EU15 mean GDP per capita grew
much more substantially, by 4.5 times between 1958 and 2008; there is no income stagnation in the aftermath of
the Great Recession. The gap relative to the US was initially much larger, almost 60 per cent in the early 1950s,
but has kept narrowing, down to 23 per cent in 2014; the corresponding value for the EU28 is 29 per cent. As to
income disparities, their decline in the EU15 during the 1950s and 1960s is more pronounced, while the rise after
mid-2000s is slightly less intense. The different methodology used to adjust for variations in price levels, across
countries and over time, is an important factor behind discrepancies between the two sources.
10The long-run improvement in average living standards as approximated by aggregate
output per capita is substantial, as is the reduction in their dispersion across the EU. Though
population-weighted, cross-national differences in real GDP per capita are however a very
rough measure of inequality in Europe: first, they are based on GDP rather than households’
incomes and, second, they ignore within-country inequality. We start with the former and
examine the latter in the next section.
GDP measures the size of the economy in terms of the value of goods and services
internally produced, and is only an imperfect proxy of the revenues available to (resident)
households to sustain their living standards. It does not account for the net flow of incomes
earned and paid abroad and it includes the resources used by governments to supply in-kind
services and collective goods as well as the profits (gross of capital depreciation) retained by
businesses to sustain their investment plans. Resident households as a whole dispose of a
spendable income which is on average less than two thirds of GDP in the EU (including small
sole proprietorship enterprises and non-profit institutions serving households, NPISH); in
small open economies such as Luxembourg and Ireland this proportion falls well below 40
per cent. The difference is not only in levels but also in dynamics, as shown for instance by
the more limited fall of household gross disposable income (HGDI) during the Great
Recession, due to the effects of automatic stabilisers and stimulus packages (Jenkins et al.
2013, Atkinson 2013). In national accounts, HGDI offers a better indicator of living standards
than GDP.6
Comparable time series for HGDI are released by Eurostat for all EU countries from
1995 onwards, with few exceptions. Real HGDI per capita, which is adjusted for cost-of-
living differences both across countries and over time as described in Appendix 1, is higher in
the EU15 than the EU28, but the gap has been narrowing as a consequence of the faster
growth of Eastern European economies (Figure 3). After a decade of relatively steady growth,
the Great Recession hit severely the EU15, with real HGDI per capita falling by almost 5 per
cent between 2008 and 2013. In the remaining EU countries as a whole, income slowed down
6
By including the value of social transfers in kind, “adjusted” HGDI would be an even better indicator of living
standards. As these transfers are generally not covered in household surveys, we focus here on HGDI to maintain
consistency with the subsequent distributive analysis. An extensive literature shows that extending the income
concept to include transfers in kind for education, health care and housing (valued at market prices or actual
cost) narrows the measured income distribution. For instance, Aaberge, Langørgen and Lindgren estimate that in
European countries “inclusion of non-cash income reduces inequality by 15-25 per cent” and “poverty rates ... by
30-50 per cent” (2010: 339).
11but kept rising. This was not sufficient to maintain the Gini index for the EU28 on a steady
descending trend because cross-national household income disparities within the EU15
abruptly increased during the sovereign debt crisis of 2012-13. Figure 3 also reports data for
the EA and the EA19 since the introduction of the euro in 1999. The time patterns for the
EA19 resemble those for the EU15, but exhibit a larger fall in mean income and a steeper rise
in the Gini index from 2007 to 2013.
The overall income growth since 1995 is lower for real HGDI per capita than for real
GDP per capita both in the EU15 and the EU28. The narrowing of the distribution prior to the
Great Recession appears more pronounced for HGDI than GDP, while the intensity of the
subsequent rise looks about the same. In 2015 income dispersion in the EU15 is a fifth higher
than in 1995 based on real GDP per capita, but a fifth lower if measured with real HGDI per
capita; income convergence within the EU28 is sizeable for both measures but greater for
HGDI than GDP. Thus, the fall in inequality across EU nations during the last two decades is
stronger for household incomes than domestic output.
To sum up, average GDP per capita in the EU15 almost quadrupled from the
beginning of the integration process, closing some of the gap vis-à-vis the US (though it still
exceeded a quarter in the EU15 and was a third in the EU28 in 2015). Coupled with the large
decline in time spent at work these figures suggest a sizeable improvement in the well-being
of the average European. Until the Great Recession, these income gains were larger in
relatively poorer countries of the EU15 and the EA19, considerably reducing cross-country
inequality. Significantly, this long-term process reversed during the sovereign debt crisis,
following the divergent performances of the “core” and the “periphery” of the EA. As a
consequence, convergence within the EU28 temporarily stopped, before resuming driven by
the catching-up of new accession countries.
3. Inequality in national income distributions
National accounts provide crucial insights on the long-run evolution of Europeans’
incomes, hence indirectly of their well-being. This is especially the case if aggregate values
refer to the part of national disposable income received by households, HGDI. The cross-
national variation of HGDI per capita is a first proxy of European income inequality, but a
very imperfect one. It measures average income gaps between countries, but it ignores how
unequally incomes are distributed among a country’s inhabitants. Accounting for income
12distributions within countries is essential to estimate the EU-wide distribution at a point in
time and to ascertain its temporal pattern.
Figure 4 offers a snapshot of the national income distributions in all EU countries
excluding Croatia in 2005 and 2015. To ensure the comparability of living standards,
household incomes are adjusted for differences in household composition, by means of a
standard equivalence scale, and for differences in cost of living across countries, by using
proper price indices, as explained in Appendix 1. The box plots in Figure 4 show, for each
country, the median value (the horizontal mark), the distance between the 25th and the 75th
percentiles (the thick vertical bar) and the 5th and 95th percentiles (the two extremes of the
thin vertical bar) of the distribution of real equivalised incomes among persons. Countries are
arranged in ascending order of median real equivalised income. This ranking follows a known
pattern, with Eastern European countries preceding Southern European countries, and then the
remaining EU countries rather close to each other except for Luxembourg which is clearly
leading. This pattern is broadly similar in 2005 and 2015, but there are some notable changes,
which are the legacy of the Great Recession and the following sovereign debt crisis: Greece
moves down several positions, just above Romania, Bulgaria and Hungary, whereas Germany
goes up towards the top.
Income differences are sizeable not only between countries, as we know from national
accounts data, but also within countries. In 2015 the Romanian median is only 17 per cent of
the Luxembourger median, and this figure falls to 9 per cent if the comparison is made at the
5th percentile. For three quarters of Eastern Europeans household incomes are below or at
most comparable to the incomes of the poorest quarter of those living in Central and Nordic
countries. As this exercise assesses living standards within the EU as a whole, the comparison
in Figure 4 necessarily refers to absolute differences. In international comparisons of
inequality, the real income gaps among countries are typically removed by expressing income
levels as percentages of national medians. In such a case, income differences within Eastern
European countries would not look so small compared to those within the other EU countries.
In 2015 the 5th percentiles in Bulgaria and Romania are 21-22 per cent of the national
medians and just 8-9 per cent of the 95th percentiles. These two countries exhibit the largest
values of relative inequality, ahead of Southern and Baltic States, taking the ratio between the
95th and the 5th percentiles, but a similar ranking would emerge looking at the Gini index.
The EU-wide measures of inequality that we discuss in the following sections account
for disparities both within and between countries. How much of the overall inequality is
explained by each component? Using exactly decomposable indices, they can be neatly set
13apart as they add up to the total. The within-country component is the weighted sum of the
inequalities within each country, while the between-country component is the inequality that
would result if each person had an income equal to his or her country’s mean income, with
weights depending on the index. Estimates based on two of such decomposable indices, the
mean logarithmic deviation and the Theil index, show that the within-country inequalities
accounts for a proportion of total inequality which is around 90 per cent in the EA and the
EU15, and around 75 per cent in the more heterogeneous EU after eastern enlargements
(Beblo and Knaus 2001; Brandolini 2008; Hoffmeister 2009; Bönke and Schröder 2014;
Papatheodorou and Pavlopoulos 2014; Filauro 2018; Filauro and Parolin 2018).
Clearly, the assessment of the evolution of well-being among Europeans cannot ignore
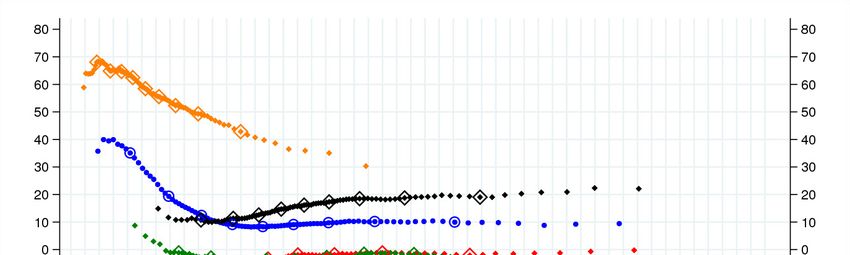
how national income distributions have varied over time. In Figure 5 we illustrate the long-
run inequality patterns in 12 EU countries as measured by the Gini index for disposable
income and the share in taxable income of the top 1 per cent of adult individuals.7 The
patterns tracked by the two types of series are far from being perfectly coincident, which is
not surprising given that they measure inequality differently and refer to dissimilar income
concept. Overall, however, the evidence gathered in Figure 5 consistently suggests that
income distribution narrowed until around the 1980s. This is the case for all EU15 countries
shown in Figure 5. Several factors contributed to reduce income inequality during the post-
war Golden Age: on the one hand, strong and prolonged economic growth was accompanied
by high levels of employment, rapidly rising wages and decreasing earnings dispersion, and in
general a shift from capital to labour; on the other hand, expanding welfare states and
progressive taxation boosted the redistributive role of governments. The increase in
government transfers, in particular the development of old-age pension systems, was effective
in narrowing the distribution of disposable income (e.g. Gustafsson and Palmer 1997, Muffels
and Nelissen 1997, Uusitalo 1989, for Sweden, the Netherlands and Finland, respectively).
While all eight EU15 countries share these developments to some extent, the relative
importance of each factor differs across countries and sub-periods. As regards the earnings
7
In Figure 5, the Gini indices from national studies are generally not comparable across countries but are
internally consistent, except for few statistical breaks (either ignored or adjusted for the absolute difference
between old and new series in overlapping years). These figures are shown alongside the Gini indices from the
Income Distribution Database (IDD) of the Organisation for Economic Co-operation and Development (OECD),
which are in principle cross-nationally comparable. The data for the top 1 per cent income share are drawn from
the World Inequality Database (WID). They are not comparable across countries, e.g. due to different definitions
of taxable income and tax unit, and suffer from discontinuities (not shown), e.g. due to changes in national tax
laws. See notes to Figure 5 for details on sources and data characteristics.
14distribution, for instance, Atkinson (2008: 51) remarks that “the late 1960s and 1970s were a
period of earnings compression in a number of countries (Finland, France, Italy, Sweden, and
the United Kingdom)”, but then observes that the top decile had been rising from 1950 to the
mid-1960s in France and the UK, although not in West Germany. According to Piketty (2003:
1016), in France “wage dispersion significantly widened between 1950 and 1967-68, and the
sharp increases in the minimum wage implemented in the summer of 1968 and during the
1970s led to a significant decline in wage inequality until 1982-83, when the newly elected
socialist government decided to freeze the minimum wage (wage dispersion has increased
somewhat since then)”.
The downward movement of income inequality after the Second World War came to a
halt during the 1980s. The turning point showed up first in the UK roughly at the same time
as in the US, in coincidence with the electoral victories of Margaret Thatcher and Ronald
Reagan. Earning disparities widened considerably and went along with a shift away from
employment towards both unemployment and self-employment (Jenkins 1995, 1996); the
impact on the distribution of household disposable incomes was amplified by government
policies aimed at reducing social spending and taxes on top incomes (Johnson and Webb
1993; Atkinson 2003). Inequality rose sharply in the UK until the 1990s and then flattened
out; the reforms of income support and tax credits implemented by the Labour government
played an important role in offsetting an otherwise ascending trend between the late 1990s
and the mid-2000s (Bargain 2012, Belfield et al. 2017).
In West Germany, disposable income inequality during the 1980s and 1990s either
rose moderately, or remained substantially stable, depending on the source of data;
government redistribution played an important role in mitigating market income inequality
(Biewen 2000, Bach, Corneo and Steiner 2009, Fuchs-Schündeln, Krueger and Sommer 2010,
Corneo, Zmerli and Pollak 2014). Income distribution widened considerably during the first
half of the 2000s, driven by developments in the labour market and changes in the tax system
(Biewen and Juhasz 2012, Bach, Corneo and Steiner 2013). Since 2005 inequality has
remained stable, even during the Great Recession, largely as a result of the expansion of
employment opportunities (Grabka, Goebel and Schupp 2012, Biewen, Ungerer and Löffler
2017). In France, income inequality begun to rise at the end of the 1990s: Frémeaux and
Piketty (2014) suggest that it was partly due to the lack of progressivity of the overall tax
system, a feature that was reinforced during the 2000s. In the Netherlands, the Gini index
recorded a leap in the late 1980s but otherwise did not show any persistent upward tendency.
The evidence from the top income series does not modify this conclusion, once we take into
15account that the upsurge in 2001 reflects a break in the series and the blip in 2007 is due to a
temporary tax relief on dividends (Salverda 2017). Salverda et al. (2014) notices that tax-and-
benefit reforms aimed at activating citizens to work (by restricting eligibility and shortening
duration of benefits, lowering top tax rates, and introducing working tax credits) reduced the
redistributive effects of social policy, but might have sustained work participation and hence
labour incomes.
In Italy, income inequality, as measured by the Gini index, rose sharply during the
currency crisis of the early 1990s but much less during the double-dip recession from 2008 to
2013, despite a similar growth in (absolute) poverty ratios (Brandolini, Gambacorta and
Rosolia 2018). The widening of income distribution in the latter crisis offset the narrowing in
the previous decade, and was fairly contained in the face of the severity of the recession. The
figures for the top income share also indicate a rise of inequality since the mid-1908s, but
there are perceptible differences from the series for the Gini index in some sub-periods (e.g.
second half of the 1980s). In Spain, the Gini index decreased after the return to democracy
and then hardly changed during the long economic expansion prior to the Great Recession,
save for temporary rises in economic downturns. This Spanish diversity, relative to the
patterns observed in other advanced countries, disappeared with the Great Recession and the
sovereign debt crisis, when the Gini index sharply increased (Pijoan-Mas and Sánchez-
Marcos 2010, Ada Ferrer-i-Carbonell, Ramos and Oviedo 2014, Ayala Cañon 2016). The top
1 per cent income share has moved differently from the Gini index, largely because of the
inclusion of capital gains that primarily account both for its dynamics and the 1987, 2000 and
2005 spikes (Alvaredo and Saez 2009).
After the UK, Finland and Sweden are the two EU15 countries in Figure 5 that exhibit
the steeper increases in inequality since the 1980s, although starting from very low levels. In
both countries important drivers of inequality were the introduction of a dual income tax
system in the early 1990s, which created strong incentives to shift earnings towards capital
income and contributed to the rise of the top income shares, and the downsizing of social
protection, which hit especially people at the bottom of the distribution (Blomgren et al. 2014,
Jäntti et al. 2010, for Finland; Eriksson and Pettersson 2000, Roine and Waldenström 2008,
Fritzell et al. 2014, for Sweden). In some years tax reforms also pushed investors to realise
capital gains on equities, causing the spikes shown in the series.
16As to Eastern Europe, a narrowing of income distribution in the 1960s and 1970s
characterises Czechoslovakia and Hungary (Atkinson and Micklewright 1992),8 while a sharp
rise of inequality following the end of communist regimes is clearly visible in both countries
and Poland. The available data show a flat trend during the 2000s in the Czeck Republic and
Slovakia, where taxation and transfers significantly mitigated market income inequalities
(Kahanec et al. 2014), a stability followed by a fall after 2004 in Hungary (Fábián et al.
2014), and a modest growth in Poland since early 1990s (Letki, Brzeziński and Jancewicz
2014). In East Germany, the Gini index also increased after the reunification (Biewen 2000),
but by less than in the other three Eastern European countries; its movements match fairly
close those in West Germany.
We draw three conclusions from this overview of national trends in a selected group
of EU countries. First, some U-shaped pattern is perceptible in virtually all countries, but
timing, magnitude and persistence of inequality movements differ. As Atkinson observed, “...
it is misleading to talk of ‘trends’ when describing the postwar evolution of the income
distribution. ... It may be better for a number of countries to think in terms of ‘episodes’ when
inequality fell or increased” (1997: 303). While common forces may have affected all
European economies, countries’ circumstances and policy choices led to distinct national
patterns. Second, the causes of the reversal of post-war inequality downward trends seem to
lie in labour markets becoming more “flexible”, in taxation reforms favouring high taxpayers,
in the rolling back of welfare states. These tendencies are typically seen as the inescapable
response to exogenous forces such as globalisation and technological progress, but they also
reflect radical changes in economic theory, policy-making and social norms, which pre-date
the establishment of the EU in 1993 and the adoption of a common currency in 1999. The
findings of Beckfield (2006, 2009) and Bertola (2010) that the deepening of European
integration has been associated with a rise of within-country income inequality must be seen
against this background. European integration may have facilitated the adoption of
increasingly homogeneous policies, but it is reasonable to expect that countries would have
gone roughly in the same directions irrespective of integration. The similarity between the
patterns observed in Figure 5 for Sweden and Finland, two Nordic countries that differ for
8
As regards data availability and quality during the communist regime, Atkinson and Micklewright (1992: 74)
note that “in the case of the earnings distribution, not only is information available for Czechoslovakia, Hungary
and Poland, but the similarities in the sources we use with the corresponding survey in Britain … are more
striking than differences”. More generally, they observe that income data in these three countries have significant
deficiencies, but all in all do not compare too unfavourably with corresponding British data.
17their participation in the monetary union, seems to back up this conjecture. Third,
independently from the explanation of national experiences, Figure 5 confirms that income
inequality has changed considerably within countries during the last half a century. This needs
to be taken into account in the estimation of the EU-wide distribution over time.
4. Estimates of the EU-wide income distribution
Estimating the EU-wide distribution is a demanding exercise. Apart from important
methodological choices (e.g. the adjustment for differences in cost of living across countries,
the alignment of survey data to national accounts), it crucially depends on the availability of
information on national income distributions. Ideally, one needs a database with cross-
nationally comparable person- or household-level income data for all EU countries, such as
EU-SILC in recent years. This permits applying consistently the same measurement
assumptions to all income observations. Lacking microdata, the main alternative is to use
summary statistics on national distributions. Borrowing approaches typically employed to
estimate global inequality, a “synthetic” EU-wide income distribution can be constructed by
stacking the income means of all population quantile groups, ranked by income, comprising
each national distribution, or by estimating national parametric distributions from available
summary statistics. The gains from going back in time using existing tabulated data are
counterbalanced by the impossibility of amending inconsistencies in underlying national
distributions (e.g. due to differences in equivalence scales) and the understatement of
measured inequality if income differences within quantile groups are ignored.9 Due to data
availability, direct estimates based on comparable microdata can only cover a relatively recent
period, since the 1990s for the EU15 and the next decade for the EU28; synthetic estimates
may extend over a longer period, but are less accurate. In Figure 6, we report a selection of
estimates of the Gini index for the EU15 (top panel) and the EU28 (bottom panel) as a whole,
and for the US as reference. In Appendix 2 we survey available estimates, their sources and
the underlying methodological assumptions.
9
On methodological problems arising in studies of income distribution in supranational entities, see Brandolini
(2007) for the EU and Milanovic (2005), Anand and Segal (2008, 2015) and Atkinson (2017) for the world.
18For the EU15, the synthetic estimates by Morrisson and Murtin (2004), Darvas (2016)
and Vercelli (2018) align distributive information to national accounts but differ in method
and source of real GDP series; those by Bonesmo Fredriksen (2012) do not make any
adjustment to national accounts and cover only 10 countries. The calculations by Vercelli
suggest a steady decline of the Gini index between the late 1950s and the 1980s; the series
shows ups and downs thereafter, but in 2014 it is back to the values of the mid-1980s.
Vercelli (2018: 7) observes that “there is statistical evidence of structural break ... in 1984”
and concludes that the reduction in the Gini index occurred “almost entirely” between 1958
and 1984. Also Morrisson and Murtin estimate a fall between 1970 and 1980, though on
much lower levels. For the period 1980-1995 they observe a stasis rather than Vercelli’s small
decline. Also Darvas calculates a substantial stability from 1988 to the mid-2000s, followed
by an increase till 2015. For a subgroup of ten EU15 countries, Bonesmo Fredriksen finds a
rise of the Gini index between 1985 and 1995, and a further increase afterwards. Moving to
direct estimates on microdata, Beckfield (2009) calculates a fall between 1980 and 2000
(gathering national data from different years around these two indicated years) and Troitiño
Cobas (2007) finds a steady decline during the 1990s (considering only 11 countries for 1993-
96), similarly to Vercelli. For the second half of the 1990s, however, Benczúr, Cseres-Gergely
and Harasztosi (2017) observe little change, despite using the same microdata as Troitiño
Cobas. From 2005 onwards the estimates by Benczúr, Cseres-Gergely and Harasztosi (2017)
and our own indicate a coherent pattern, leaving aside marginal differences in levels:
inequality unequivocally increases.
Figures for the EU28 as a whole are available only for the most recent period. The
synthetic estimates by Darvas (2016) suggest a sharp rise from 1988 to the early 1990s, a
steady decline until the Great Recession, and little change thereafter. Our own estimates on
the EU-SILC microdata and those by Bönke and Schröder (2014), not shown, Benczúr,
Cseres-Gergely and Harasztosi (2017), Filauro (2018) and Filauro and Parolin (2018)
consistently point to a reduction of inequality from 2005 to 2009 followed by stability until
2015, contrary to what has been observed for the EU15. These findings square with the
aggregate evidence discussed earlier, hinting at the importance of macroeconomic
developments in driving inequality changes.
The estimates discussed so far are based on incomes expressed at Purchasing Power
Parities (PPPs). PPPs provide the relative values, in national currencies, of a fixed bundle of
goods and services, and allow us to account for the fact that price structures differ across
countries. This is not the case if we instead convert incomes to a common unit of account (e.g.
19the euro) by using fixed-euro parities for the EA countries and market exchange rates for non-
EA countries. This latter choice tends to understate real incomes in relatively poorer European
states, since for instance labour-intensive non-tradable services are typically cheaper than in
richer countries. On the other hand, it corresponds to the standard way of measuring
inequality within a country, which usually ignores internal differences in the cost of living.
See Appendix 1 for technical details.
The choice of the conversion rate matters. Brandolini (2007) and Bonesmo Fredriksen
(2012) calculate that the estimated Gini index is higher when incomes are expressed in euro
than in PPS by 3 to 5 percentage points in the EU28 but less than 2 in EU15, where cross-
national differences in price levels are more contained. The importance of these
methodological differences is further illustrated in Figure 7 for the EU15 and the EU28 (top
panels) and the EA12 and the EA19 (bottom panels). In each panel, the series labelled PPS
refers to incomes adjusted for differences in price levels across countries using the PPP
indices for Household Final Consumption Expenditure (HFCE), while the series labelled Euro
refers to incomes in euro converted by using the fixed-euro parities for EA countries and the
average annual market exchange rates for non-EA countries. The series labelled PWM is the
population-weighted mean of national values, which corresponds to the EU/EA figures
regularly released by Eurostat. The last series is the Gini index in the US, as estimated by
Andrews, Palesch and Thomas (2015) replicating as closely as possible Eurostat methodology
on data from the Annual Social and Economic Supplement of the Current Population Survey
(CPS-ASEC) of the US Census Bureau. This series refers to incomes unadjusted for price
level differences across the US states.
There is little change in inequality between 2005 and 2015 according to population-
weighted averages, but this result is biased by the neglect of between-country inequality.
Once the latter is considered, inequality is increasing in the EA19, as well as in the EA12 and
the EU15, and decreasing in the EU28. The more pronounced widening of the income
distribution is measured for the EA12, where the Gini index rose by about 2.5 percentage
points between 2005 and 2015. As found in earlier studies, the Gini index is higher when
incomes are converted to euro at nominal exchange rates, by more than 1 percentage point in
the EA19 and about 4 points in the EU28. The trend looks the same for the EA19 but is
somewhat different for the EU28, with inequality for incomes in euro going up, rather than
down, after 2009. Focusing on the PPS series, in 2015 the Gini index was equal to 34.9 per
cent in the EU28 and 32.5 per cent in the EA19, which are values located in the upper part of
the range of national values estimated across all EU countries (from 24 to 38 per cent).
20As shown in Figures 6 and 7, inequality is consistently higher in the US than in the
EU28 when using PPP indices. As incomes are not adjusted for differences in price levels
across the US states, one might also consider the Euro series rather than the PPS series: this
comparison is apparently more coherent, but ignores that territorial price variation is much
larger in the EU than the US. In this case, the US and the EU28 would show similar levels of
income inequality in 2015, about 39 per cent. Regardless of the measure, income distribution
in the EA19 (as well as EA12 and EU15) is considerably less unequal than in the US;
abstracting from year-to-year fluctuations, its widening since 2005 parallels that observed in
the US. The lower level in the inequality of disposable incomes is achieved in the EU also
thanks to far more redistributive tax-and-benefit systems in EU member states than in the US
(e.g. Brandolini and Smeeding 2009). Filauro and Parolin (2018) estimate that inequality in
the EU28 is slightly higher than in the US for market incomes (i.e. before taxes and transfers),
while it is lower for disposable incomes (in both cases, incomes are adjusted for internal price
differences). They remark that this reflects “the relative strength of European welfare states:
in 2014, European tax and transfer systems reduced the level of income inequality by 36
percent (from 0.54 to 0.35), while the post-fisc inequality fell relative to pre-fisc inequality by
29 percent (from 0.53 to 0.38) in the US” (Filauro and Parolin 2018: 8). While European
welfare states tend to be more redistributive than the US one, they are however different from
each other, inducing Caselli et al. (2016: 187) to observe that: “Country-level redistribution
means that the geographic clustering of disposable incomes is even greater than the
geographic clustering of market incomes. In other words, country-level redistributive policies
reduce inequality, but give rise to a more heterogeneous Union”.
To sum up, the evidence for old decades is fragile but it seems to confirm some
narrowing of the EU15 income distribution until the mid-1980s. This is coherent with the
downward trends observed for both between-country inequality (convergence in real GDP per
capita) and within-country inequality (descending national patterns), although such a neat
decomposition is not appropriate for the Gini index. With the more reliable data available for
recent years, between 2005 and 2015 inequality exhibits an overall descending trend in the
EU28 but a rising one in the EU15 and the EA. These recent tendencies are little affected by
expressing incomes at nominal market rates rather than at purchasing power parities. The
inequality of disposable incomes in the EU and, especially, the EA falls below the levels
observed in the US, thanks to the operation of the European tax-and-benefit systems.
215. A look inside EU inequality developments in the last decade
As seen, between 2005 and 2015 the distribution of equivalised incomes became less
unequal in the EU28 but more unequal in the EU15. By considering changes in the bottom
and top deciles, Benczúr, Cseres-Gergely and Harasztosi (2017: 5-6) observe that this EU15
development “... comes from the lower and only to little or no extent from the upper part of
the distribution. Again, this process was driven mostly by changes for the Mediterranean, so
powerful that it could induce a decrease and subsequently an increase in the overall EU15
inequality, despite the relatively small share of this country group”. This confirms the
importance of what Caselli et al. (2016: 172) call “geographic clustering” of income levels, or
“the fact that the relatively rich households and the relatively poor ones are geographically
segregated”. Accordingly, we investigate the dynamics of income distribution in the EU by
taking a rather accepted, if arbitrary, clustering of countries: we split the 12 oldest EA
members into CORE (Austria, Belgium, Finland, France, Germany, Luxembourg, the
Netherlands) and PERIphery (Greece, Ireland, Italy, Portugal, Spain); we include in EUNEA
the three EU15 non-EA countries (Denmark, Sweden, the UK) and in NEU15 the remaining
12 new accession countries (Bulgaria, Cyprus, Czech Republic, Estonia, Hungary, Latvia,
Lithuania, Malta, Poland, Romania, Slovakia, Slovenia), which comprise seven EA members
and five non-EA countries (Croatia is not included).
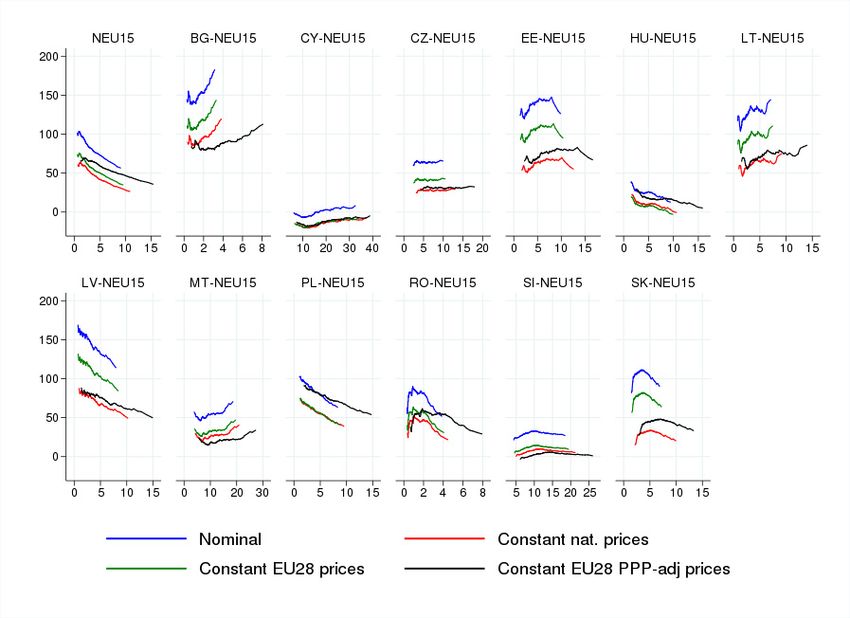
Figure 8 displays the Growth Incidence Curves (GICs) for each country cluster. The
GICs show the percentage cumulated growth rates between 2005 and 2015 for every
percentile of the distribution of real equivalised disposable household incomes. Note that
incomes are “real” in a double sense: they have the same purchasing power in all EU
countries, as they are converted by means of PPP indices, and in both years, as they are
adjusted for the average inflation in the EU28 (see Appendix 1 for details). The observed
reduction in the EU28 inequality reflected the much stronger growth of the bottom fourth of
the distribution with respect to the other three fourths. In turn, this stemmed mostly from the
major improvements recorded in new accession countries (NEU15), where income growth
was much stronger than in other EU countries along the whole distribution. In the other
groups, developments in equivalised disposable incomes were more contained and
homogeneous along the distribution, though qualitatively different: in the PERI countries,
income fell throughout the distribution, but very strongly at the bottom; income also declined
22in the EUNEA countries, except for some rise at the bottom;10 on the contrary, in the CORE
countries growth was positive at all income levels and increasing by moving toward the top.
Figure 8 provides a clear representation of how the recent divergence between core and
periphery EU15 economies affected their income distributions: the income gap enlarged
particularly at the bottom of the respective distributions, but widened also at the top. The
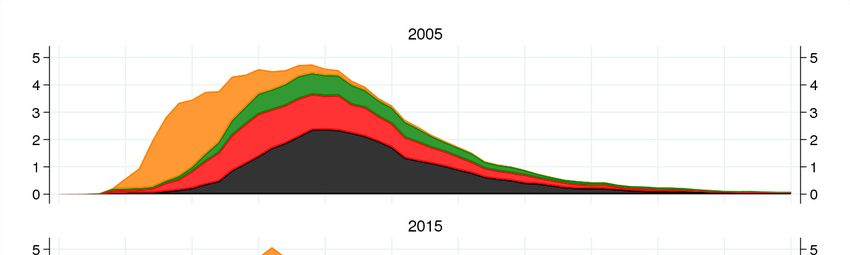
resulting changes in the overall EU distribution are shown in Figure 9, where we exploit the
fact that the EU-wide density of equivalised income can be expressed as the weighted sum of
country-group specific densities, with weights equal to population shares. The massive shift
of the NEU15 population towards the middle of the EU-wide distribution and the raising
share of the PERI population in its lower tail are evident by comparing 2005 and 2015.
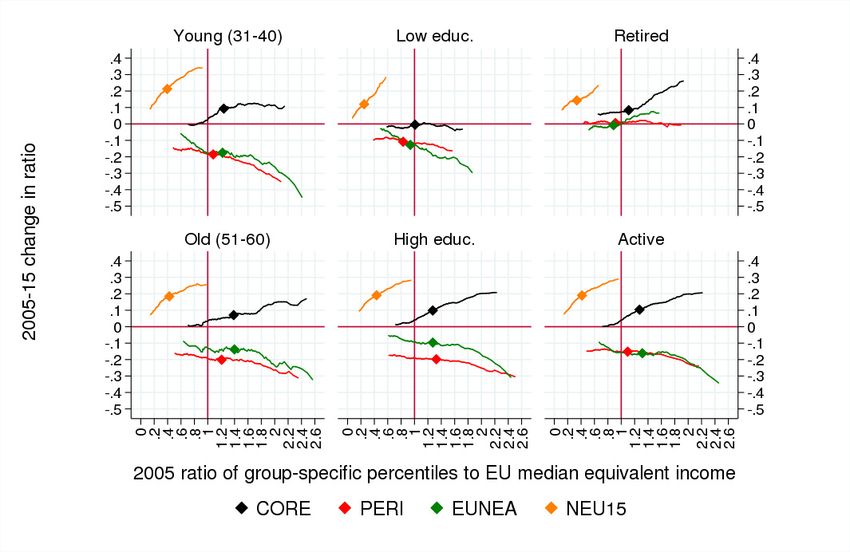
To examine these changes in greater detail, we adopt an income-based definition of
social class and divide the EU population into a low income class (individuals with
equivalised disposable income below 60 per cent of the EU median value), a lower middle
class (60 to 120 per cent), an upper middle class (120 to 300 per cent), and a high income
class (above 3 times the EU median value). In line with our EU-wide perspective, we
implement this classification using for all countries the same income thresholds, as calculated
on the EU28 distribution of equivalised disposable income (Table 1, panel A). In 2005, 122
million persons, or 25 per cent of EU population, were at risk of poverty, that is had an
equivalised disposable income below 60 per cent of the EU-wide median value. About 63 per
cent of them were from new accession countries, where they accounted for three quarters of
that country-group population; another 20 per cent was from periphery countries, and only 10
per cent from core countries. In 2015, the number of persons at risk of poverty fell to 112
million individuals, or 23 per cent of the EU population: only 48 per cent was from new
accession countries, while 31 per cent was from periphery countries. Over the period, the
incidence of low income in NEU15 countries fell from 75 to 54 per cent, while that in
periphery countries increased from 19 to 26 per cent. At the upper end of the income ladder,
the high income class accounts for less than 3 per cent of the EU population. The share in this
class of people residents in core countries went up from 41 to 62 per cent, whereas that of
persons living in periphery countries decreased from 29 to 21 per cent. Finally, the different
10
This negative pattern is dominated by results for the UK, whereas the profiles for Denmark and Sweden are
very positive. See Figure A2 in Appendix 1. This evidence for the UK may be affected by a statistical break in
the EU-SILC series; other sources, such as national accounts and the estimates by the Institute for Fiscal Studies
used in Figure 5, do not indicate any decrease in British household incomes.
23You can also read