COVID-19: Upending Investments in Human Capital Across Eastern and Southern Africa - UNICEF Eastern and Southern Africa Regional Office Social ...
←
→
Page content transcription
If your browser does not render page correctly, please read the page content below
COVID-19: Upending Investments
in Human Capital Across Eastern
      and Southern Africa

                               © UNICEF/UNI336733/Translieu/Nyaberi

                 UNICEF
Eastern and Southern Africa Regional Office
       Social Policy Working Paper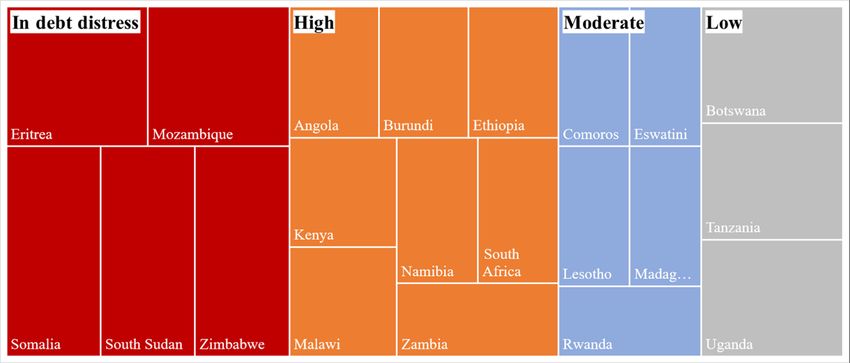
COVID-19: Upending Investments in Human Capital Across Eastern and Southern Africa
© United Nations Children’s Fund (UNICEF), Eastern and Southern Africa Regional Office (ESARO),
October 2020

UNICEF ESARO, PO Box 44145, Nairobi, Kenya – 00100

The findings, interpretations and conclusions expressed in this report are those of the author and do not
necessarily reflect the policies or views of UNICEF or the United Nations.

The text has not been edited to official publication standards, and UNICEF accepts no responsibility for
errors.

The designations in this publication do not imply an opinion on the legal status of any country or territory,
or of its authorities, or the delimitation of frontiers.
Acknowledgements
This paper was written by Bob Libert Muchabaiwa (Public Finance Specialist) under the guidance
of Matthew Cummins (Social Policy Regional Adviser) from the Social Policy Section of UNICEF’s
Eastern and Southern Africa Regional Office (ESARO).

The author is grateful for the substantive comments and contributions received from the following
(in alphabetical order): Alessandro Ramella Pezza (Social Policy and Economic Specialist,
UNICEF Malawi), Aurelien Serge Beko (Social Policy Specialist, UNICEF Lesotho), Beatrice
Targa (Chief of Social Policy, UNICEF Malawi), Beifith Kouak Tiyab (Education Specialist,
UNICEF ESARO), Buthaina Al-Iryani (Policy Specialist, UNICEF HQ), Charlotte Tayllor (Chief of
Social Policy, UNICEF Rwanda), Claire Schouten (International Budget Partnership), David
Robins (International Budget Partnership), Deborah Camaione (Public Finance Fellow, UNICEF
ESARO), Dominic Richardson (Chief of Social Policy and Economic Analysis, UNICEF Office of
Research-Innocenti), Emmanuel Munyemana (Social Policy and Economic Specialist, UNICEF
Rwanda), Jecob Nyamadzawo (Social Policy Manager, UNICEF Namibia), Jennifer Asman
(Policy Specialist, UNICEF HQ), Joanne Bosworth (Chief of Public Finance and Local
Governance, UNICEF HQ), Jorge Eduardo Bueso Zuniga (Social Policy Fellow, UNICEF
ESARO), and Juliana Nyasha Tirivayi (Social Policy Manager, UNICEF Office of Research-
Innocenti).
Acronyms
AU         Africa Union
AUC        African Union Commission
CCRT       Catastrophe Containment and Relief Trust
CO         Country office
CRC        Convention on the Rights of the Child
CSO        Civil society organisation
DSSI       Debt Service Suspension Initiative
ESA        Eastern and Southern Africa
EU         European Union
ECD        Early childhood development
ECF        Extended Credit Facility
EFF        Extended Financing Facility
GDP        Gross domestic product
GNI        Gross national income
HIPC       Heavily Indebted Poor Countries
IBP        International Budget Partnership
IDA        International Development Association
IMF        International Monetary Fund
LIC        Low-income country
LMIC       Lower-middle-income country
OBS        Open Budget Survey
OBI        Open Budget Index
ODA        Official development assistance
ODI        Overseas Development Institute
OECD       Organisation for Economic Cooperation and Development
PEFA       Public Expenditure and Financial Assessment
PEFF       Pandemic Emergency Financing Facility
PER        Public Expenditure Review
PPP        purchasing power parity
RCF        Rapid Credit Facility
RFI        Rapid Financing Instrument
SDR        Special Drawing Right
SSA        Sub-Saharan Africa
UMIC       Upper-middle-income country
UNECA      United Nations Economic Commission for Africa
WASH       Water, sanitation and hygiene
WEO        World Economic Outlook
WHO        World Health Organization
Contents
Executive summary .................................................................................................................................... 1

Chapter 1. Introduction ............................................................................................................................... 3
   1.1 COVID-19 hitting the region hard.........................................................................................................................3
   1.2 Exacerbating pre-existing risks and vulnerabilities ..............................................................................................4
   1.3 Structure of the paper ..........................................................................................................................................5
Chapter 2. Domestic Revenue: Collapsing and no end in sight ............................................................ 6
   2.1 Fewer taxable economic activities .......................................................................................................................6
   2.2 Loss of revenue due to tax relief and fiscal stimuli packages ..............................................................................9
   2.3 The collapse of global commodity prices ........................................................................................................... 11
   2.4 Non-tax revenue losses ..................................................................................................................................... 12
   2.5 Key takeaways .................................................................................................................................. 13
Chapter 3. Official Development Assistance: Flatlining ....................................................................... 14
   3.1 ODA before there was a crisis ........................................................................................................................... 14
   3.2 ODA in the context of COVID-19 ....................................................................................................................... 15
   3.3 The outlook for ODA .......................................................................................................................................... 20
   3.4 Key takeaways................................................................................................................................................... 21
Chapter 4. Debt: Spiraling out of control ................................................................................................ 22
   4.1 Debt before there was a crisis ........................................................................................................................... 22
   4.2 Debt in the context of COVID-19 ....................................................................................................................... 26
   4.3 The outlook for debt ........................................................................................................................................... 28
   4.4 Key takeaways................................................................................................................................................... 29
Chapter 5. Investing in Human Capital: The near-term outlook ........................................................... 31
   5.1 Human capital spending before there was a crisis ............................................................................................. 31
   5.2 Human capital spending in the context of COVID-19......................................................................................... 33
   5.3 The outlook for human capital spending ............................................................................................................ 34
   5.4 Key takeaways................................................................................................................................................... 39
Chapter 6. Fiscal Transparency and Accountability: Keep the receipts… or forget to print? .......... 40
   6.1 Fiscal accountability ........................................................................................................................................... 40
   6.2 Budget transparency .......................................................................................................................................... 42
   6.3 Public participation............................................................................................................................................. 43
   6.4 Key takeaways................................................................................................................................................... 44
Chapter 7. The Looming Fiscal Shock: Austerity measures ................................................................ 45
   7.1 Fiscal consolidation ........................................................................................................................................... 45
   7.2 Reversal of tax relief measures and introduction of new taxes .......................................................................... 46
   7.3 Further privatization and increased focus on public-private partnerships .......................................................... 47
   7.4 Key takeaways................................................................................................................................................... 47
Chapter 8: Conclusions and Recommendations ................................................................................... 48

References ................................................................................................................................................. 50
Annex 1. Key Macroeconomic Indicators for ESA Countries............................................................... 55
Annex 2: IMF Support to ESA Countries ................................................................................................ 56
Annex 3: World Bank support to ESA Countries* ................................................................................. 57
Executive summary
This working paper discusses the impacts of COVID-19 on public investments in human
capital in the Eastern and Southern Africa (ESA) region. It is based on a review of economic
outlook reports and forecasts as well as new projections of social sector spending trends in 2020
and 2021. The main objective is to stimulate discussion among UNICEF country offices (COs),
governments and development partners on appropriate fiscal policy and budgetary responses to
safeguard the situation of children.

Key findings

•   COVID-19 has added extreme pressure on an already precarious public finance situation in
    ESA, with the potential to derail human capital gains achieved in recent years. Prior to the
    pandemic, most governments invested insufficiently in core human capital sectors.
•   The economic contraction is likely to result in at least US$35 billion in lost tax revenue in 2020
    in ESA, which amounts to US$66 per person, on average. The situation in natural resource-
    intensive economies (e.g. Angola, South Sudan) is much more dire, as they are anticipated
    to lose over a third of their projected revenue due to the crash in global oil prices.
•   The pandemic should lead to greater government spending on health, WASH and social
    protection in most countries. Projections indicate that domestic health expenditure in ESA
    countries will increase by an average of 10 percent in 2020, while spending on social
    protection and WASH will increase by 63 and 49 percent, respectively.
•   In contrast, spending on areas like child protection, education and nutrition is anticipated to
    be lower than in 2019. For example, education spending in the region is expected to fall by
    seven percent in 2020, on average, or about US$10 billion (in 2011 constant prices).
•   External resource flows to the region fall far short of the immense financing needs. By mid-
    October, the International Monetary Fund (IMF) had approved about US$7.4 billion to 13 ESA
    countries along with US$105 million of debt relief under the Catastrophe Containment and
    Relief Trust (CCRT). At the same time, the World Bank had approved US$640 million to 9
    countries under the COVID-19 Fast-Track Facility.
•   The average fiscal deficit for ESA countries is expected to widen from -4 percent of gross
    domestic product (GDP) in 2019 to -6 percent in 2020. Due to massive budget reallocations
    and irregular resource flows, most governments will also experience the largest public
    spending deviations in their history during 2020.
•   Deficit financing will exacerbate debt burdens across the region. The average external debt
    stock alone is projected to increase from 50 to 65 percent of GDP between 2018 and 2021.
•   There is also a very high risk that governments will reverse recent progress on budget
    transparency. This reflects the reality that governments are operating in emergency mode and
    receiving multiple resource inflows, which has led to budgeting, spending and reporting taking
    place outside of normal processes.

Recommendations to governments

•   Immediately take advantage of concessional financing opportunities offered by the
    international financial institutions and others to create fiscal space to increase spending on
    human capital sectors to safeguard child well-being and support a swift economic recovery.

                                                  1
• Proactively open discussions with public and private creditors about the growing debt burden,
including policy options for restructuring existing debt and extension of moratoriums
beyond the initial 12months provided by the IMF, World Bank and the G20.
• Review medium-term revenue and expenditure forecasts to reflect the impacts of COVID-
19 on public finances and safeguard human capital investment from forthcoming austerity
measures.
• Ensure fiscal adjustments, budget reallocations and new fiscal policy measures are assessed
for any possible negative impacts on children and vulnerable households.
• Strengthen budget execution during the emergency and recovery period by enhancing
coordination, prioritisation processes and procurement efficiencies.
• Strengthen budget transparency and fiscal accountability mechanisms through regular
tracking, monitoring and reporting on COVID-19 inflows and expenditures at national and sub-
national levels.
Recommendations to UNICEF and other development partners
• Support finance ministries to access external concessional loans and grants from bilateral,
multilateral and private donors, including through the development of compelling funding
proposals and investment cases.
• Provide technical assistance to finance and social sector ministries to review, implement and
monitor COVID-19 financing plans and budgets across human capital sectors.
• Regularly monitor fiscal policy measures and budgetary adjustments to ensure that they
are in the best interest of children, and to inform advocacy and programme strategies.
• Advocate with governments and donors to ensure that social protection packages are
recognised as central components of COVID-19 response and recovery plans.
• Assist governments to procure essential supplies and materials required to effectively
respond to COVID-19, including personal protective equipment, testing kits, sanitation and
hygiene products, and learning materials.
• Advocate for transparency, accountability and public participation in all COVID-19-
related public finance processes, including the timely publication of budget documents online.
• Strengthen partnerships and coordination among development partners in financing of
COVID-19 response and recovery plans to increase efficiency and effectiveness of spending
of on and off-budget COVID-19 resources.
2Chapter 1. Introduction
This working paper discusses the current and potential impacts of COVID-19 on human
capital investments in Eastern and Southern Africa (ESA). In particular, it assesses the
implications of the pandemic on government revenues, social sector spending, budget
transparency, and fiscal accountability from a children’s perspective. The main aim of the paper
is to stimulate discussion among UNICEF country offices (COs), governments and development
partners on how fiscal policy and budgetary responses can be effectively formulated and
implemented to safeguard the situation of children in the face of an unprecedented socioeconomic
crisis in the region. There is a deliberate focus on public finance; it does not delve into private
finance or matters of monetary policy or other macroeconomic issues related to COVID-19.
The paper is based on a desk review of economic outlook reports and forecasts as well as
new projections of social sector spending trends in 2020 and 2021. Historical data is drawn
from the IMF (World Economic Outlook), World Bank (World Development Indicators),
Government Spending Watch, World Health Organisation (Global Health Expenditure Database),
and the Organisation of Economic Cooperation and Development (OECD). Additional information
was collected from the latest budget statements and expenditure estimates by ministries of
finance in select ESA countries.
1.1 COVID-19 hitting the region hard
Cases of COVID-19 have exponentially increased across ESA countries in recent months.
By 20 October 2020, the region had recorded slightly over 955,000 cases up from about 17,000
in mid-May. Nearly three quarters of the reported cases (73 percent) were in South Africa – which
had the twelfth highest number of reported cases globally. However, for most countries in the
region, chances are high that the actual cases are considerably higher due to low testing capacity.
Most importantly, the devastating health and socioeconomic impacts of the pandemic are being
felt by households, enterprises and governments across the region.
Governments in ESA are still facing the twin challenges of containing the pandemic and
mitigating the unfolding socioeconomic crisis. Most of the initial responses of governments
focused on health dimensions, including ratcheting up testing capacity, implementing contact
tracing and social distancing, and marshalling severe containment measures. Encouragingly,
many governments also realized the need to address the socioeconomic impacts caused by the
pandemic, including through the expansion of social protection programs.
COVID-19 is having a massive impact on public finances, which requires swift and
strategic policy responses. On the one hand, considerable resources are urgently required to
finance continued testing and treatment of cases, social protection, and to sustain the delivery of
essential public services such as education, water, and routine health services. On the other,
ailing businesses and enterprises need to be supported to survive and recover from the severe
economic shock, while millions of families in ESA require support to cope with extreme weather
events, conflicts and other shocks. ESA governments must perform a balancing act between
short-term financing needs and long-term recovery plans in a manner that advances rather than
3undermines the 2030 Agenda for Sustainable Development. In all this, it is imperative that
governments sustain investments in sectors and programs which improve the well-being of
children, especially during the looming austerity era in 2021 and beyond.
1.2 Exacerbating pre-existing risks and vulnerabilities
Prior to COVID-19, much of the region was already grappling with a variety of shocks. To
begin with, COVID-19 struck at a time when four countries (Comoros, Malawi, Mozambique, and
Zimbabwe) had not recovered from Cyclones Idai and Kenneth, which wreaked havoc in the first
half of 2019 (UN OCHA 2019). Moreover, an estimated 50 million people in the ESA region are
currently struggling to meet minimum dietary requirements, with many on the brink of starvation,
due to compounding impacts of droughts, floods and locust invasions (IPC 2020; UN OCHA
2020). South Sudan is the hardest hit, with 58 percent of the population facing a serious food
security crisis, followed by Zimbabwe at 29 percent (IPC 2020; UN OCHA 2020).
COVID-19 arrived when poverty was already widespread in ESA, with children bearing the
greatest brunt. On average, three out of four children in the region were deprived in at least two
dimensions such as health, education, housing, nutrition and child protection before COVID-19
(Cummins 2019). In 2019, approximately 42 percent of the regional population lived on less than
US$1.90 per day. If the cut-off is increased to US$3.20, the share of the poor population increases
to 65 percent (Cummins 2019; World Bank 2020a). COVID-19 is exacerbating this precarious
situation, with preliminary estimates by the African Development Bank (AFDB 2020) indicating
that about 28.2 to 49.2 million people in Africa will slide back into poverty due to loss of jobs,
livelihoods, remittances, and depletion of assets caused by COVID-19. Multidimensional child
poverty has also increased. Latest analysis by UNICEF and Save the Children (2020) reveals that
the number of children living in multidimensional poverty – without access to education, health,
housing, nutrition, sanitation, or water – has increased by 15 percent since the start of the
pandemic.
Last, but not least, except for a few, economic growth has been lackluster for most ESA
countries. In 2019, the average per capita real GDP growth rate was estimated by the IMF (2020,
June update) to be 0.8 percent for all ESA countries, down from about 1.7 percent in 2018. Such
economic growth was not fast enough to create jobs, expand the tax base, and accelerate poverty
eradication efforts.
The above is only the tip of the iceberg: a multitude of other shocks and structural issues
were exacerbating vulnerabilities of people and challenging public finances in the region
before COVID-19. These include political instability and insurgencies in Ethiopia, Mozambique,
Somalia, and South Sudan, the crash in global energy prices, corruption, and human rights
abuses. In various ways, all the above are undermining the fiscal prospects of many ESA
countries and making it hard for governments to finance COVID-19 response and recovery plans
in both the short and long term.
41.3 Structure of the paper
The rest of this paper examines the implications of COVID-19 on public finances. Chapter
2 discusses how COVID-19 has led to reductions in domestic revenue. Chapter 3 examines the
outlook for official development assistance (ODA). Chapter 4 investigates the implications of the
pandemic on the debt situation. Chapter 5 discusses the spending outlook with a focus on social
sectors. In Chapter 6, the paper delves into matters of fiscal accountability, transparency, and
public participation. Chapter 7 analyzes the likelihood of austerity and what this could mean for
social sector budgets and children. In the final chapter, a set of recommendations are provided
for both policymakers, UNICEF and development partners in ESA.
5Chapter 2. Domestic Revenue: Collapsing and no end in sight
This chapter examines how domestic revenue has been impacted by COVID-19. As outlined
in the Addis Ababa Action Agenda on Financing for Development (2015), domestic revenue is the
most sustainable way of financing investments in human capital sectors. At present, and on
average, governments of ESA countries finance about three-quarters of their expenses from
domestic revenue (World Bank 2020a). The chapter is divided into three sections. It starts by
estimating lost tax revenue caused by the reduction in economic output. This is followed by a
discussion on lost tax and non-tax revenue due to fiscal stimulus measures. The last part
assesses impacts of COVID-19 on revenues from the extractive sector.
2.1 Fewer taxable economic activities
The coronavirus pandemic has triggered an economic recession across ESA with severe
knock-on effects on tax revenue. While global economic activity is expected to contract by 4.4
percent, growth in ESA is projected at -2.4 percent, on average (Figure 1). If population growth is
factored in, projected economic growth falls to -4.7 percent. South Africa’s economy, which is the
largest in ESA, is predicted to shrink by 8 percent. However, of all ESA countries, Zimbabwe,
whose economy was on its knees before COVID-19, will be hardest hit, with growth projected to
contract by more than 10.4 percent in 2020. The 2020 economic outlook for ESA is a stark
contrast to 2019 when all countries except two (Angola, Namibia and Zimbabwe) experienced
positive growth.
Figure 1: Projected real economic growth in ESA countries, 2019 and 2020 (as a %)
9.0
4.0
-1.0
2019
-6.0
2020
-11.0
Source: IMF World Economic Outlook October 2020 Database
Disruptions in global supply chains and trade, combined with containment measures, have
taken a toll on economic activity in ESA. This, in turn, has negatively affected both tax and
non-tax revenues. Restrictions to travel, for instance, have led to sharp declines in tourism-related
receipts. Many of the ESA countries which depend on agricultural exports, such as flowers,
6vanilla, tobacco, and cocoa, have witnessed the demand for their produce tumble (Deloitte 2020;
Price Waterhouse Coopers 2020). The informal sector has also been badly hit, with many reports
of severe and prolonged loss of income which are also reducing consumption taxes. Although not
necessarily a tax issue, anticipated reductions in remittances will similarly reduce household
consumption and the related taxes (UNECA 2020a).
Before COVID-19, taxes amounted to just over 15 percent of gross domestic product (GDP)
in ESA countries, on average (Figure 2). The average tax-to-GDP ratio for ESA countries is,
however, lower than the sub-Saharan African average (18.7 percent). There are also significant
variations within the region. Based on the latest figures, governments of low-income countries in
ESA collected tax equal to 11.4 percent of GDP compared to 16.3 percent among lower-middle-
income countries (LMICs) and 26.4 percent in upper-middle-income countries (UMICs). Somalia
and South Sudan collect the least tax revenue from their GDP, with less than 1 percent in both.
Countries in the Southern African Customs Union (SACU): Botswana, Eswatini, Lesotho,
Namibia, and South Africa have the strongest tax capacity, collecting more than 25 percent of
GDP, on average (World Bank 2020a).
Figure 2: Tax revenue capacity in ESA countries, 2019 or latest (as a % of GDP)
30
25
20
15
10
5
-
LIC
South Sudan
Rwanda
Somalia
Malawi
Mozambique
Angola
Botswana
LMIC
Madagascar
Kenya
Zimbabwe
Ethiopia
South Africa
Tanzania
Burundi
Comoros
Zambia
Lesotho
ESAR
UMIC
Sub-Saharan Africa
Eritrea
Namibia
Uganda
Eswatini
LIC LMIC UMIC Averages
Source: World Bank, WDI Database (April 2020)
From a global perspective, tax collection capacity in ESA remains quite low, driven by
many challenges. The low tax revenue is partly attributed to the informality of economies, limited
capacity to enforce tax laws, political interference in tax collection due to vested interests, as well
as tax evasion and avoidance leading to illicit financial flows (Save the Children 2020; ODI 2013).
With COVID-19 in the picture, these challenges will only worsen, most likely making 2020 one of
the worst tax years in recent years.
Based on the projected decline in GDP by the IMF (2020 June update), it is estimated that
tax revenue in the ESA region will fall by 5.8 percent in 2020 (Figure 3). In constant
international dollars, this is estimated to be US$35.8 billion.1 Given that the analysis is based on
a constant tax-to-GDP ratio, actual losses in current prices will be significantly higher. About three-
1
This figure is arrived at by applying average tax-to-GDP ratio before the pandemic to projected GDP before COVID-19 (IMF WEO,
October 2019) and after (IMF June update) in US$, constant prices.
7quarters of this expected loss will be incurred by South Africa, mainly because it is the largest
economy in ESA. However, in percentage terms, the biggest declines are projected to be in
Lesotho, Zimbabwe, and Botswana (12.5, 12.2, and 11 percent, respectively) (Figure 3).
Figure 3: Projected change in tax revenue due to economic contractions, 2020 (as a %)
10%
5%
0%
-5%
-10%
-15%
-20%
Source: Author, based on IMF’s World Economic Outlook October 2019 database and June 2020 Update
In per capita terms, upper middle-income countries are expected to lose considerably
higher tax revenues than other income groups. For instance, Botswana will lose approximately
$674 per person, South Africa $428 and Namibia $412 (Figure 4). On average, the region will
lose about $100 per person,2 which is more than the US$86 estimated minimum amount of
resources required to provide life-saving interventions in the health sector to a population
(Cummins 2019).
Figure 4: Projected loss in tax revenue in per capita terms, 2020
(in US$, 2015 constant prices)
100
0
-100
-200
-300
-400
-500
-600
-700
Source: Author, based on IMF World Economic Outlook June 2020 Update
2
Per capita losses are arrived at by dividing projected tax revenue with projected population in 2020.
8Preliminary reports testify that revenues are indeed falling fast. For example, in April alone,
tax revenue collected by the eSwatini Revenue Authority was 19 percent below target. This was
largely attributable to underperformance in value-added tax (Economic Intelligence Unit 2020d).
In neighboring South Africa, the Treasury estimates that revenue collection for 2020/21 fiscal year
is forecasted to be US$17.6 billion lower than the 2019/2020 budget estimate, which amounts to
revenue loss of about US$300 per person (National Treasury RSA 2020a). In Zambia, revenue
collections were four percent below the target during the month of February alone while
collections from mining company tax and VAT were below target by 32 and 13 percent,
respectively (Ministry of Finance Zambia 2020). In Rwanda, the Ministry of Finance and Economic
Planning estimates that domestic taxes and non-tax revenues will decline by 11 percent from
FRW 1825.2 billion in fiscal year 2019/20 to FRW 1632.2 billion in 2020/21 (State Finance Law
2020/21).
The sectors and tax heads that are most affected will vary by country. Preliminary reports
suggest that declines in tax receipts will be largest in corporate tax, especially from tourism and
hospitality and other service industries, value-added tax, and personal income tax (Economic
Intelligence Unit 2020a, b, c, d; Deloitte 2020). In Mozambique for instance, the tourism sector
lost approximately US$30 million a month between March and June 2020 in revenue due to
company closures and restrictions in movement. Additionally, an estimated 64 percent of job
losses in Mozambique have been recorded in the tourism sector (Economic Intelligence Unit,
2020a). Revenues from exports of tobacco, cocoa, flowers, and vanilla, which are key export
items for Malawi, Tanzania, Kenya, and Madagascar, respectively, have also gone down. In
Kenya, the flower sector was losing approximately US$25 million per day due to travel restrictions.
By the end of May, Kenya’s flower exports were half the amount before COVID-19, with
approximately 30,000 temporary workers laid off and another 40,000 permanent staff sent on
unpaid leave (Deloitte 2020:08).
2.2 Loss of revenue due to tax relief and fiscal stimuli packages
Many governments introduced fiscal stimulus programs to support households and
businesses from the economic shock, which commonly included comprehensive tax relief
measures. By the end of July 2020, most ESA countries had introduced various tax relief
measures in response to COVID-19 such as reduction in value added tax (VAT), deferment of
payments, tax exemptions for COVID-19 supplies, and fast tracking of VAT refunds (Table 1). In
Kenya, for example, the government introduced a 100 percent tax relief for persons earning up to
Ksh24,000 (~US$240) per month (from the base of approximately $130), while it also reduced
the corporate income tax rate from 30 to 25 percent, the turnover tax rate for SMEs from three to
one percent, the top rate on personal income from 30 to 25 percent, and VAT from 16 to 14
percent (Kenya Revenue Authority 2020). In total, tax relief measures will cost Kenya
approximately Ksh122.2 billion in lost tax revenue (~US$1.2 billion) over 12 months. Tax relief to
persons earning up ~$240 alone is expected to contribute an estimated US$194 million in lost
revenue over 12 months (Parliamentary Budget Office of Kenya, 2020). In its Supplementary
Budget approved in June 2020, the Government of South Africa estimates around ZAR R26 billion
(~US$1.5 billion) in lost revenue due to tax relief measures implemented as part of the COVID-
19 relief package (National Treasury RSA 2020a).
9Table 1: Type of tax relief measures introduced by ESA governments, 2020
Reduction in Removal or Review of income Deferment or Removal of Accelerated Tax credits to Tax deduction
VAT, corporate reduction of tax-free brackets extension of interest or VAT support for COVID-19-
and turnover import and tax payments penalties for reimburse- imports related
tax excise duties delayed payment ments donations
Angola
Burundi
Botswana
Comoros
Eritrea
Ethiopia
Kenya
Lesotho
Madagascar
Mozambique
Malawi
Namibia
Rwanda
Somalia
South Sudan
Eswatini
Tanzania
Uganda
South Africa
Zambia
Zimbabwe
Total 1 11 2 12 5 6 1 2
Source: Author, based on budget statements, Deloitte, IMF Policy Tracker, Economic Intelligence Unit
Note: Information not available for Burundi, Comoros, Eritrea, Lesotho and South Sudan
Revenue losses will also arise from subsidies introduced to cushion households and
businesses from the effects of the pandemic. The Government of Namibia, for example,
allocated N$359 million (~US$24 million, current prices3) to a one-off wage subsidy of N$700
(~US$47) per employee who lost their job in the tourism/hospitality sector for up to six months,
and N$23 million (US$1.5 million) to the construction industry for a wage subsidy of N$500
(US$34) per unemployed worker. An additional N$562 million (~US$37 million) was also allocated
for emergency income grants of N$750 (~US$50 in one-off payments to people who lost their jobs
as a result of the pandemic (IMF 2020f; Perche 2020). The Government of South Africa also
provided a tax subsidy of up to R500 (~US$27) per month from April for those private sector
employees earning below R6,500 (~US$350) under the Employment Tax Incentive (National
Treasury RSA 2020b; IMF 2020f). Similarly, the Government of Botswana offered a wage subsidy
amounting to 50 percent of salaries of affected businesses for a period of 3 months. In Ethiopia,
the Federal Housing Corporation announced a 50 percent reduction of housing rent effective from
April 1, 2020 (IMF 2020f) while the Government of Zimbabwe introduced a bill for the deferment
of payment of rent for all people with limited capacity to pay during the lockdown (Ministry of
Finance Zimbabwe 2020)
Some governments are also providing strategic fiscal stimuli in the form of concessional
loans and grants to companies in critical economic sectors to facilitate recovery. This
basically implies taking resources away from critical public investments in education, water, social
protection and other sections. In several ESA countries, the tourism, travel and agricultural
sectors have been targeted for stimuli support from the governments. The government of
3
All the ~US$ equivalents are based on dividing local currency value by the exchange rate of that day using
https://www1.oanda.com/currency/converter/
10Namibia, for example, committed a N$200 million (~US$13.4 million) guarantee for an agricultural
loan scheme. Altogether, the fiscal stimulus package presented by the Government of Namibia is
estimated at 4.5 percent of GDP (IMF 2020f; Perche 2020).
2.3 The collapse of global commodity prices
COVID-19 has worsened the oil price situation, which fell from an average of US$60 per
barrel in December 2019 to about US$40 by mid October 2020 (Figure 5). However, it is
important to note that the fall in oil prices was triggered by the rift between Russia and Saudi
Arabia well before the demand-side shock of COVID-19. Within ESA, the tumble in oil prices has
affected Angola and South Sudan the most. In Angola, the oil sector accounted for about
64 percent of domestic revenues and over 95 percent of exports in 2019 (UNICEF Angola 2019),
while in South Sudan, oil revenue accounted for 93 percent of domestic revenue in 2019 (UNICEF
South Sudan 2019). Before the pandemic, the two countries had budgeted revenue at the rate of
US$55 per barrel of crude oil.
Figure 5: Global crude oil prices, September 2019 to October 2020
(in current US$/barrel)
70
60
50
Price/Barrel (US$)
40
30
20
10
0
Source: https://oilprice.com/oil-price-charts (Accessed on 20 October 2020)
Based on an estimated average oil price of $35 per barrel, Angola will lose approximately
US$3.9 billion in oil revenue, which amounts to nearly a third of lost government revenue
in the current fiscal year. Using the same oil price, it is estimated that South Sudan will lose an
estimated US$230 million in government revenue between January and December 2020. The
above figures are based on the optimistic assumption that production would not significantly go
down. At the beginning of the fiscal year 2020 (January), Angola had budgeted for approximately
US$10 billion oil revenue at the price of US$55 per barrel. South Sudan too had budgeted with
the same price (UNICEF Angola 2019; UNICEF South Sudan 2019).
Other resource-intensive countries will also suffer declines in government revenue. In
Botswana, for example, the diamond output is estimated to decline by approximately 20 percent
mainly because of depressed global trade as well as the temporary closure of the Debswana
Diamond Company in April 2020 (Econsult 2020). Similarly, in South Africa, where mineral
11products account for around 20 percent of exports, falling demand and prices will reduce export
revenue, although commodities such as platinum may be more resilient than others. The
Government of Zambia has already forecasted a substantial decline in copper export earnings by
more than US$1 billion in 2020 due to a reduction in prices on the London Metal Exchange (LME).
Copper prices opened the year at US$6,165 per metric ton but closed at US$4,754 on Wednesday
25th March 2020 (Ministry of Finance Zambia 2020). The situation has not improved since then.
COVID-19 has also disrupted other productive processes in the extractive sector. For
instance, operations in Mozambique’s emerging gas sector, currently under development, have
been stalled, and some companies have deferred investment decisions due to COVID-19
(Economic Intelligence Unit, 2020a). The insurgency in the province of Cabo Delgado has further
compounded investment challenges. Besides Mozambique, the pandemic has interfered with the
development of prospective oil and gas industries in Kenya, Somalia, Tanzania, and Uganda.
With numerous unknowns about the pandemic, it is not clear when trade and prices of
commodities will return to normal. It is likely that prices of most commodities will remain
depressed through the end of the year, with a modest rebound during 2021. The sale of
agricultural commodities, which is the mainstay of most ESA countries, has also been affected.
Agriculture is a leading export sector in the region. Altogether disruptions in commodity trade will
limit domestic revenues of most countries in the region.
2.4 Non-tax revenue losses
Non-tax revenue is also projected to decrease across the region. Non-tax revenue accounts
for an average of 2 percent of GDP in ESA (World Bank 2020a). The latest statistics from the
OECD show that non-tax revenue for Kenya is approximately 1.1 percent of its GDP, Madagascar
0.3 percent, Rwanda 2.6 percent, South Africa 0.4 percent, and Uganda 0.6 percent. In Malawi,
Zanzibar, and Zimbabwe, non-tax revenue has contributed an average of four, seven, and eight
percent, respectively, of total domestic revenue in recent years (UNICEF Malawi 2019; UNICEF
Zimbabwe 2019; OECD 2020a).
Various streams of non-tax revenue will dry up due to the impacts of the pandemic. As
demand for public services, such as business licenses, passports, trade tests, certification of
products, marriages, and driver’s licenses, has gone down, related government income will follow
suit. Tourism-related receipts, including hotel levies, entrance fees to tourist attractions, and visas,
have plummeted in most countries during the year (Deloitte 2020; Ministry of Finance Zambia;
Economic Intelligence Unit 2020a, c, f). Revenues from the sale of services by ministries,
departments, and agencies are equally under-performing. Already, in the past few months,
several countries have reported notable decreases in non-tax revenue. Declines in road access
fees, tourism receipts, service charges, and even fines have been reported in Angola, Kenya,
Namibia, South Africa, Uganda, and Zimbabwe (PWC 2020; Deloitte 2020; Treasury RSA 2020).
In Ethiopia, Deloitte (2020) estimates that non-tax revenue will decline by 7.7% in the fiscal year
2019/20.
Lastly, sector-specific revenue flows from ministries and departments will be dented. In
the health sector, for instance, contributions to national health insurance is impacted by reduced
12wages and unemployment. The closure of educational institutions has also led to reduced income
in the form of fees and levies paid by learners. The water sector is another example. A telephone
survey conducted by the Kenya National Bureau of Statistics (KNBS) in May 2020 revealed that
33 percent of respondents failed to pay their water bills due to reduced income (KNBS 2020).
Unfortunately, this decline in revenue negatively impacts on fiscal capacities of water
management bodies to supply water to all residents.
2.5 Key takeaways
• Through reduced taxable activities, tax relief measures and non-tax revenue losses, COVID-
19 has dramatically reduced domestic government revenue, with natural-resource intensive
economies suffering more due to the collapse of global commodity prices.
• The current context means that there is very limited scope for governments in ESA to increase
domestic revenue to finance COVID-19 recovery plans or investments in human capital.
• Considering falling domestic revenue, attracting external resources, especially grants and
concessional loans, is probably the only viable way for most governments to meaningfully
support their spending priorities.
• To avoid long term impacts on public finances, tax relief measures should only remain for a
limited period.
13Chapter 3. Official Development Assistance: Flatlining
This chapter discusses how international financial institutions and donors are supporting
ESA governments to respond to COVID-19. ODA is a critical part of the public financing
equation in most countries and an indispensable source of investment in human capital. As
argued in the Addis Ababa Action Agenda on Financing for Development, ODA is one of the ways
through which rich countries support the development of poorer countries. Article IV of the
Convention on the Rights of the Child (CRC) also encourages international cooperation in the
financing of services to children when a country is facing domestic revenue constraints. This
chapter is divided into three sections. The first presents the ODA picture in ESA before COVID-
19, with the second focusing on ODA flows to ESA since the start of the pandemic. The last
section briefly looks at the ODA outlook in 2020 and beyond.
3.1 ODA before there was a crisis
ESA is one of the most donor dependent regions of the world. Based on the latest available
data from OECD (2020b), net ODA flows to the region amounted to 7.6 percent of gross national
income (GNI), on average, or just over US$60 on a per person basis (Figure 6). The poorest
countries benefit the most, with low-income countries (LICs) receiving ODA equivalent to 12.2
percent of GNI, on average, compared to 3.4 percent in lower middle-income countries (LMICs)
and 0.6 percent in upper middle-income countries (UMICs) (Figure 7). In per capita terms, South
Sudan, Eswatini, Somalia and Comoros are the top recipients, all of which received at least
US$100 per person as of 2018. Despite the large inflows into the region, it is important to note
that ODA remains concentrated in a subset of countries or “donor darlings.” These include
Ethiopia, which receives more than 20 percent of all regional aid, followed by Kenya (11 percent),
Uganda (9 percent), Mozambique (eight percent), and South Sudan and Somalia (seven percent
each) (OECD 2020b).
Figure 6: ODA flows to ESA, 2000-18 (as a % of GNI and in per capita current US$)
14 80
12 70
60
10
% of GNI
50
8
US$
40
6
30
4
20
2 10
0 0
2000 2001 2002 2003 2004 2005 2006 2007 2008 2009 2010 2011 2012 2013 2014 2015 2016 2017 2018
Net ODA received per capita (current US$)-Right axis Net ODA received (% of GNI)
Source: Author, based World Bank, Word Development Indicators (2020)
14Figure 7: Net ODA received by ESA countries, 2018,
(as a % of GNI and in per capita current US$)
40 160
35 140
30 120
25 100
% of GNI
US$
20 80
15 60
10 40
5 20
0 0
Angola
Rwanda
Mozambique
South Sudan
ESAR LIC
Madagascar
Malawi
Ethiopia
Somalia
Botswana
Kenya
World
ESAR LMIC
Tanzania
Eritrea
Burundi
Zambia
Lesotho
Comoros
South Africa
Uganda
Zimbabwe
ESAR UMIC
Namibia
ESAR Total
Eswatini
LIC LMIC UMIC Averages
Net ODA received (% of GNI)-Left axis Net ODA received per capita (current US$)-Right axis
Source: Author, based on World Development Indicators (2020)
Donor assistance to the region has been volatile and declining in recent years. In total, ESA
countries received approximately US$21.5 billion in ODA in 2018, compared to US$22.9 billion in
the previous year (OECD 2020b). Data from the World Bank (2020a) shows that in per capita
terms, ODA to ESA was approximately US$61 per person in 2018, which is 18 percent lower
compared to US$74 in 2008. Since 2013, ODA on a per capita basis has been declining in the
region (Figure 6). Support to the United Nations has also flatlined over the past few years, and
the United States recently indicated that it would stop funding to the World Health Organisation
(Lannoye 2020). ODA support to ESA countries during and after COVID-19 should therefore be
understood in the context of a downward trend.
3.2 ODA in the context of COVID-19
Most traditional donors (bilateral, multilateral and private foundations) have continued to
support ESA countries to respond to the pandemic although inflows are lower than
expected. The support offered to ESA countries has mainly been through debt relief, approvals
to reallocate resources from existing grants, and, in some cases in the form of COVID-19-specific
grants and concessional finance channeled mostly towards health, social protection and water,
sanitation and hygiene (WASH) responses.
As of October 2020, about a third of ESA countries had benefitted from debt relief grants
offered by the IMF and the World Bank. In April 2020, the Executive Board of the IMF approved
immediate debt service relief to 25 of its member countries under the Catastrophe Containment
and Relief Trust (CCRT) (IMF 2020d). Through this initiative, beneficiary countries were provided
with grants to cover their debt obligations for an initial period of six months, which was intended
to allow revenue that was earmarked for debt service to be used to respond to the impacts of the
pandemic. For the eight countries in ESA that benefited, total support originally amounted to
US$54 million, which was then extended in October to approximately US$136 million (Figure 8).
15Figure 8: IMF debt service relief under the CCRT to select ESA countries,
April 2020 – April 2021, (in US$ millions)
Mozambique
Tanzania
Ethiopia
Rwanda
Malawi
Burundi
Madagascar
Comoros
- 5 10 15 20 25
US$ Millions
Ist Tranche (Apr-Oct 2020) 2nd Tranche (Oct-April 2021)
Source: IMF Emergency Funding (Updated 20 October 2020)
Debt service relief offered by the IMF and the World Bank is, however, only a small fraction
of what is owed by ESA governments in 2020. Country information from the members’ financial
data shows that about US$273 million is due to the IMF from ESA countries (Figure 9). Out of this
amount, 43 percent (US$118 million) is expected from Kenya alone.
Figure 9: Debt service due to the IMF in 2020 in ESA countries and debt relief under the
CCRT (US$ Millions)
Rwanda
Ethiopia
Malawi
Zambia
Angola
Lesotho
Burundi
Somalia
South…
Approved Debt Service Relief under the CCRT for six months
Uganda
Namibia Overdue in US$ Million to IMF in 2020, total
South…
Eritrea
0 5 10 15 20 25 30
Source: Author, based on IMF Members’ Financial Data (May 2020)
Note: Kenya not included but owing US$118.8 million in 2020
16Eleven countries in ESA are also participating in the Debt Service Suspension Initiative
(DSSI) coordinated by the World Bank in collaboration with the IMF. The DSSI was approved
in April 2020 by the World Bank’s Development Committee and the G20 ministers of finance to
help countries focus on the pandemic by easing their debt service burden. By signing up for the
DSSI, governments commit to use freed-up resources to finance COVID-19 responses, including
health and social protection expenditures (World Bank 2020c). As of August 2020, 11
governments had subscribed to this initiative, including Angola, Burundi, Comoros, Ethiopia,
Lesotho, Madagascar, Malawi, Mozambique, Tanzania, Uganda, and Zambia. Altogether, the
countries are expected to benefit from US$3.8 billion savings through the DSSI, although almost
70 percent will go to Angola (Table 2). In contrast to the CCRT benefits, which are not repayable,
support under DSSA simply postpones debt payments to a future point.
Table 2: Summary of DSSI benefits for participating ESA countries, as of October 2020
Country Risk of external debt Potential DSSI savings Potential DSSI savings
distress (in US$ millions) (% of 2019 GDP)
Angola High 2,645.6 3.1%
Burundi High 3.9 0.1%
Comoros Moderate 2.3 0.2%
Ethiopia High 511.3 0.5%
Lesotho Moderate 9.5 0.3%
Madagascar Moderate 24.0 0.2%
Malawi Moderate 17.1 0.2%
Mozambique In distress 294.2 2.0%
Tanzania Low 148.9 0.2%
Uganda Low 95.4 0.3%
Zambia High 139.2 0.6%
Source: World Bank, DSSI (20 October 2020)
Besides debt relief, many bilateral and multilateral donors approved reallocations of
existing financial commitments towards COVID-19. This move enabled governments, civil
society organizations, and UNICEF to roll out key activities at the onset of the pandemic.
Moreover, some donors agreed to frontload resources, which had been committed for several
years. With the pandemic still ongoing, further reallocations are inevitable in cases where donors
had multi-year financial commitments. Some donors have provided new funding to strengthen
national responses to the pandemic. In Zambia, for example, the United Kingdom pledged GBP30
million towards scaling up social cash transfers while the United States approved a grant of
US$14.5 million in May 2020 (Ministry of Finance Zambia 2020). However, new grant funding to
ESA countries has been lower than expected as of October 2020.
Most of the external support to ESA countries has come from international financial
institutions, especially the IMF. In March, the IMF announced that it has $1 trillion in lending
capacity available to its membership. Despite this huge commitment, by mid-October, the IMF
had approved only $7.4 billion to 12 ESA countries, over half (US$4.3 billion) of which benefitted
South Africa. This excludes funding approved as debt relief under the CCRT. Annex 2 provides
details of funding provided by the IMF to ESA countries by the mid-October.
17The World Bank also announced various financing packages. In addition to the US$160
billion commitment made at the beginning of the year, the World Bank also indicated that it would
avail US$196 million to 64 of the world’s poorest countries with reported cases of COVID-19 under
the Pandemic Emergency Financing Facility (PEFF) (World Bank 2020e). Allocations within the
PEFF will be determined by population size and reported cases. By the end of August, the World
Bank had approved close to US$650 million under the dedicated COVID-19 Fast-Track Facility
to ESA countries in addition to funding provided through other instruments. For instance, in May,
the World Bank approved a US$1 billion financing package to Kenya in the form of a loan to help
advance the government’s inclusive growth agenda, including in affordable housing and support
to farmers (World Bank 2020g).
In total, by mid-October 2020, international finance institutions (IFIs) had committed about
US$15.8 billion to ESA countries. As indicated earlier, about half of this amount (US$7.4 billion)
was committed by the IMF through its various lending facilities4 and grant packages (Figure 10).
Excluding support under the DSSI, the World Bank provided ESA countries with US$2.5 billion of
support by mid-October, with the African Development Bank availing slightly over US$1 billion. A
large share of support from the World Bank is through redeployment of existing commitments
(World Bank-Other support in Figure 10). Although significant, funding inflows are lower than
growing financial needs. In March 2020, long before the severity of the economic shock was
known, African Ministers of Finance asked the Group of Twenty (G20) for $100 billion in
assistance through a mix of financing, grants and debt relief (UNECA 2020a). The IMF also just
estimated that governments in Africa require $1.2 trillion in additional funding just to recover from
the economic damage through 2023 (IMF 2020k).
Figure 10: External support from IFIs to ESA countries, as of mid-October 2020
(in US$ millions)
IMF (various lending instruments) 7,467
Workd Bank-DSSI 3,880
World Bank-Other support 1,958
AFDB 1,020
World Bank-COVID Facility 640
IMF (CCRT) 105
- 1,000 2,000 3,000 4,000 5,000 6,000 7,000 8,000
Source: Author, based on data from AFDB, IMF, and World Bank (Accessed on the 15 th of October 2020)
4
These are: Extended Credit Facility, Rapid Financing Instrument, and Rapid Credit Facility.
18Total external support to ESA countries in the form of grants and concessional loans
averaged 2.2 percent of GDP by mid-October 2020. Mozambique is expected to receive the
highest support at 6 percent of GDP, followed by Rwanda (4.4 percent), Madagascar (4.3
percent), Comoros (4.1 percent) and Uganda (4.0 percent) as shown in Figure 11.
Figure 11: Total external support to ESA countries, as of mid-October 2020,
(as a % of GDP)
6%
5%
4%
3%
2%
1%
0%
Source: Author, based on date from IMF, World Bank, AFDB and DEVEX (Accessed on 15 October 2020)
Not all ESA countries have so far accessed external support from IFIs. As of mid-October,
about a third of ESA countries had not received any support from the IMF and World Bank on
average. Some countries (Botswana, Eritrea, and Namibia) did not receive any support at all
(Table 3). Countries such as Eritrea and Zimbabwe, are failing to access concessional finance
due to outstanding arrears to other multilateral institutions as well as diplomatic factors. For
others, it could be due to sovereign reasons like preferring domestic to foreign loans. Information
about other external loans procured from lenders beyond the IMF and the World Bank during this
time of COVID-19 is not publicly available, which raises questions on debt transparency.
19Table 3: ESA countries that received support from the World Bank, IMF and AFDB,
as of mid-October 2020
Source: IMF, World Bank and AFDB (Accessed on 15 October 2020)
3.3 The outlook for ODA
COVID-19 will certainly affect the size of ODA flows to the region. When combining recent
ODA trends and the ongoing impacts of the pandemic on high-income countries, external support
to ESA is likely to continue a downward trajectory. One of the clear constraints has been the
inability of most donors to fulfill their commitment to allocate at least 0.7 percent of their GNI to
ODA (Lannoye 2020). Lessons can be drawn from the global financial crisis on how some rich
countries cut back their ODA budgets after 2008 (Ortiz & Cummins 2020). If the pandemic is not
fully contained by 2021, then ODA is expected to decline even further.
With limited fiscal space to maneuver, donors are more likely to revisit their funding
priorities and introduce stricter eligibility criteria for funding across and within nations.
Chances are high that after COVID-19 donors will focus on areas that they consider ‘essential’
depending on their foreign policy, development priorities, and other interests (Lannoye 2020). The
merger of the Foreign Office and the Department of International Development (DFID) of the
United Kingdom supports this view. Further, it is anticipated that the emphasis on aid for private
sector development will heighten. Accordingly, blended financing, public-private partnerships, and
20You can also read