Provision of affordable housing in Europe, North America and Central Asia: policies and practices - Dr Sasha Tsenkova Professor of International ...
←
→
Page content transcription
If your browser does not render page correctly, please read the page content below
Provision of affordable housing in Europe,
North America and Central Asia: policies and
                  practices

               Prepared for the United Nations-HABITAT

                          Dr Sasha Tsenkova
         Professor of International Development and Planning
                         University of Calgary

                            January 2008

                                                               1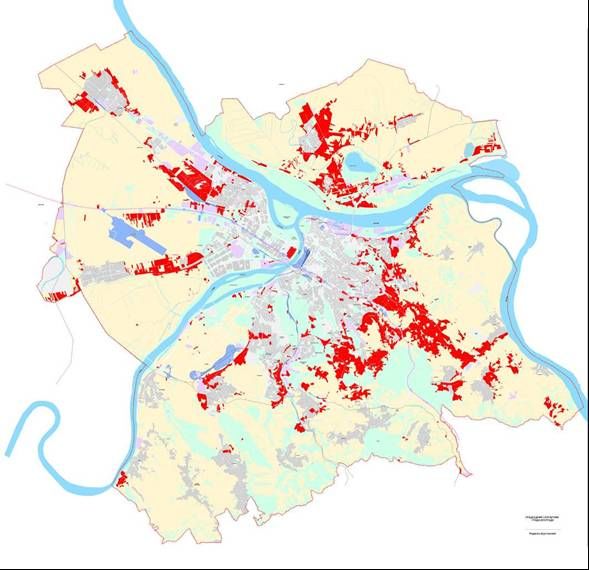
Contents

       EXECUTIVE SUMMARY

I         INTRODUCTION

1         AFFORDABLE HOUSING FOR ALL: A CALL FOR ACTION
2         PURPOSE AND OBJECTIVES OF THE REPORT
3         METHODOLOGY

II.       FACTORS UNDERLYING DIFFERENCES IN HOUSING PROVISION
1         ECONOMIC CHANGE
2         SOCIAL CHANGE
3         URBAN CHANGE.

III.      HOUSING SYSTEMS AND HOUSING CONDITIONS
1         HOUSING CONDITIONS: QUANTITY AND DISTRIBUTION
2         HOUSING CONDITIONS: HOUSING QUALITY
3         TENURE STRUCTURE AND CHOICE
4         NEW HOUSING CONSTRUCTION
5         HOUSE PRICE DYNAMICS
6         SUBSTANDARD HOUSING AND INFORMAL SETTLEMENTS

IV.   HOUSING POLICY RESPONSES: PROVISION OF ADEQUATE AND AFFORDABLE
HOUSING

1         THE NEW SUBSIDY REGIME AND AFFORDABILITY CONSTRAINTS
2         RESPONSES TO HOMELESSNESS AND THE REFUGEE CRISIS
3         LIMITED PROVISION OF SOCIAL HOUSING
4         ADDRESSING MANAGEMENT PROBLEMS IN PRIVATIZED MULTIFAMILY HOUSING
5         PROVISION OF AFFORDABLE HOUSING THROUGH URBAN REGENERATION

V         RECOMMENDATIONS

       ANNEX

2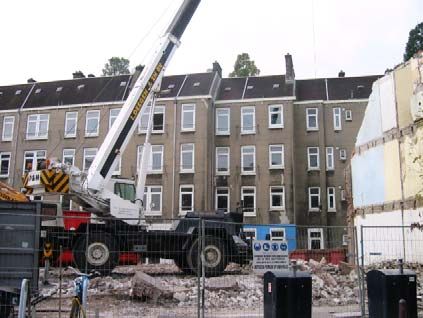
EXECUTIVE SUMMARY

This report provides an overview of progress achieved in the provision of affordable housing in the
region of the United Nations Economic Commission for Europe (UNECE). Given the immense
diversity of responses across the 56 countries in the region, the emphasis is on practices that are
conducive to the provision of affordable land and housing. The report has three specific
objectives. Firstly, it explores major regional trends in housing conditions with an emphasis on
availability, quality and tenure choice. Secondly, it analyses housing policy responses to address
major challenges such as growing affordability problems, access to social housing and
improvement of substandard housing conditions. Thirdly, the report provides recommendations for
local, national and international policy initiatives that could contribute to the provision of affordable
housing in the region.

HOUSING SYSTEMS AND HOUSING CONDITIONS

Housing reforms in the UNECE region in the past decade have promoted policies to reassert
market forces and reduce State intervention. With respect to housing provision, they have
emphasized deregulation, private sector involvement and demand-based subsidies. While the
overall goal of these reforms has been to improve the economic and social efficiency of the
housing systems, responses across the region demonstrate diversity and substantial differences
in housing conditions.

Availability of housing. Housing conditions in most UNECE countries have improved in the
last decade. The general ratio of dwellings per thousand inhabitants—a crude indicator of the
adequacy of housing provision—varies, with Finland and France having the highest number of
over 500 units per 1,000 residents, followed very closely by Greece, Sweden and Portugal.
The countries in transition have lower levels, which despite their lower level of economic and
social development, are nevertheless comparable to those in Western Europe. The number of
dwellings per 1,000 people is lowest in Albania (254/1000) followed very closely by Poland
(314/1000) and Slovakia (318/1000). Housing shortages across most countries in the region
are often associated with particular housing types, locations and qualities than with the
absolute shortage of housing in general. The question of housing deficits, particularly in CEE,
has become less relevant to market realities. In fact, the housing surplus ranges from 786,000
units in Romania to 58,000 in Albania.

Water and sanitation. Access to water and adequate sanitation in the UNECE region is one
of the highest in the world standing at 94 percent on average for water and 93 percent for
sewer. Correspondingly, the share of housing serviced with piped water and sewer is
reportedly much higher than in other global regions. Even allowing for definitional changes
over time, the available data indicate overall housing improvement since the 1990s. However,
the situation with CIS countries is particularly problematic in Moldova and Uzbekistan with
water services available in one third of the stock. A limited share of the housing has
bath/shower—Uzbekistan (13.3%), Bosnia and Herzegovina (22%), Kyrgyzstan (24%),
Moldova and Turkmenistan (30%). Although urban areas reportedly have higher levels of
service, close to 3 million people in European cities lack access to piped water and 8 million to
sewer. In countries in transition, high connection rates do not necessarily mean good quality of
services.

Tenure choice. Tenure choice is important for long-term housing market stability and access
to adequate and affordable housing. Homeownership has grown steadily in most countries,
particularly in those in transition. In most of the CEE and CIS countries, owner occupation

                                                                                                            3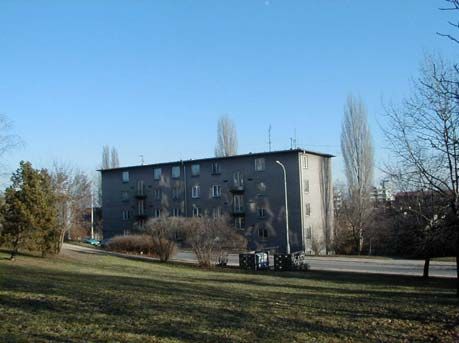
exceeds 90 percent, which is well above the 65 percent average in Western Europe. In fact,
some of the poorest countries in the region have the highest rates of homeownership.
Analysis of house price dynamics indicates that access to owner occupation has become
more expensive, even if it might lead to significant financial benefits over the long term. In a
number of countries like France, Germany, Canada and the United States a large share of
private rental housing provides options for labour mobility. Tenure choices are much broader
in Finland, Sweden, Austria and Denmark thanks to a balanced tenure structure offering a
ladder of opportunities ranging from social to private renting to homeownership. By contrast,
in several European countries the rental option is severely curtailed (Spain, Greece, Italy).

Slums and informal settlements. Estimates by UN-HABITAT indicate that about 10
percent of the urban population lives in slum conditions without access to basic services
and/or in overcrowded dwellings. In Central Asia more than half of the urban population lives
in slums. Elsewhere these rates are 30 percent for Moldova and 19 percent in Romania,
Bosnia and Herzegovina, Croatia and Macedonia. Informal settlements have grown rapidly,
particularly in the peri-urban areas of Albania, Serbia, Georgia and Azerbaijan becoming the
home of millions of new residents.

MAJOR CHALLENGES AND HOUSING POLICY RESPONSES

The new subsidy regime and affordability constraints. Under the new subsidy regime,
subsidies focus on owner-occupation. Mortgage interest tax relief exists in Ireland, the
Netherlands, the United States, the United Kingdom and Spain. France offers subsidies on
savings schemes for many newly-built and renovated properties and provides a quarter of a
million zero interest rate mortgages annually. Looking beyond this group, housing subsidies
and tax breaks are common in Austria, Germany, Russia, Croatia, the Czech Republic,
Hungary and Poland. The new subsidy schemes in CEE have been criticised for being
particularly inefficient in targeting households in need and in supporting the most affluent
housing consumers. Meanwhile, demand-based subsidies to low income renters have failed to
keep pace with the rising housing costs. In most transition countries such assistance is non-
existent and where it has been launched (e.g. The Czech Republic, Poland, Romania, Estonia
and Latvia), it is inadequate.

Affordability of housing remains the fastest-growing and most pervasive housing challenge in
the UNECE region. Housing costs have increased with significant implications for access to
adequate and affordable housing, particularly for vulnerable groups. In four countries—
Belgium, Spain, Portugal and Greece—a quarter of the households have significant financial
difficulties due to housing costs; in Italy this share is 42 percent. While the data are limited, it
appears that countries with higher homeownership rates and limited tenure choice tend to
have a higher share of households experiencing affordability problems. Furthermore, the
situation appears to be more problematic in urban areas where higher prices for housing and
concentration of poverty create cumulative disadvantages.

Homelessness and the refugee crisis. Homelessness across the UNECE region is a serious
challenge and a sign of major failure of welfare states to deliver affordable housing for all. The
total estimate of the homeless population in Europe is close to 600, 000 with more than
60,000 people sleeping rough and another 400,000 in homeless shelters. Asylum seekers are
another disadvantaged category accounting for over 105,000 in temporary shelters. Although
the evidence for CEE countries suggests that homelessness is less significant in quantitative
terms, Poland and Hungary seem to have a growing number of homeless people and rising
demand for overnight shelters. In the United States more than 750,000 people are reported to
be homeless in 2006. Across the region, internal displacement continues to be a major

4
problem directly related to housing in the Balkans, the Caucasus, Turkey and Cyprus, where
the number of IDPs stands at 2.8 million. Serbia and Montenegro still host the largest number
of refugees and IDPs in Europe, most of them living in substandard or informal housing.
Limited provision of social housing. While affordability constraints are growing, less social
housing is being provided for low income households. In Canada and the United States a
handful of local governments have had the political will to overcome some of the barriers to
development of affordable housing and the prospects for a meaningful reduction in the
number of households with growing affordability problems are dismal. In Western Europe, the
data suggest that in countries where the sector is significant, there is an ongoing commitment
to maintain adequate supply. Austria (30%), Denmark (20.7%) and Sweden (16%) have the
highest rates of new social housing production, followed by Finland, UK and the Netherlands
with rates in the range of 12 percent. Several transition countries (Poland, the Czech Republic
and Slovakia) have initiated new social housing programs in recognition of their importance for
marginalized groups in society.
Land shortages for affordable housing. The irreversible trends of urbanization and
concentration of poverty in some cities have affected housing affordability as well as created
significant shortages of land for affordable housing. While land for housing is mostly provided
through the market with a variety of long-term urban planning strategies in place to ensure 20-
25 year land supply for new housing, many high growth regions need coordinated planning by
all levels of government in cooperation with civil society and commercial interests to respond
to a deepening shortage of land for affordable housing. A number of regional and local
governments have experimented with density bonusing, inclusionary zoning, land trusts and
land lease arrangements to increase the availability of land supply for affordable (social)
housing.
Problematic management of privatized multifamily housing. In the privatization aftermath,
the management and rehabilitation of multifamily housing is potentially one of the largest problems
facing municipalities in countries in transition, since failure to carry out repairs will result in massive
structural problems in more than 40 percent of the urban housing stock. Recently, most
countries have introduced laws to regulate the operation of homeowners’ associations, but the
implementation has been very slow and inadequate. The management of privatised
multifamily housing faces three significant challenges—organisational, social and financial
which need to be systematically addressed.
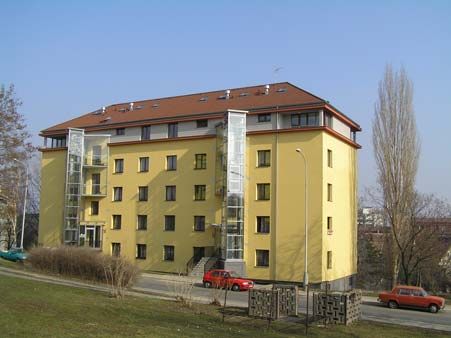
Provision of affordable housing through urban regeneration. A number of countries in the
region address the provision of affordable and adequate housing through area-based urban
renewal and regeneration programs. Local governments, working in partnership with non-profit
housing providers and community groups, have experimented with inner city regeneration,
brownfield and waterfront redevelopment schemes. The search for effective strategies for
urban regeneration to create a social mix, increase the supply of affordable housing and
facilitate investment and improvement of existing infrastructure has promoted new models and
a new repertoire of planning instruments to deal with social inclusion.
5I INTRODUCTION 1 AFFORDABLE HOUSING FOR ALL: A CALL FOR ACTION This report provides an overview of progress achieved in the provision of affordable housing in the region of the United Nations Economic Commission for Europe. The overview is guided by the commitments in the UN Habitat Agenda and other regional housing policy initiatives. The UN Habitat Agenda adopted in 1996, and the Declaration on cities and other human settlements in the new millennium adopted by the Special session of the UN General Assembly in June 2001, reaffirm the commitment of Governments to ensure access to adequate housing. In the Habitat Agenda, the right to adequate housing means that “everyone will have adequate shelter that is healthy, safe, secure, accessible and affordable and that includes basic services, facilities and amenities, and will enjoy freedom from discrimination in housing and legal security of tenure”. In order to achieve this fundamental goal an emphasis was placed on collaboration between public and private actors and institutions and ‘enabling strategies’. Within the UNECE region, The Council of Europe has emphasized the importance of the ‘enabling framework’ for housing policies of Member States. In the Revised European Social Charter of 1996 (Art. 31), a more concrete commitment is advocated: “With a view to ensuring the effective exercise of the right to housing, the Parties undertake to take measures designed: to promote access to housing of an adequate standard; to prevent and reduce homelessness with a view to its gradual elimination; to make the price of housing accessible to those without adequate resources”. Recently, the UNECE Committee on Housing and Land Management adopted a Ministerial Declaration on Social and Economic Changes in Distressed Urban Areas (2006) to foster a more strategic approach to the provision of adequate housing. The Council of Europe has recognized that the problems in transition economies need urgent attention, particularly with respect to the provision of affordable housing for the homeless, people with disabilities, ethnic minorities and the elderly (Council of Europe, 2002). In response to the global call for action, the European Union (EU) has established a favourable environment for cooperation with regard to the provision of adequate and affordable housing, while recognizing the diversity of housing systems and policy challenges in the member states. Recently, the Executive Director of UN-HABITAT emphasised the necessity to undertake urgent measures at the international level through a global campaign for decent and affordable housing.1 The overall goal of this campaign is to fight urban poverty and housing deprivation by mobilising concerted action to provide housing including: (i) eradicating slums in cities; (ii) reducing dilapidated and socially inadequate housing; and (iii) developing market mechanisms for building affordable and decent shelter for those in need. This is expected to contribute significantly to the achievement of the Millennium Development Goals, particularly Target 11 on slums. The conceptualization of such campaign is part of the policy discussion during the new World Affordable Housing Day. 2 PURPOSE AND OBJECTIVES OF THE REPORT The purpose of this report is to review housing conditions and policy responses to major housing challenges. Given the immense diversity of responses across the 56 countries in the UNECE region, the emphasis is on practices that are conducive to the provision of affordable 1 Dr. Anna K. Tibaijuka, Under-Secretary-General and Executive Director of UN-HABITAT, at the 21st Session of the Governing Council for UN-HABITAT, April 2007, Nairobi(www.unhabitat.org). 6
land and housing. The report has three specific objectives. Firstly, it explores major regional
trends in housing conditions with an emphasis on availability, quality and tenure choice of housing
in different housing systems. Secondly, it analyses housing policy responses to address major
challenges such as growing affordability problems, access to social housing and improvement of
substandard housing conditions. Particular emphasis is given to the urban dimension of
affordability in the context of economic, social and political change. Thirdly, the report provides
some recommendations for local, national and international policy initiatives that could contribute
to the provision of affordable housing in the region.

The report is prepared for the World Affordable Housing Day and its first thematic session ‘Policy
Frameworks and Best Practices for Affordable Housing Delivery’ in 2008. Furthermore, it is
expected to contribute to the preparation of the new UN-HABITAT medium term strategic plan for
2008-1013.

3        METHODOLOGY

The analytical assessment is based on existing information from government reports, such as the
most recent UN-HABITAT Global Reports on Human Settlements and State of the World
Cities Reports. The analysis draws on comparative evaluations on the topic carried out by major
international organizations and research institutes, the Housing Profiles and Land Reviews of the
UNECE as well as country specific assessments of affordable housing alternatives. It incorporates
statistics and housing indicators from officially published sources of information and international
databases.

Country groupings. Efforts have been made to reflect the enormous heterogeneity in the
UNECE region which has implications for the significant differences in the provision of housing
and the types of housing policy responses. UNECE member countries include some of the
richest economies in the world and some of the poorest nations; those with long and strong
democratic traditions and others with newly emerging democratic regimes, those with the
highest level of housing provision and those with the most significant housing problems
mirrored in housing deprivation and homelessness. These immense differences have a
profound effect on the housing systems in these countries, making such comparative
evaluation extremely difficult. Where possible, housing challenges and policy responses are
reviewed on a subregional basis using three clusters: (i) Western Europe and North America,
(ii) Central and Eastern Europe (CEE) and (iii) the Commonwealth of Independent States
(CIS) including the following countries:

           ¾ Western Europe and North America
           Andorra, Austria, Belgium, Canada, Cyprus, Denmark , Finland, France, Greece,
           Iceland, Ireland, Israel, Italy, Germany, Luxembourg, Malta, Monaco, Netherlands,
           Norway, Portugal, San Marino, Spain, Sweden, Switzerland, Turkey, United
           Kingdom, United States.

           ¾ Central and Eastern Europe
           Albania, Bosnia and Herzegovina, Bulgaria, Croatia, Czech Republic, Estonia,
           Latvia, Hungary, Republic of Macedonia, Lithuania, Montenegro, Poland, Romania,
           Serbia, Slovakia, Slovenia.

           ¾ Commonwealth of Independent States
           Armenia, Azerbaijan, Belarus, Georgia, Kazakhstan, Kyrgyzstan, Moldova, Russian
           Federation, Tajikistan, Turkmenistan, Ukraine.

                                                                                                       7
Although some information on housing conditions in the Russian Federation is included for comparative purposes, the overview of housing policy excludes Russian reforms covered in a separate study as well as issues pertaining to housing finance. Data sources. The data used in this report draw on country-specific information on housing conditions, housing production and housing market dynamics. Most countries in the UNECE region monitor housing conditions and housing market performance at the national, regional and local level through census data collection and specialized housing surveys. Basic statistical data are gathered on buildings (including type, size and year of construction, heating and type of energy) and dwellings (including size, technical services, utilities, tenure, price and/or rent). Results from these survey instruments provide most of the key statistics necessary to monitor the performance of housing systems and to ensure adequate policy responses.2 The experience of most countries in the region indicates that national census is carried out every ten years, Germany and the Netherlands have a census every four years, Canada and the United States—every five. Within the EU, Ministries collaborate to produce an annual edition of Housing Statistics in the European Union. Data are provided by national ministries responsible for housing well as by the European Mortgage Federation and Eurostat. These reports are a major source of the comparative data used in this study. In addition to census data, most countries in Western Europe and North America have specialised surveys providing much-needed information on affordability of housing. In France, Enquête Logement is undertaken every four or five years. In the Netherlands, the Housing Quality Survey conducted every five years is a major source of information defining policy priorities and alternative courses of action. In the United Kingdom, house condition surveys carried out in England, Wales, and Scotland every five years provide essential information on households occupying different sectors of the stock. In addition, regular information on house prices in the EU countries is collected through the survey of mortgage lenders, while in North America the information on house process is derived from the multiple listing services. By contrast, most countries in Central and Eastern Europe have only census-based information with limited indicators, which is complemented by annual data on housing production. Essential information on the affordability of housing is non-existent and data on house prices and rents are sketchy at best. The situation in the Commonwealth of Independent States is even more challenging since the official statistics on housing include a handful of monitoring indicators. Furthermore, reporting on housing availability is still done in square meters of housing, which does not allow a good understanding of the basic distribution of housing units vs. households in local and national housing markets. Access to reliable data is more problematic, making the comparative analysis in this report particularly challenging. Report structure. The document’s structure corresponds to the major clusters selected for discussion at the World Affordable Housing Day Forum in Russia. The first part provides an overview of global and regional commitments to the provision of affordable housing as well as the objectives and methodology of this report. The second part highlights major economic, social and urban factors in the region underlying differences in housing provision and specific housing challenges. The third section systematically reviews trends in housing conditions with respect to availability of housing, different types of homes, tenure choice and trends in new housing production. The emphasis is on differences and similarities in housing conditions and 2 In Canada, for example, in addition to the Census, Starts & Completions Survey, Market Absorption and Rental Market Surveys are carried out on an annual basis in urban areas. 8
on persisting problems with housing deficits, substandard housing and informal settlements.
The forth section provides the critical linkages between housing challenges and policy
responses in different countries across the region. It focuses on six important themes: (i)
growing shortages of affordable housing; (ii) homelessness and the refugee crisis; (iii) limited
social housing provision; (iv) access to land for affordable housing; (v) problematic management of
privatised public housing; and (vi) provision of affordable housing through area-based renewal and
social inclusion. The analysis highlights major achievements in addressing the multiple dimensions
of affordable housing provision. Finally, the conclusions revisit some of the major themes and
draw attention to alternatives for local, national and global action.
II. FACTORS UNDERLYING DIFFERENCES IN HOUSING PROVISION
Countries in the UNECE region have a range of different housing provision systems. This
legacy is an important determinant of housing conditions and access to affordable housing.
While the legacy is critical, housing policy responses in the last decade need to be reviewed in
the context of economic, social and urban change. These drivers of change in regional
housing submarkets increasingly map a diverse set of housing challenges and housing policy
trajectory across the UNECE region. In the economic realm, countries with traditional market
economies have experienced a strong economic growth and major progress in their structural
reform agenda in the past decade. The growth trajectory has been uneven, but it has
delivered better living standards in Western Europe, North America and some of the Central
European countries. On the social side, there has been some progress in the design of better
social protection systems and in the provision of social services. Despite these gains, poverty
has become a significant social and political challenge.
The following sections will focus on some of the major aspects of change underlying the
differences in housing policy responses and reforms.
1 ECONOMIC CHANGE
The recent expansion of the European Union with ten more countries in 2005 and another two
in 2007 has provided a major boost for better economic performance in the new accession
States. Macroeconomic data indicate that growth prospects in the Euro area are modest with
the loss of momentum more apparent in the biggest economies—Germany and France.
Recent data indicate that average income per capita, measured in purchasing power parity, in
Western Europe is US$ 25,000, while in CIS it tends to be as low as US$2,500(UNECE,
2007). Rates of gross domestic product (GDP) growth in 2005 across Western Europe are in
the range of 1%, with a high economic performance in Greece and Ireland (3.3%). The fastest
growing economies are Latvia (10.2%), Turkmenistan (9.6%), and Kazakhstan (9.7%).
Structural adjustment policies and economic restructuring have created significant challenges
for particular groups such as the long-term unemployed, low-skilled workers and young people
with limited work experience (EBRD, 2006).
The benefits of growth have not been shared widely across the UNECE region. Income
polarization has increased, perhaps more dramatically in countries in transition, and
unemployment has remained considerably high. In Spain, Greece and Estonia, the income of
the top quintile is 6 times higher than the income of the bottom quintile. By contrast, in
Slovenia, Sweden and Denmark this ratio is 1 to 3. This is a major source of social inequality,
which paralleled with unemployment creates major challenges for social sustainability. The
average level of unemployment has remained higher in Central and Eastern Europe (12.7%)
and in Western Europe (7.6%). Poland and Slovakia have levels of unemployment in the
range of 17%. North America has experienced years of jobless recovery, while unemployment
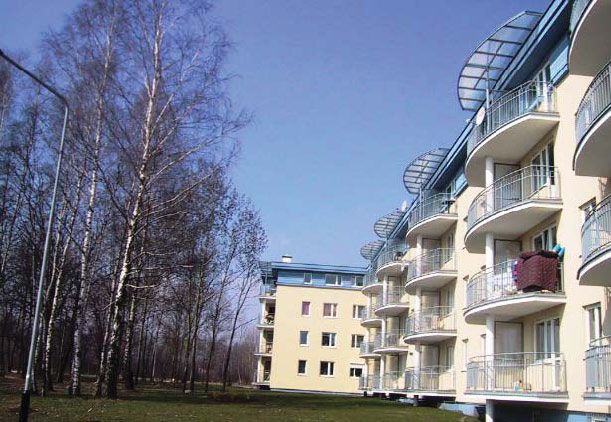
9in the CIS has remained as low as 3.5%, although differences among countries have become more significant due to different structural adjustment policies (UNECE 2007). The differences in economic performance across the ECE region affects the housing demand, interest rates, and is perhaps more visible in the level of new housing provision, 2 SOCIAL CHANGE Population growth in the region has remained modest – less than 0.5% in Western Europe and 3% in North America, mostly attributed to immigration. The countries in transition have experienced years of negative population growth, a result of emigration, lower reproduction rates and responses to economic hardship. While demographic developments are relatively stable across the UNECE, poverty has increased. The reality of over 74 million people in the European Union living at risk of poverty in 2005, with one in six people experiencing poverty after social transfers, has become a significant social and political challenge (Eurostat, 2007).3 Groups at risk are the long-term unemployed, large or one-parent families, people with a low level of education, also increasingly ethnic minorities, with particularly deep pockets of poverty among Roma communities. Some of the common drivers are unemployment or jobless growth, but also regional inequalities and inadequacy of the social protection systems (European Commission, 2004, Edgar and Meert, 2003). The dimensions of poverty in CIS are quite different. The subregion accounts for the largest share of people living in absolute poverty. While at the start of the reform poverty in countries in transition did not exist in the present sense of the concept, today more than 100 million people are classified as poor (WB 2002). The share of people living on less than US$1 per day is alarmingly high in Armenia (12%), Uzbekistan (21%) and the Republic of Moldova (22%). The move towards a market economy and democracy has failed to deliver uniform benefits to all countries in transition and/or to all social groups. It is widely acknowledged that the second generation of policy reforms is driven by a more sober reflection that market failures need to be addressed more efficiently and that the social protection of vulnerable groups is perhaps the most important aspect of public policy intervention (UN-HABITAT, 2005b; 2007). 4 URBAN CHANGE. The UNECE region is overwhelmingly urbanized, with more than 75 percent of the population concentrated in urban areas and a growing complexity of urban challenges. The level of urbanization in Western Europe is 80 percent, with the United Kingdom and Belgium exceeding 90 percent. In North America over 80 percent of the population is urbanised. The countries in transition have an average rate of urbanization close to 61 percent, which is considerably higher in the largest countries – the Russian Federation (73.3%), Poland (62%), the Czech Republic (74.5%) and Hungary (65.9%). These patterns are presented in Figure 1. 3 The top 20 percent of the EU-25 population received almost five times as much income as the bottom 20 percent of the population in 2004. The widest inequality was recorded in Portugal (7.2), while the Nordic Member States, the Czech Republic (2003), Hungary (2003) and Slovenia (2003) reported the lowest inequality ratios (between 3.1 and 3.5) (Eurostat, 2007). 10
Figure 1: Urbanization in UNECE region, 2005

Source: Based on data from UN-HABITAT, 2007.

With the exception of seven megacities -- New York, Los Angeles, Paris, Istanbul, Moscow,
London, and Chicago-- the main cities in the region tend to be under 3 million with medium
densities, and stable or low-growth population (growth rates under 1%). Annual urban growth
rates in Italy, Portugal and Turkey are comparable to those in the United States and Canada
and tend to gravitate close to 1.1-1.4 percent. However, in less urbanised countries, the
projected annual urban growth in Albania, Azerbaijan, Tajikistan and Uzbekistan exceeds is
the range of 2 percent and higher.

These high levels of urbanization create significant challenges for the provision of affordable
housing in large cities. Despite the notable economic success of major urban centres in the
UNECE region today, globalization has exacerbated social polarization and urban poverty. In the
countries in transition, the reforms from centrally planned to market-based economies have
added another layer of complexity. In many of these places the decline in living conditions is
accompanied by rapid deterioration of existing housing, homelessness and formation of
informal settlements in peri-urban areas in countries with rapid urbanisation (UN-HABITAT,
2005a; 2005c; 2007). The urban poor are especially vulnerable to economic shocks; they lack
access to services, safety nets and political representation. Cumulative disadvantages, often
defined along the lines of gender, age and ethnicity, create widening social differences
between social groups, with low-income, single-parent or women-led households worst off .

In addition to housing challenges associated with urbanization and poverty, many countries in
the UNECE region are affected by war or civil conflicts. Almost 7 million have become
refugees or are internally displaced. Military conflict and violence in the Balkans and Northern
Caucasus has caused long-term stress for the housing systems of these countries. Displaced
people as a result of conflicts in Bosnia and Herzegovina are estimated to be 2.5 million and in
Serbia and Montenegro alone over 1 million.

                                                                                                   11
III. HOUSING SYSTEMS AND HOUSING CONDITIONS Housing reforms in the UNECE region in the past decade have promoted policies to reassert market forces and reduce State intervention. With respect to housing provision, they have emphasized deregulation, private sector involvement and demand-based subsidies. While the overall goal of these reforms has been to improve the economic and social efficiency of the housing systems, responses across the region demonstrate diversity. Recent comparative studies based on the evaluation of experiences in Western and Eastern Europe have advanced the thesis of policy divergence, convergence and collapse (Angel, 2000; Boelhouwer and Heijden, 1992, Doling, 1997 and Pishler-Milanovitch 2001). Differences in housing condition across countries reflect the legacy of past policies, institutional division of responsibilities for the provision of affordable housing as well as housing preferences and choices. The analysis in this section provides a quantitative and qualitative overview of major characteristics of the existing housing systems based on most recent data available. A particular emphasis is placed on differences and similarities in housing distribution, level of service provision (water, sewer, central heating), dominant building types (single family, multi- family, high rise, etc.), and tenure choice. These quantitative and qualitative indicators are related to some recent information on housing market performance demonstrated by dynamics in house prices and rents. A special section provides insights into critical housing problems such as substandard housing, slums and informal settlements. 1 HOUSING CONDITIONS: QUANTITY AND DISTRIBUTION Availability of housing. Housing conditions in most UNECE countries have improved in the last decade. The general ratio of dwellings per thousand inhabitants is normally used as a crude indicator of the adequacy of housing provision. The distribution varies, with Finland and France having the highest number of over 500 units per 1,000 residents, followed very closely by Greece, Sweden and Portugal. The countries in transition have lower levels, which despite their lower level of economic and social development, are nevertheless comparable to those in Western Europe. Data in the Annex illustrate these patterns in selected countries. The number of dwellings per 1,000 people is lowest in Albania (254/1000) followed very closely by Poland (314/1000) and Slovakia (318/1000). Although average dwellings in CEE countries tend to be 25 percent smaller than in Western Europe, the average distribution in terms of persons/per dwelling are similar. Overall, the legacy of the socialist housing provision system has ensured a relatively higher availability of housing than could be expected given the present level of economic development. Presently, the GDP per capita in the subregion is one third of the GDP average in the EU, which affects the amount of investment available for improvement in housing conditions. Housing deficit and surplus. Housing shortages across most countries in the UNECE region are often associated with particular housing types, locations and qualities than the absolute shortage of housing in general. The question of housing deficits, particularly in Central and Eastern Europe, has become less relevant to market realities. Declining population, emigration and changing consumer preferences as well as ability to pay have shaped housing demand in the last fifteen years. Studies point to excessive supply of housing, such as small, old-style, poorly located flats, while another—particularly single-family housing in good locations—is in chronic shortage (Hegedus et al, 1996; Buckley and Tsenkova, 2001). The existence of such housing submarkets and the spread-out urban geography of larger countries such as Poland, Russia, Ukraine and Romania can make reliance on aggregate average housing indicators misleading in understanding real housing experiences. 12
Many countries in the region have a surplus of housing, particularly in Western Europe. For
example, close to 1 million dwellings in the eastern part of Germany, extensively renovated
after the unification, are vacant. A third will be demolished by 2009 under a new €3 billion
neighbourhood upgrading programme. Similar measures, although on a much smaller scale
are underway in the Netherlands, Denmark and the United Kingdom (RICS, 2007). In Central
and Eastern Europe, despite the popular myths of housing deficits, the housing surplus ranges
from 786,000 units in Romania to 58,000 in Albania. In terms of its share of the total stock,
most countries in South Eastern Europe have a surplus in the range of 12-14 percent with
Albania (7%) and Montenegro (24%) being the two extreme situations (Tsenkova, 2005).
Local housing market mismatches pose an additional, often neglected quantitative problem.
Despite the overall surplus of housing, the census data indicate that the capital cities in the
region experience housing shortages and overcrowding. Dwellings on average tend to be
small and often accommodate more than one household or the ratio of persons per room is
higher than one. For example, in Serbia 18 percent of the households (about 284,000) are
overcrowded. There are many cases with more than 3 occupants per room. Evidence from the
census data in Albania, Bulgaria, Latvia, Ukraine and Romania indicate similar problems
(ECE, 2002; 2005, Tsenkova and Turner, 2004). Part of this mismatch, and the deficit of
affordable housing in high growth urban centers, are related to migration to places with more
dynamic labour markets in pursuit of employment opportunities.

Another explanation for the deficit of affordable housing relates to the inefficient use of the
existing housing stock. Data on vacancy rates in Figure 2 show that more than a quarter of the
housing sock in Cyprus, Greece and Bulgaria is vacant. Vacancy rates in CEE countries are
higher than those in Western Europe and range between 10-14 percent. This might be due to
substandardness of housing and/or lack of demand in rural areas. In some countries—
Albania, Bulgaria and Romania—high vacancy rates are reportedly due to immigration.
Absentee homeowners often do not rent out these units, even in urban areas where demand
is high. In countries affected by war, massive displacement of the population has resulted in
higher vacancies in areas where people are reluctant to return (Leckie, 2002). Last but not
least, second homes, which are not used for permanent habitation, are very important element
of the housing markets in Croatia, Montenegro and Bulgaria, explaining the high vacancy rate
and the surplus of housing in these countries. In Greece, Italy, France, the Netherlands and
Spain between 10 and 15% of all dwellings are second homes (RICS, 2005).

                                                                                                  13
Figure 2: Housing Vacancy Rates
Western Europe & North America
Greece 33.2
Cyprus 24.1
Spain 21.9
Italy 20.7
Ireland 12.0
Portugal 10.6
Finland 8.8
Germany 8.2
Denmark 6.3
France 6.1
United Kingdom 3.4
Luxembourg 2.3
Netherlands 2.2
Sweden 1.7
Central and Eastern Europe
Bulgaria* 24.0
Croatia* 14.0
Romania* 12.5
Czech Republic 12.3
Albania* 12.0
Slovak Republic 11.6
Serbia* 11.0
Estonia 10.9
Slovenia 10.1
FYR Macedonia* 9.0
Poland 5.3
Hungary 5.1
Lithuania 3.7
Latvia 0.3
0 5 10 15 20 25 30 35
% of total stock
Source: Author’s estimates based on data in MoIIR, 2006 and Tsenkova, 2005.
In Central Asian countries there is evidence of absolute shortages/deficits of housing at the
national level and in particular in the capital cities. These countries experience delayed
urbanisation with rapid influx of rural population, which added to much stronger population
growth rates of over 2 percent exacerbates the pressures on local housing markets. In
Tajikistan, for example, population growth from 1998 to 2005 was 16.5 percent, while the
growth in housing stock was only 9 percent. Housing area per capita at the end of 2005 was
8.7 square meters, which is 27.5% less than the norm of 12 square meters per capita
established by the government. Similarly in Kyrgyzstan the population has grown from 4.7
million in 1997 to 5.1 million in 2005. Bishkek with 200,000 migrants from rural areas
reportedly experiences acute housing shortages. In Dushanbe, the capital of Tajikistan, the
city’s population has reached close to 1 million due to rapid migration creating a potential
deficit of 100,000 dwellings (IFC, 2006).
2 HOUSING CONDITIONS: HOUSING QUALITY
Water and sanitation. Access to water and adequate sanitation in the UNECE region is one
of the highest in the world standing at 94 percent on average for water and 93 percent for
sewer. Correspondingly, the share of housing serviced with piped water and sewer is
reportedly much higher than in other global regions. Even allowing for definitional changes
over time, the available data in Table 1 indicate overall housing improvement since the 1990s.
However, the situation with piped water supply in the housing stock in CIS
14Table 1: Dwellings with Basic Services
Country Year Bath/Shower Piped water Central Heating
Western Europe & North America
Austria 2003 98.3 100 90.0
Belgium 2001 96.0 100 73.0
Cyprus e 2001 99.0 na 27.3
Denmark 2005 95.0 100 98.2
Finland 2002 99.0 100 92.3
France 2002 98.0 92 91.0
Germany 2002 na 100 90.8
Greece 2001 97.8 na 62.0
Ireland 2002 94.0 na 89.0
Italy 2004 99.2 99.6 94.7
Luxembourg 2001 94.2 98 92.3
Malta 2000 100.0 92.9 3.3
Netherlands 2002 100.0 na 90.0
Poland c 2002 87.0 83.0 77.8
Portugal 2001 65.6 na 3.8
Spain 1999 99.0 39.7 a 9.4 a
Sweden 2005 100.0 100.0 100.0
United Kingdom d 2001 99.0 100.0 94.0
Canada 2001 97.0 100.0
United States 2001 96.0 100.0
Central and Eastern Europe (g)
Albania 2002 55.1 55.1. 1.0
Bosnia & Herzegovina 2002 22.0 73.7 3.3
Bulgaria 2001 81.1 81.1 16.8
Croatia 2001 92.8 93.7 3.6
Czech Republic b 2001 95.5 95.1 81.7
Estonia 2002 67.1 na 59.0
Hungary 2001 87.2 88.0 52.9
Latvia 2003 67.3 75.2 a 65.2
Lithuania 2003 69.6 58.4 71.6
FYR Macedonia 2001 59.8 85.6 8.6
Poland c 2002 87.0 83.0 77.8
Romania 2001 53.0 53.0 25.9
Slovak Republic f 2001 92.8 90.5 74.3
Slovenia 2004 92.3 na 79.1
Serbia 2001 85.0 89.4 21.2
Commonwealth of Independent States (i)
Armenia 2002 86.0 98.0 81.0
Azerbaijan 2000 na 78.0 na
Belarus 2000 na 100.0 na
Georgia 2000 na 78.0 na
Kazakhstan 2000 na 90.0
Kyrgyzstan 2001 24.0 40.0 29.1
R. Moldova 2002 30.9 36.5 30.8
Russian Federation 2001 64.0 74.0 75.0
Tajikistan 2000 na 60.0 na
Turkmenistan 1999 30.0 53.0 30.5
Ukraine 2000 98.0 15.4
Uzbekistan 1997 13.3 36.5 19.5
Notes: a. 2001
b. Permanently occupied dwellings only, Population and Housing Census 1.3.2001
c. Occupied dwellings only, National Census of Population and Dwellings 2002
d. The figures only refer to England, not the whole UK
e. Occupied conventional dwellings (excl. not stated)
f. Permanently occupied dwellings only, Populatin and Housing Census 1.5.2001
Source: Federcansa, Italian Housing Federation, eds. (2006). Housing Statistics in the European Union 2005/2006 .
Ministry of Infrastructure of the Italian Republic, p. 54.
Data for CIS countries: Author's estimates based on UNECE database
Data for SEE countries: Tsenkova, 2005
15countries is particularly problematic in Moldova and Uzbekistan with services available in one
third of the stock. In CEE, Albania and Romania stand out with half of the housing lacking
piped water. Although urban areas reportedly have higher levels of service, close to 3 million
people in European cities lack access to piped water and 8 million to sewer (UN-HABITAT
2005). In countries in transition, high connection rates do not necessarily mean good quality of
piped water since drinking water frequently fails to meet basic chemical standards.4
As in the case of water supply, sewer services are most problematic in Albania, Romania and
CIS countries. The data indicate that a limited share of the housing has bath/shower—
Uzbekistan (13.3%), Bosnia and Herzegovina (22%), Kyrgyzstan (24%), Moldova and
Turkmenistan (30%). Urban-rural inequalities in sanitation are much more pronounced,
particularly in South Eastern Europe and CIS countries. Cumulative shortages of financing for
infrastructure development in rural areas during communism, coupled with scarcity of public
resources in the last decade, have resulted in widening differences in access to basic
infrastructure between urban and rural areas. Despite the growing rates of housing
construction in rural communities, mostly through self-help, public and private investment has
been unable to close the gap.
Figure -3: Dwellings serviced by water and sewer, 2002
Dwellings with Piped Water
120
100
80
60
40
20
0
Bulgaria
Romania
BiH
Croatia
FYROM
Albania
Moldova
Serbia
Kosovo
% of total stock In urban areas
Dwellings with Piped Sewer
120
100
80
60
40
20
0
Romania
BiH
Bugaria
Croatia
FYROM
Albania
Moldova
Serbia
Kosovo
% of total stock In urban areas
Source: Tsenkova, 2005: Council of Europe Development Bank Regional Housing Survey
Data in Figure 3 present the pattern of urban-rural inequalities in nine countries in South
Eastern Europe illustrating the difference in housing quality standards in rural and urban
4 For example, substantial problems are known to exist in the water supply in Albania, the Republic of Moldova, Georgia,
Kyrgyzstan and Ukraine related to poor quality and interrupted service. Sanitation is also problematic in Belarus, Georgia
and the Russian federation where 15-22% of the samples do not meet chemical standards (WB 2005a).
16areas. While the majority of the urban housing (80-98 percent) has piped water, two thirds of
the dwellings in rural Moldova, Albania and Romania lack modern water and sewerage
facilities. The comparative data suggest a backlog in the provision of sewer for close to 80-70
percent of the dwellings in Bosnia & Herzegovina and Moldova. In Albania and Romania 60
percent of the dwellings lack these essential services. Furthermore, the scarcity of resources
for much-needed upgrades in the technical infrastructure has led to deterioration of existing
networks and frequent disruption of services.
Supplying safe drinking water and adequate sanitation in the housing stock is therefore an
important issue in many countries and requires explicit emphasis on quality. The problems are
complicated by the inability of national governments, municipalities and municipal companies
to ensure maintenance and investment in the existing systems. On the demand side,
contracting incomes and growing poverty have prevented price adjustments to achieve cost
recovery and to provide needed revenue (World Bank 2000; 2005a).
Another indicator which reflects the level of services in the housing stock is associated with
modern heating systems. District heating is widely spread in Western Europe and a fair
number of CEE countries where close to two thirds of the housing stock has access. Across
the CIS as well as in South Eastern Europe, this share is much lower ranging between 16 to
30 percent. Overall access to centralized heating systems across the region is concentrated
in the capital cities and some of largest urban centers.
Age of housing and housing types. Closely related to housing quality are the age
characteristics of the housing stock. The available data indicate that most of the housing
across the region was built after the Second World War, coinciding with urbanization and the
growing affluence in these nations. The oldest part of the stock, built before 1919 in Western
Europe is close to 18 percent, while in most transition countries it constitutes only about 4-5
percent of the total. Greece, Finland and Spain have half of the average share for Western
Europe. Investment in housing provision during communism across the Soviet Union and
Eastern Europe has resulted in waves of new construction, particularly in urban areas since
the 1970s, to respond to urban growth. A principal feature of the socialist housing system was
that new housing was built by state enterprises for rent or sale, while rural areas experienced
growth in the production of single family self-built housing. The output from 1971 to 1989 was
particularly significant in all countries with the exception of Poland, Slovenia, Romania and the
Czech Republic, where the share of new construction between 1946 and 1970 played a more
prominent role (UNECE, 2006, MoIIR, 2006). Not surprisingly, housing production in the post-
transition years added less than 10 percent to the housing stock in most countries in
transition. Elsewhere in Europe countries such as Spain, Ireland and Cyprus stand out with
high rates of construction adding more than 15 percent to the housing stock for the same
period.
Several studies on housing in transition countries have pointed out two important aspects
related to housing quality—the premature ageing of the housing stock and the dominance of
multi-family panel apartment blocks in urban housing markets. While there is a lack of data for
all of the countries, some recent censuses reveal that multi-family panel apartment blocks
account for nearly half of the urban housing stock in Bulgaria, Romania, the Czech Republic
and Moldova. Owing to industrialization and urbanization policies prefabricated housing
dominates the residential landscape of post-communist cities. It makes up 70 percent of all
housing in Bucharest, 45 percent in Sofia and 20 percent in Ljubljana (Tsenkova, 2006). Some
countries in Western Europe also have a fair share of system built, panel housing, mostly a
legacy of post war renewal and reconstruction efforts. Although its quality is substantially
17better, this type of housing today is largely the target for demolitions and various urban regeneration schemes (Baucentrum International, 2004). Multi-family housing is the predominant type across Western Europe and constitutes on average more than 47 percent of the total stock. United Kingdom, Ireland and Belgium are notable exceptions with less than 25 percent of their housing classified as multi-family. In Canada, multifamily housing is less than 12 percent concentrated in five large metropolitan areas. Some estimates, based on aggregated data from 2004, suggest that the share of dwellings in high rise housing with more than four storeys is significant only in Spain (30%), Italy (22.7%) and Portugal (22%). By contrast, in CEE countries the share of high rise housing exceeds 35 percent in Poland, Hungary and Slovakia (MoIIR, 2006) 3 TENURE STRUCTURE AND CHOICE Cross country comparisons on housing tenure are normally criticized for their broad brush approach which does not take into account differences concealed under the tenure label. This is certainly a concern of the countries in the UNECE region where the historical evolution of different housing provision systems has mapped a diverse tapestry of tenure patterns (Boelhouwer and Heijden, 1992; Doling, 1997). On the basis of processes and agencies related to the production, access, financing and consumption of housing, different forms can be identified: public and private rental, private owner-occupied (single family, condominium/equity cooperatives), and other categories related to housing owned by state institutions, tenant cooperatives, under restitution, etc. The division apparently accommodates a number of differences and conceals significant variations within one category. However, this is a common problem in cross-country comparison, which is difficult to overcome especially in transition countries. With the risk of simplifying a very complicated matter the analysis will focus on the main characteristics and common features of different forms of tenure. The available data on tenure distribution—1990 vs. 2004—in selected countries in the ECE region is presented in Table 2. The most recent data identifies wide ranging differences across the region with respect to ownership of housing. Homeownership has grown steadily in most countries, particularly in those in transition. In most of the CEE and CIS countries, owner occupation exceeds 90 percent, which is well above the 65 percent average in Western Europe (Figure 4). In fact, some of the poorest countries in the UNECE region have the highest rates of homeownership. Although some of this housing might actually function as private rental, responding to pressures from migration and labour market adjustment, the tenure structure in the post-communist block is quite polarized leaving a small and residual sector of publicly owned social housing. Social or non-profit rental housing is owned by local governments or social housing providers. Its share is significant in several countries in Western Europe (Austria, Finland, Sweden, and the Netherlands), while in Germany social housing is only 6% of the stock and is declining gradually through estate transfers. In most transition countries, social housing is not really defined in the legislation; however, public rental housing gradually assumes this function. Public housing is owned by local governments and is concentrated in urban areas. It is often funded with municipal or state/public enterprise funds and managed by municipal maintenance companies, which collect rents and handle tenant agreements. Rents are controlled and determined at the local level with some direction from central government (Lux, 2003). Bulgaria and BiH have a share close to 9 percent of the national stock, while in the 18
Figure 4: Homeownership in the ECE Region, 2004
 Western Europe & North America
                            Spain                                                                                 82
                          Ireland                                                                            79
                        Portugal                                                                        75
                         Greece                                                                        74
                             Italy                                                                    73
                            Malta                                                                70
                United Kingdom                                                                  69
                  United States                                                                 69
                        Belgium                                                                68
                         Cyprus                                                                68
                    Luxembourg                                                                 68
                         Canada                                                              66
                         Finland                                                        63
                          France                                                   57
                     Netherlands                                                  56
                         Austria                                             51
                       Denmark                                              49
                       Germany                                         45
                        Sweden                                   38
      Central and Eastern Europe
                         Albania*                                                                                                   100
                         Serbia*                                                                                                  98
                     Montenegro*                                                                                                  98
                         Estonia                                                                                                 96
                        Romania*                                                                                               94
                         Hungary                                                                                              93
                        Bulgaria*                                                                                            92
                FYR Macedonia*                                                                                               92
                        Lithuania                                                                                           91
                         Croatia*                                                                                     87
                 Slovak Republic                                                                                    85
                         Slovenia                                                                                  84
          Bosnia & Herzegovina*                                                                           79
                            Latvia                                                                       77
                         Poland                                                   57
                 Czech Republic                                         47
   Commonwealth of Independent
                  Uzbekistan**                                                                                                     98
                 Kazakhstan**                                                                                                     97
                 Kyrgyzstan**                                                                                                    97
                     Armenia***                                                                                                  96
                     Georgia***                                                                                             92
                   R. Moldova*                                                                                              92
                    Tajikistan**                                                                                           90
                   Azerbaijan**                                                                                   83
                     Belarus***                                                                                   83
               Turkmenistan**                                                                                79
                        Ukraine                                                                        75
         Russian Federation***                                                                  70
                                     0   10      20      30      40         50     60         70         80            90        100
                                                                                                              % of total stock

Source: Author’s estimates based on data from: MoIIRC for EU-25, *Tsenkova (2005) for SEE, **UNECE
database and Duncan, 2005 for CIS.

                                                                                                                  19
Table 2: Housing Tenure Change, 1990-2004
Country 1990 2004
R OO CO O R OO CO O
Western Europe &a North America
Austria 41 55 na 4 41 51 na 9
Belgium a na 0 32 b 38 b na
33 b 67 b 2b
Cyprus* c na 23 b 14 68 na 18
13 b 64 b
Denmark 40 54 5 1 38 49 7 6
Finland 25 72 0 3 33 63 0 4
France 39 54 na 7 40 57 0 3
Germany d na 0b 55 b 45 b na
58 b 42 b 0b
Greece 20 na 4 20 b 74 b na
76 b 6b
Ireland a na 3b 21 79 na na
18 b 79 b
Italy e 19 73 9
25 b 68 b 6b
Luxembourg 30 64 na 6 29 68 na 3
Malta f na na na na b b na
26 70 4b
Netherlands 55 45 na 0 44 56 na 0
Portugal* 28 67 na 5 21 75 na 4
Spain na na
15 b 78 b 7b 11 b 82 b 7b
Sweden g 44 39 17 0 45 38 17 0
United Kingdom h 35 65 na 0 31 69 na 0
Western Europe
Canada
United States
North America
Central and Eastern Europe
Czech Republic* b 40 38 19 3 29 47 17 7
Estonia na na na na 4 96 0 0
Hungary i 36 74 na 0 6 93 na 1
Latvia 79 21 na 0.0 19.0 77.0 4.0 na
Lithuania* na na na na 7.0 91.0 na na
Poland j na na na na 25 57 18 0
Slovak Republic k 28 49 22 1 8 85 7 3
Slovenia l na 61 na 39 9 84 na 7
Notes: R=Rent, OO=Owner-occupied, CO=Cooperative and O=Other
a. BE, IE: occupied dwellings; AT: annual average; pincipal dwellings
b. BE: 1981, 1991, 2002; CY: 1992, 2001; CZ: 1991, 2001; DE: 1993, 2002; ES: 1991, 2003; Ex-GDR: 1993, 2002; GR: 1991, 2001; FR: 1996,
2002; IE: 1997 (EU-SILC inquiry); MT: 2002; PT: 1991, 2001; SE: 2001
c. 1992: Households, 2001: Cenventional dwellings
d. Excluding Ex-GDR
e. Fo 2000 Data Census 2001
f. Data Household Budgetary Survey 2000
g. Co-operative dwellings: Housing co-operatives based on tenant-ownership. A small fraction(Czech Republic, Latvia, Poland, Russia and Ukraine this share tends to be higher than 20
percent (Tsenkova and Turner, 2004; World Bank, 2006b). Ongoing privatization continues to
erode the public rental sector in all four countries, in addition to conversion of old style housing
cooperatives into condominiums.
Privatization of social housing in several countries in Western Europe has supported the
transfer of units to sitting tenants. Although the scale of this tenure transformation and pricing
policies differ, the outcome in quantitative terms is more significant in the United Kingdom,
where 2.16 million units have been privatized since 1989, the Netherlands (286,000 units) and
Italy (130,000) (MoIIR, 2006). By contrast, in transition countries the privatization of housing
was the flagship of the reform process leading to significant transfers of public housing over
the same period—Poland (1.4 million dwellings), Latvia (410,000), and the Slovak Republic
(327,5000). Reform strategies in transition countries mainly differ with respect to the price at
which dwellings were sold to existing tenants. They can be grouped into the following
categories: voucher privatization (BiH, Latvia, Lithuania), privatization free of charge (Albania,
Armenia, Moldova, Georgia, Kazakhstan, Russia), and low-price privatization typically at 10-15
percent of market value (Bulgaria, Romania, Serbia and Montenegro). The extent of sales has
varied considerably both within and between countries. Notwithstanding these differences,
several common problems emerged: (i) privatization progressed rapidly without the necessary
institutional and legal framework for the effective management of multifamily housing; ii) the
transfer of ownership rights in most countries was limited to the dwelling itself without the
necessary provisions for the transfer of corresponding shares of common areas—land,
building envelope, stairs, servicing areas; iii) privatization policies transferred substantial
public assets to low income owners without the necessary resources to deal with the
renovation backlog as well as with rapidly escalating maintenance costs (UNECE, 2003; UN-
HABITAT, 2002b; Tsenkova, 2004).5
Private rental housing is particularly significant in Canada and US where it is close to 30
percent of the housing stock. In Germany, private renting is around the same size as owner
occupation (over 45%), by far the highest share in Western Europe. The size of the private
rental stock in Finland and Sweden is also significant, due to the tenure neutral housing
policies pursued in these countries. Private renting has increased significantly in Central and
Eastern Europe largely as a result of rent control elimination, privatization and restitution of
public housing. Its share is particularly significant in Croatia and Former Yugoslav Republic of
Macedonia (close to 11 and 9 percent respectively). The Czech Republic (7%) and Latvia
(6%) have acquired a substantial share due to restitution policies. In the capital cities private
renting is much more common, though mainly on an informal basis. For example, 28 percent
of housing in Warsaw is privately rented, 5 percent in Bucharest, and close to 15 percent in
Vilnius. Rents in the sector are determined by the market. Reportedly rental market pressures
are considerably high in the capital cities and large urban centers where this type of housing is
often sought by foreign diplomats, businesses and expatriates.
Despite these demand trends, in most countries in the UNECE region, private investors are
still reluctant to get involved in new rental housing provision. Rental agreements, security of
tenure and eviction procedures are specified in various legal acts. In North America and
Western Europe, the private rental sector often provides a much-needed supply of affordable
housing, particularly in the older parts of large urban centers. Low income renters in Canada,
5 In Albania, 98 percent of public housing was transferred to sitting tenants within one year by law. In Moldova, dwellings
were privatized while the buildings remained under public ownership until 1997 when provisions were introduced to transfer
building ownership to the recently established associations of homeowners. From 1992 to 2005, 62.5% of Azerbaijan’s
housing stock was privatized.
21You can also read