Research Institute Global wealth report 2019 - Color gradient or Image placeholder - Credit Suisse
←
→
Page content transcription
If your browser does not render page correctly, please read the page content below

October 2019

Research
Institute
Global wealth report 2019

                        Color gradient or Image placeholder

Thought leadership from Credit Suisse and the world's foremost experts
Editorial

Ten years ago, the Credit Suisse Research               To mark its tenth anniversary, this year’s report
Institute launched the first Global wealth report       examines in more detail the underlying factors
providing the most comprehensive and up-to-             for the evolution of wealth levels and wealth dis-
date survey of household wealth. Since then the         tribution. The growth records of countries can be
Global wealth report has become the standard            quite different depending on whether wealth is
reference point to monitor wealth growth across         measured in US dollars or domestic currencies,
countries and the extent to which wealth inequalities   or in nominal or inflation-adjusted units. In the
are widening or narrowing.                              longer term, the most successful countries are
                                                        those that succeed in raising wealth as a multiple
For the past decade, global wealth creation has         of Gross Domestic Product (GDP) by addressing
centered around China and the United States.            institutional and financial-sector deficiencies.
This year, the United States extended its un-           This can result in a virtuous cycle in which
broken spell of wealth gains, which began after         higher wealth stimulates GDP growth, which in
the global financial crisis in 2008. The United         turn raises aggregate wealth. China, India and
States also accounts for 40% of dollar million-         Vietnam provide examples of this virtuous cycle
aires worldwide and for 40% of those in the top         in action.
1% of global wealth distribution. Wealth in China
started the century from a lower base, but grew         Second, the report looks at the evolution of
at a much faster pace during the early years. It        wealth inequality. The bottom half of wealth
was one of the few countries to avoid the impact        holders collectively accounted for less than 1%
of the global financial crisis. China’s progress        of total global wealth in mid-2019, while the
has enabled it to replace Europe as the principal       richest 10% own 82% of global wealth and
source of global wealth growth and to replace           the top 1% alone own 45%. Global inequality
Japan as the country with the second-largest            fell during the first part of this century when a
number of millionaires. More tellingly, China           narrowing of gaps between countries was rein-
overtook the United States this year to become          forced by declining inequality within countries.
the country with most people in the top 10% of          While advances by emerging markets contin-
global wealth distribution.                             ued to narrow the gaps between countries,
                                                        inequality within countries grew as economies
The rest of the world has not stood still. Other        recovered after the global financial crisis. As a
emerging markets – India in particular – have           result, the top 1% of wealth holders increased
made a steady contribution, which we expect             their share of world wealth. This trend appears
to continue over the next five years. However,          to have abated in 2016 and global inequality is
overall worldwide growth was modest in the 12           now likely to edge downward in the immediate
months up to mid-2019. Aggregate global wealth          future.
rose by USD 9.1 trillion to USD 360.6 trillion,
representing a growth rate of 2.6%. Wealth per          Given some of this year’s intriguing findings, we
adult grew by just 1.2% to USD 70,850 per adult         hope you will find the Global wealth report 2019
in mid-2019. The number of new millionaires             a valuable source of information and wish you
was also relatively modest, up 1.1 million to 46.8      interesting reading.
million. The United States added 675,000 new-
comers, more than half of the global total. Japan
and China each contributed more than 150,000,           Urs Rohner
but Australia lost 124,000 millionaires following a     Chairman of the Board of Directors
fall in average wealth.                                 Credit Suisse Group AG

2
02    Editorial

                                         05    Global wealth 2019: The year in review

                                         17     The evolution of wealth levels

                                         25     The evolution of wealth distribution

                                         37     Wealth outlook

                                         43     Wealth of nations

                                                44   United States – Growth amid worries
                                                45   China – Stalled growth
                                                46   India – Still growing
                                                47   Russia – Changing fortunes
                                                48   Germany – Holding pattern
                                                49   United Kingdom – On the brink?
                                                50   Switzerland – View from the top
                                                51   Singapore – Renewed growth
                                                52   Japan – Keeping calm
                                                53   South Korea – Carrying on
                                                54   Indonesia – Renewed growth
                                                55   South Africa – Little movement
                                                56   Brazil – South American giant
                                                57   Chile – Latin American wealth leader
                                                58   Canada – Paused growth
                                                59   Australia – Still resilient

                                         60    About the authors

                                         61     General disclaimer / important information

                                         For more information, contact:

                                         Richard Kersley
                                         Head Global Thematic Research, Global Markets
                                         Credit Suisse International
                                         richard.kersley@credit-suisse.com
Cover photo: GettyImages, Achim Thomae

                                         Nannette Hechler-Fayd’herbe
                                         Chief Investment Officer International Wealth Management
                                         and Global Head of Economics & Research
                                         Credit Suisse AG
                                         nannette.hechler-fayd’herbe@credit-suisse.com

                                         Credit Suisse Research Institute
                                         research.institute@credit-suisse.com
                                         credit-suisse.com/researchinstitute

                                                                        Global wealth report 2019   3
4
Global wealth 2019:
The year in review
Anthony Shorrocks, James Davies and Rodrigo Lluberas

Now in its tenth edition, the Credit Suisse Global wealth report is the most
comprehensive and up-to-date source of information on global household
wealth. Global wealth grew during the past year, but at a very modest pace.
Although wealth per adult reached a new record high of USD 70,850, this is
only 1.2% above the level of mid-2018, before allowing for inflation. While
more than half of all adults worldwide have a net worth below USD 10,000,
nearly 1% of adults are millionaires who collectively own 44% of global
wealth. However, the trend toward increasing inequality has eased, and the
share of the top 1% of wealth holders is below the recent peak in 2016.

Figure 1: Annual contribution (%) to growth of wealth                              Prospects for global wealth growth
per adult by component, 2000–19
                                                                                   The wealth growth spurt in 2017 evoked mem-
 20                                                                                ories of the “golden age” for wealth during the
                                                                                   early years of the century, when annual growth
 15                                                                                averaged 10%. However, it was not sustained
                                                                                   (Figure 1). Total global wealth reached USD
 10                                                                                351.5 trillion at end-2017, but then dipped to
                                                                                   USD 345.4 trillion at end-2018 before recovering
  5                                                                                to USD 360.6 trillion in mid-2019. The 2.6%
                                                                                   increase in total global wealth since end-2017
  0                                                                                is reduced to 0.6% for global wealth per adult,
                                                                                   which rose from USD 70,460 to USD 70,850
 -5                                                                                over the same period. But this low growth is
                                                                                   partly attributable to US dollar appreciation: using
-10
                                                                                   5-year average exchange rates, total wealth has
                                                                                   grown by 5.9% since end-2017, and wealth per
-15
      01 02 03 04 05 06 07 08 09 10 11 12 13 14 15 16 17 18 19
                                                                                   adult by 3.8%.

        Financial wealth        Non-financial wealth            Debt   Net worth   Based on the evidence since the financial
                                                                                   crisis, secular global wealth growth appears to
                                                                                   be closely aligned with global Gross Domestic
Source: James Davies, Rodrigo Lluberas and Anthony Shorrocks,                      Product (GDP) growth. Asset price inflation
Global wealth databook 2019                                                        and/or USD depreciation can temporarily flatter
                                                                                   the wealth growth figures, but cannot alter the
                                                                                   longer-term trends. From this perspective, the
                                                                                   golden age at the start of the century was prob-
                                                                                   ably due to a favorable combination of factors,

                                                                                                            Global wealth report 2019   5
Table 1: Change in household wealth 2018–19 by region

                       Total         Change in total         Wealth    Change          Change in financial    Change in non-      Change in debts
                      wealth            wealth              per adult in wealth             assets            financial assets
                                                                      per adult
                       2019       2018-19      2018-19        2019       2018-19      2018-19     2018-19    2018-19   2018-19   2018-19   2018-19
                      USD bn       USD bn          %           USD           %         USD bn       %        USD bn       %      USD bn      %

Africa                 4,119         130          3.3         6,488         0.4             1       0.1       164         6.6      35        7.7

Asia-Pacific          64,778         825          1.3        54,211         -0.3            539     1.5       672         1.9     386        4.2

China                 63,827        1,889          3.1       58,544          2.6            88      0.2       2,273       7.5     471       10.9

Europe                90,752        1,093          1.2       153,973         1.2            127     0.3       1,156       2.0     190        1.4

India                 12,614         625           5.2       14,569          3.3            37      1.4       708         6.9     120       11.5

Latin America          9,906         463           4.9       22,502          3.2            193     4.0       340         5.7      70        5.0

North America         114,607       4,061          3.7       417,694         2.7        3,334       3.6       1,353       3.8     626        3.8

World                 360,603       9,087          2.6       70,849          1.2        4,319       2.0       6,666       3.7     1,898      4.0

Source: James Davies, Rodrigo Lluberas and Anthony Shorrocks, Global wealth databook 2019

most especially the rapid transformation of China                     mid-2019, they grew faster than financial assets
from an emerging nation in transition to a fully                      in every region. Non-financial wealth accounted
fledged market economy. There is no reason to                         for the bulk of new wealth in China, Europe
expect that comparable conditions will occur in                       and Latin America, and almost all new wealth
the near future. Indeed, as interest rates recover,                   in Africa and India. Household debt rose even
lower house-price rises and lower equity-price                        faster, at 4.0% overall. Our estimates indicate
inflation will likely depress wealth growth in many                   that household debt increased in all regions, and
countries.                                                            at a double-digit rate in China and India.

                                                                      Total wealth rose in all regions last year. North
An overview of the past year                                          America added USD 4.1 trillion to its stock
                                                                      of household wealth, of which USD 3.9 tril-
More details of wealth growth during the 12                           lion came from the United States. China and
months to mid-2019 are provided in Table 1.                           Europe contributed another USD 3.0 trillion, and
Aggregate global wealth rose by USD 9.1                               Asia-Pacific (excluding China and India) a further
trillion to USD 360.6 trillion, representing a                        USD 825 billion. Despite the economic troubles
growth rate of 2.6%. This is an improvement                           in Argentina and Venezuela, wealth in Latin
on the decline experienced during 2014–15,                            America rose by USD 463 billion, with Brazil
but below the average growth recorded since                           accounting for USD 312 billion. In percentage
the financial crisis in 2008. Nevertheless, it                        terms, India (5.2%) and Latin America (4.9%)
exceeded population growth, so that average                           grew at the fastest rate, with Africa, China and
wealth grew by 1.2% to USD 70,850 per adult,                          North America recording gains of 3%–4%.
an all-time high yet again.
                                                                      US dollar appreciation is one reason for these
Financial assets suffered most during the                             relatively modest increases. Using smoothed
financial crisis, and recovered better in the early                   exchange rates, total global wealth rose by USD
post-crisis years. This year, their value rose in                     11.8 trillion, rather than USD 9.1 trillion. New
every region, contributing 39% of the increase                        wealth in China is assessed as USD 3.5 trillion
in gross wealth worldwide, and 71% of the                             instead of USD 1.9 trillion, and the gain in
rise in North America. However, non-financial                         Europe becomes USD 2.7 trillion rather than
assets have provided the main stimulus to overall                     USD 1.1 trillion. However, smoothed exchange
growth in recent years. Over the 12 months to                         rates result in a net loss in other regions.

6
Winners and losers among countries                                again, followed by Japan (USD 930 billion), India
                                                                                                  (USD 625 billion), and Brazil (USD 312 billion).
                                Comparing total wealth gains and losses across                    The main losses occurred in Australia (down USD
                                the most important countries, the United States                   443 billion), Turkey (down USD 257 billion) and
                                (USD 3.8 trillion) again leads the way by a                       Pakistan (down USD 141 billion).
                                considerable margin, continuing an astonishing
                                spell that has seen wealth per adult increase                     Viewed in terms of wealth per adult, Switzerland
                                each year since 2008 (however, even the United                    tops the winners (up USD 17,790) followed by
                                States is not immune to temporary blips: wealth                   the United States (USD 11,980), Japan (USD
                                per adult fell by 2% during the latter half of                    9,180) and the Netherlands (USD 9,160): see
                                2018, then recovered during the first half of                     Figure 2. The main loser was Australia (down
                                2019). China (USD 1.9 trillion) is in second place                USD 28,670), with other significant losses in
                                                                                                  Norway (down USD 7,520), Turkey (down USD
                                                                                                  5,230) and Belgium (down USD 4,330).

Figure 2: Change in wealth per adult 2018–19,
biggest gains and losses

                                                                                    Switzerland
                                                                           United States
                                                                                                  Non-financial assets
                                                                        Japan
                                                                        Netherlands
                                                                                                  have provided the
                                                                        New Zealand
                                                                    Singapore                     main stimulus to
                                                                                                  overall growth in
                                                                 Israel
                                                                Canada

                                                                                                  recent years
                                                                Spain

                                      Belgium
                                      Turkey
                                   Norway
Australia

      -30,000         -20,000          -10,000        0           10,000             20,000

                                                                                          USD     Asset prices and exchange rates

                                                                                                  Much of the year-on-year variation in wealth
Figure 3: Change in market capitalization, house prices                                           levels is due to changes in asset prices and
and USD exchange rate (%), 2018–19                                                                exchange rates. Exchange-rate fluctuations are
                                                                                                  frequently the source of the biggest gains and
                                                                                                  losses. However, exchange rates have been
                                                                                                  relatively stable over the past 12 months. Among
                                                                             Canada               the countries reported in Figure 3 (G7 coun-
                                                                             China                tries plus China, India and Russia), the largest
                                                                                                  changes affected China and the United Kingdom
                                                                             France
                                                                                                  – both depreciating about 3.5% versus the US
                                                                             Germany              dollar. Currency falls were modest elsewhere in
                                                                             India                the world, except for Turkey (–21%), Pakistan
                                                                                                  (–24%) and Argentina (–32%). Currency appre-
                                                                             Italy
                                                                                                  ciation was even rarer, with Thailand (+8%) and
                                                                             Japan                Egypt (+7%) recording the biggest gains.
                                                                             Russia
                                                                                                  Equity prices showed greater regional fluc-
                                                                             United Kingdom
                                                                                                  tuations. Market capitalization rose in North
                                                                             United States        America, but declined in much of Europe by an
-15         -10        -5          0         5        10        15         20
                                                                                                  average of about 10%. Markets rose significantly
                                                                                                  in Russia (+15%), and by an even greater extent
       House prices           Market capitalization        USD exchange rate
                                                                                                  in Kuwait (+25%), Brazil (+35%) and Romania
                                                                                                  (+36%). In Pakistan, market capitalization
Source Figures 2 and 3: James Davies, Rodrigo Lluberas and Anthony Shorrocks,                     dropped by 42%, compounding the impact of
Global wealth databook 2019                                                                       exchange rate losses.

                                                                                                                          Global wealth report 2019   7
House-price movements are a proxy for 279,000 to 304,000. Iceland and Luxembourg
changes in household non-financial assets, and probably rank above this last group, but data for
have been relatively subdued in recent years. these two countries is less reliable.
House price declines did not happen in the
ten countries listed in Figure 3, and were also The ranking by median wealth per adult favors
rare elsewhere in the world, Australia (–6%) places with lower levels of wealth inequality and
being the only recorded instance of a drop of produces a slightly different table. Australia (USD
more than 2%. India (+6%) and China (+9%) 181,360) overtakes Hong Kong SAR (USD
were among the nations experiencing a robust 146,890) to gain second place, but remains below
housing market, joined at the top by Colombia, Switzerland (USD 227,890). New Zealand,
Portugal, Hungary and the Philippines in the Canada, and the United Kingdom retain similar
10%–13% range, and Argentina, where house positions in the top ten, but lower-than-average
prices rose 45% in domestic currency (but only inequality raises Belgium (USD 117,090) to fourth
11% in USD). place, Japan (USD 110,410) to sixth, Ireland
(USD 104,840) to eighth, and France (USD
101,940) to ninth. In contrast, Singapore slips to
Wealth per adult across countries eleventh, while the United States, Denmark and
the Netherlands all drop ten places or more.
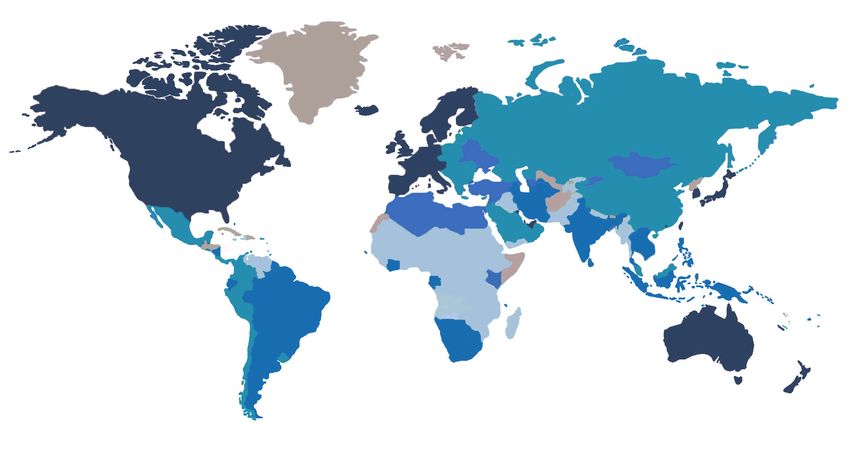
The world wealth map (Figure 4) captures
the huge differences in average wealth across The “intermediate wealth” group in Figure 4
countries and regions. Nations with wealth per covers countries with mean wealth in the range of
adult above USD 100,000 are located in North USD 25,000–100,000. The core members are
America, Western Europe, and among the China and Russia. But the group also includes
richer Asia-Pacific and Middle Eastern coun- many recent entrants to the European Union
tries. Switzerland (USD 564,650) again tops (EU), together with important emerging-market
the ranking according to wealth per adult, but economies in Latin America and the Middle East.
our revised estimates now place Hong Kong One step below, the “frontier wealth” range from
SAR, (USD 489,260) second, followed by the USD 5,000–25,000 per adult encompasses
United States (USD 432,370) and Australia many heavily populated countries including India,
(USD 386,060). New Zealand, Singapore, Brazil, Indonesia, Iran, the Philippines, and Turkey.
Canada, Denmark, the United Kingdom and the The segment also contains most of Latin America,
Netherlands occupy the remaining slots in the many countries bordering the Mediterranean, and
top ten, with wealth per adult ranging from USD transition nations outside the EU. The remaining
Figure 4: World wealth map 2019
Wealth levels (USD)
Below USD 5,000
USD 5,000 to 25,000
USD 25,000 to 100,000
Over USD 100,000
No data
Source: James Davies, Rodrigo Lluberas and Anthony Shorrocks, Global wealth databook 2019
8
Figure 5: The global wealth pyramid 2019                                                   Distribution of wealth across individuals

                                                                                           Variation in average wealth across countries
                                      47 m (0.9%)                                          accounts for much of the observed inequality
                      > USD 1 million               USD 158.3 trn                          in global wealth, but there is also considerable
                                                    (43.9%)
                                                                                           disparity within nations. To determine how global
                    USD 100,000          499 m          USD 140.2 trn                      wealth is distributed across individual adults, we
                    to 1 million         (9.8%)         (38.9%)
                                                                                           combine our estimates of the level of household
                                                                                           wealth across countries with information on the
             USD 10,000                 1,661 m                  USD 55.7 trn              pattern of wealth distribution within countries.
             to 100,000                 (32.6%)                  (15.5%)                   The wealth pyramid in Figure 5 captures the
                                                                                           wealth differences between adults. The large
                                                                                           base of low-wealth holders underpins higher
  < USD 10,000                                                          USD 6.3 trn
                                                                        (1.8%)
                                                                                           tiers occupied by progressively fewer adults. We
                                        2,883 m
                                        (56.6%)
                                                                                           estimate that 2.9 billion individuals – 57% of all
Wealth range                                                                Total wealth   adults in the world – have wealth below USD
                                                                            (% of world)
                                                                                           10,000 in 2019. The next segment, covering
                                                                                           those with wealth in the range USD 10,000–
                          Number of adults (percent of world adults)                       100,000, has seen the biggest rise in numbers
                                                                                           this century, trebling in size from 514 million in
                                                                                           2000 to 1.7 billion in mid-2019. This reflects
Source: James Davies, Rodrigo Lluberas and Anthony Shorrocks,                              the growing prosperity of emerging economies,
Global wealth databook 2019                                                                especially China, and the expansion of the middle
                                                                                           class in the developing world. The average wealth
                                                                                           of this group is USD 33,530, a little less than half
                                                                                           the level of average wealth worldwide, but consid-
                                                                                           erably above the average wealth of the countries
                                                                                           in which most of the members reside. Total assets
                                                                                           amounting to USD 55.7 trillion provide this seg-
                              members of this category include South Africa                ment with considerable economic leverage.
                              and other leading sub-Saharan nations, along
                              with several fast-developing Asian countries
                              like Cambodia, Laos, Thailand and Vietnam.
                              This leaves the final group of countries with
                              wealth below USD 5,000, which are heavily
                              concentrated in central Africa and central and
                              south Asia.                                                  This reflects the
                                                                                           growing prosperity of
                              Regional distribution of wealth
                                                                                           emerging economies,
                              The World Wealth Map (Figure 4) illustrates
                              the geographical imbalance in the distribution               especially China
                              of household wealth. North America and
                              Europe together account for 57% of total
                              household wealth, but contain only 17% of
                              the world adult population. The two regions
                              had similar total wealth at one time, but
                              North America now accounts for 32% of                        The upper-middle segment, with wealth ranging
                              global wealth compared to 25% for Europe.                    from USD 100,000 to USD 1 million, has also
                              Elsewhere, the share of wealth is below the                  expanded significantly this century, from 212
                              population share. The discrepancy is modest in               million to 499 million. They currently own net
                              China and in the Asia-Pacific region (excluding              assets totaling USD 140.2 trillion or 39% of
                              China and India), where the population share                 global wealth, which is four times their share of
                              is 20%–30% higher than the wealth share.                     the adult population. The wealth middle class
                              But the population share is more than three                  in developed nations typically belongs to this
                              times the wealth share in Latin America, five                group. Above them, the top tier of high net worth
                              times the wealth share in India, and over ten                (HNW) individuals (i.e. USD millionaires) remains
                              times the wealth share in Africa.                            relatively small in size – 0.9% of all adults in
                                                                                           2019 – but increasingly dominant in terms of
                                                                                           total wealth ownership and their share of global
                                                                                           wealth. The aggregate wealth of HNW adults
                                                                                           has grown nearly four-fold from USD 39.6 trillion

                                                                                                                    Global wealth report 2019   9
in 2000 to USD 158.3 trillion in 2019, and the         Figure 6: Regional composition of global wealth distribution
share of global wealth has risen from 34% to           in 2019
44% over the same period.
                                                       100%
Membership of the layers of the wealth pyramid          90%                                 Latin America                        North
is quite distinctive in terms of residence and                                                                                   America
                                                        80%
personal characteristics. The base tier has the                           Africa
most even distribution across regions and coun-         70%
tries, but also the widest spread of personal                                                                               Europe
                                                        60%
circumstances. In developed countries, about
                                                        50%                                                   China
30% of adults fall within this category, and for
                                                                             India
the majority of these individuals, membership is        40%
either transient – due to business losses or un-        30%
employment, for example – or a life-cycle phase
                                                        20%
associated with youth or old age. In contrast, in                            Asia-Pacific
many lower-income countries, more than 80%              10%

of the adult population fall within this wealth          0%
range, so life membership of the base tier is                 10     20      30      40     50    60     70      80    90   95     99      100
often the norm.                                                                                                                    Percentile

                                                       Source: James Davies, Rodrigo Lluberas and Anthony Shorrocks,
                                                       Global wealth databook 2019

The aggregate
wealth of HNW
                                                       Global wealth distribution
adults has grown
                                                       The regional pattern of wealth distribution can
nearly four-fold                                       be explored further by assigning adults to their
                                                       corresponding global wealth positions. Our
                                                       calculations indicate, for example, that a person
                                                       needs net assets of just USD 7,087 to be
                                                       among the wealthiest half of world citizens in
                                                       mid-2019. However, USD 109,430 is required
                                                       to be a member of the top 10% of global
The main feature of the two middle pyramid             wealth holders, and USD 936,430 to belong to
segments is the dominance of China, which              the top 1%. Determining global wealth percen-
accounts for 38% of the total membership,              tiles in this way enables the regional member-
compared to 9% from India, 7% from Latin               ship of each global decile (i.e. 10% slice) to be
America, and just 3% from Africa. Regional             portrayed, as in Figure 6.
representation is skewed further still among
millionaires, where 43% of all members reside          Figure 6 illustrates well the features noted
in North America, 28% in Europe, and 16% in            above: the concentration of African and Indian
Asia-Pacific (excluding China and India). Thus,        citizens in the base segment of the wealth
in marked contrast to the base of the wealth           pyramid, the dominance of China in the middle
pyramid (which is characterized by a wide variety      tiers, and the substantial over-representation of
of people from all countries and all stages of         North America and Europe in the top percen-
the life-cycle), HNW individuals are heavily           tile. Also evident is the significant number of
concentrated in particular regions and countries,      North American and European residents in the
and tend to share similar lifestyles – participating   bottom global wealth decile, a reflection of the
in the same global markets for luxury goods,           ease with which individuals – especially younger
for example, even when they reside in different        adults – acquire debt in advanced economies,
continents. The wealth portfolios of these indi-       resulting in negative net wealth. Note too,
viduals are also likely to be more similar, with       that while the bulk of Indians are located in
a focus on financial assets and, in particular,        the bottom half of the global distribution, high
equities, bonds and other securities traded in         wealth inequality and an immense population
international markets.                                 mean that India also has a significant number of
                                                       citizens in the top wealth echelons.

10
Figure 7: Number of dollar millionaires (% of world total) High net worth individuals by country
by country 2019
For any given country, the number of millionaires
depends on three factors: the size of the adult
India, 2 Korea, 2 population, average wealth and wealth inequality.
Switzerland, 2 Taiwan (Chinese Taipei), 1 The United States scores highly on all three
Netherlands, 2 Hong Kong SAR, China, 1 criteria and has by far the greatest number of
Spain, 2 millionaires: 18.6 million, or 40% of the world
Australia, 3 total (Figure 7). For many years, Japan held
Canada, 3
second place in the millionaire rankings by a
Italy, 3
comfortable margin. However, Japan is now in
France, 4 United States, 40 third place with 6%, overtaken by China (10%).
Germany, 5 Next come the United Kingdom and Germany
with 5% each, followed by France (4%), then
United Kingdom, 5 Italy, Canada and Australia (3%). Spain, the
Japan, 6 Netherlands, Switzerland, India and Korea each
host 2% of global millionaires, with Taiwan (Chinese
China, 10 Rest of World, 11
Taipei) and Hong Kong SAR also accounting for at
least 1% of HNW citizens worldwide.
Millionaire trends
Our estimates for mid-2019 show 46.8 million
millionaires worldwide, up 1.1 million on mid-
Our estimates for 2018 (Table 2). The United States added more
than half of this number – 675,000 new million-
mid-2019 show 46.8 aires – to its sizable stock. This exceeded the
extra newcomers in the next nine countries com-
million millionaires bined: Japan, China, Germany, the Netherlands,
Brazil, India, Spain, Canada and Switzerland. The
worldwide decline in average wealth in Australia resulted
in 124,000 fewer millionaires, but losses were
relatively modest elsewhere, e.g. 27,000 in the
United Kingdom and 24,000 in Turkey.
Table 2: Change in the number of millionaires by country, 2018–19
Adults (thousands) with wealth Adults (thousands) with wealth
Main gains Main losses
above USD 1 m above USD 1 m
Country 2018 2019 Change Country 2018 2019 Change
United States 17,939 18,614 675 Australia 1,303 1,180 -124
Japan 2,838 3,025 187 United Kingdom 2,488 2,460 -27
China 4,289 4,447 158 Turkey 118 94 -24
Germany 2,122 2,187 65 Italy 1,516 1,496 -19
Netherlands 789 832 43 Saudi Arabia 163 147 -16
Brazil 217 259 42 Hong Kong SAR 528 516 -12
India 725 759 34 France 2,083 2,071 -11
Spain 945 979 33 Greece 76 68 -7
Canada 1,293 1,322 30
Switzerland 791 810 19
World 45,647 46,792 1,146 World 45,647 46,792 1,146
Source Figure 7 and Table 2: James Davies, Rodrigo Lluberas and Anthony Shorrocks, Global wealth databook 2019
Global wealth report 2019 11The apex of the pyramid Figure 8: The top of the pyramid, 2019
The methodology we employ allows us to ex-
amine the distribution of wealth within the HNW > USD 50 million 168,030
group in more detail. Our calculations suggest
that the vast majority of the 46.8 million million- USD 10 to 50 million 1,837,290
aires in mid-2019 have wealth between USD 1
million and USD 5 million: 41.1 million or 88% of USD 5 to 10 million 3,682,140
the HNW group (Figure 8). Another 3.7 million
adults (7.9%) are worth between USD 5 million
and 10 million, and almost exactly two million
adults now have wealth above USD 10 million. USD 1 to 5 million 41,104,790
Of these, 1.8 million have assets in the USD
10–50 million range, leaving 168,030 Ultra High
Net Worth (UHNW) individuals with net worth
above USD 50 million in mid-2019.
Wealth Number
range of adults
Ultra-high net worth individuals
Among the UHNW group in mid-2019, we esti-
mate that 55,920 adults are worth at least USD
100 million, and 4,830 have net assets above USD
500 million. North America dominates the regional Source: James Davies, Rodrigo Lluberas and Anthony Shorrocks,
breakdown, with 84,050 members (50%), while Global wealth databook 2019
Europe has 33,550 (20%), and 22,660 (14%) live
in Asia-Pacific countries, excluding China and India.
Among individual countries, the United States leads
by a huge margin with 80,510 members, equiv-
alent to 48% of the world total (Figure 9). China
is a clear second with 18,130 UHNW individuals,
followed by Germany (6,800), the United Kingdom
(4,640), India (4,460) and France (3,700). The
remaining countries in the top ten list are Canada
(3,530), Japan (3,350), Russia (3,120) and Hong
Kong SAR (3,100).
Figure 9: Ultra-high net worth individuals in 2019, top 20 countries
0 10,000 20,000 30,000 40,000 50,000 60,000 70,000 80,000 90,000
United States
China
Germany
United Kingdom
India
France
Canada
Japan
Russia
Hong Kong SAR, China
Korea
Italy
Australia
Brazil
Taiwan (Chinese Taipei)
Spain
Switzerland
Sweden
Netherlands
Saudi Arabia
USD 50 m - 100 m USD 100 m - 500 m > USD 500 m
Source: James Davies, Rodrigo Lluberas and Anthony Shorrocks, Global wealth databook 2019
12During the past year, the total number of The trend in wealth inequality is less clear. Our
UHNW adults has risen by 6,870 (4%), with estimates suggest that wealth inequality declined
every region except Africa recording a net within most countries during the early years of the
increase. The regions adding most members century. For the world as a whole, the decline
were North America (4,570), Latin America is more evident as the decline in inequality
(870) and Europe (710). China (up 370) and within countries was reinforced by a drop in
India (up 54) had a relatively quiet year. The indi- “between-country” inequality fueled by rapid
vidual countries gaining the most members were rises in average wealth in emerging markets.
the United States (4,200) and – more surprisingly The trend became mixed after the financial crisis
– Brazil (860) and Russia (400). Losses occurred as financial assets grew rapidly in response to
in Korea (down 140), Turkey (down 230), Italy quantitative easing and artificially low interest
(down 270) and Australia (down 280). rates. These factors raised the share of the top
1% of wealth holders, but inequality continued
to decline for those below the upper tail. Today,
Wealth inequality the share of the bottom 90% accounts for 18%
of global wealth, compared to 11% in the year
The level and trend of wealth inequality is mon- 2000.
itored closely as an indicator of broader social
trends. There is no doubt that the level of wealth Since 2016, non-financial assets have grown
inequality is high, both within countries and for faster than financial assets and the share of the
the world as a whole. For example, the bottom top 1% has eased back. Figure 10 shows that
half of adults account for less than 1% of total the top 1% share rose between 2007 and 2016
global wealth in mid-2019, while the richest in every one of the selected countries (except
decile (top 10% of adults) possesses 82% of India), but has subsequently declined in every
global wealth and the top percentile alone owns country (except Brazil). Inequality in the world as
nearly half (45%) of all household assets. Wealth a whole echoes these trends within countries.
inequality is lower within individual countries: While it is too early to say that wealth inequal-
typical values would be 35% for the share of the ity is now in a downward phase, the prevailing
top 1% and 65% for the share of the top 10%. evidence suggests that 2016 may have been the
But these levels are still much higher than the peak for the foreseeable future.
corresponding figures for income inequality, or
any other broad-based welfare indicator.
Figure 10: Wealth share of top 1%, selected countries and years
65
60
55
50
45
40
35
30
25
20
15
10
Japan France Italy United China Germany United States Brazil India Russia World
Kingdom
2000 2007 2016 2019
Source: James Davies, Rodrigo Lluberas and Anthony Shorrocks, Global wealth databook 2019
Global wealth report 2019 13Monitoring world wealth Wealth varies greatly across individuals in every
part of the world. Our estimates suggest that
Wealth is a key component of the economic the lower half of the global population collectively
system, valued as a source of finance for future owns less than 1% of global wealth, while the
consumption, particularly in retirement, and for richest 10% of adults own 82% of all wealth and
reducing vulnerability to shocks such as unem- the top 1% account for almost half of all global
ployment, ill health, or natural disasters. Wealth assets. Wealth inequality fell at all levels of the
also enhances opportunities for informal sector distribution from the year 2000 until the global
and entrepreneurial activities, when used either financial crisis in 2008, and has continued to do
directly or as collateral for loans. These func- so for those below the upper tail of the world
tions are less important in countries that have wealth distribution. However, after the global
generous state pensions, adequate social safety financial crisis, the share of the top 1% rose
nets, good public healthcare, high-quality public in response to bullish financial markets, and a
education and well-developed business finance. strengthening US dollar. These underlying factors
Conversely, the need to acquire personal assets have waned and it seems more likely that wealth
is particularly compelling and urgent in countries inequality is now falling at all levels.
that have rudimentary social insurance schemes
and reduced options for business finance, as is For this tenth anniversary edition, we have
the case in much of the developing world. adopted a new format. The next two chapters
explore in more detail the drivers which influence
the level and distribution of wealth. Chapter 2
examines the level and trend of wealth per adult,
focusing where possible on the real wealth per
adult in local currency units. Particular attention
is also given to the contribution of China and
Our estimates suggest other emerging markets to the overall global
trends. Chapter 3 explores in a similar way the
that wealth inequality links between wealth distribution and factors
such as savings rates, population growth, equity
declined within most price rises and house price inflation. Chapter 4
contains our usual 5-year projections for wealth
of the countries during holdings for the period up to 2024.
the early years of the Our estimates for the past are regularly updated
when new or revised data from reliable sources
century becomes available. We also strive continuously to
improve the methods used to estimate the level
and distribution of wealth. The Global wealth
databook 2019 provides details of the data
sources and outlines the research methodology
underpinning our results. It also contains much
The Credit Suisse Global wealth report offers additional data.
a comprehensive portrait of world wealth,
covering all regions and countries, and all
parts of the wealth spectrum from rich to poor.
Valued at current exchange rates, total global
wealth increased by USD 9.1 trillion (or 2.6%)
in the year to mid-2019. However, the gain
increases to USD 11.8 trillion when exchange
rates are averaged over five years. The United
States again led the way with a gain of USD
3.8 trillion due mostly to financial assets,
although non-financial wealth increased at a
faster rate. In other regions, the gains accrued
primarily from non-financial assets.
14Notes on concepts and methods or “country,” although the latter also includes
economically self-governing territories such as
Net worth, or “wealth,” is defined as the value Hong Kong SAR, China, Macau SAR, China,
of financial assets plus real assets (principally and Taiwan (Chinese Taipei).
housing) owned by households, minus their
debts. This corresponds to the balance sheet The “Asia-Pacific” region excludes China and
that a household might draw up, listing the items India, which are treated separately due to the
which are owned, and their net value if sold. size of their populations.
Private pension fund assets are included, but not
entitlements to state pensions. Human capital is Data for 2018 and 2019 refer to mid-year
excluded altogether, along with assets and debts (end-June) estimates; the figures for earlier
owned by the state (which cannot easily be years indicate year-end values.
assigned to individuals).
The Forbes annual global list of billionaires is used
Valuations are usually expressed in terms of US to improve the estimates of wealth holdings above
dollars using end-period exchange rates, but USD 1 million. The Forbes data is pooled for all
“smoothed exchange rates” (specifically 5-year years since 2000, and well-established statistical
moving end-period averages) are used instead techniques are then applied to estimate the inter-
where indicated. mediate numbers in the top tail. This produces
plausible values for the global pattern of asset
For convenience, we disregard the relatively holdings in the high net worth (HNW) category
small amount of wealth owned by children on from USD 1 million to USD 50 million, and in the
their own account, and frame our results in ultra-high net worth (UHNW) range from USD
terms of the global adult population, which 50 million upward. Further details are given in
totaled 5.1 billion in 2019. For convenience the Global wealth databook 2019.
also, residence location is referred to as “region”
Global wealth report 2019 15GettyImages, golero 16
The evolution of
wealth levels
James Davies and Anthony Shorrocks

The century began with a “golden age” of robust and inclusive wealth
creation. But wealth collapsed during the financial crisis and growth
never recovered to the level experienced earlier. This chapter examines
the evolution of the level of wealth this century. We document the
seismic change at the time of the financial crisis, when China and other
emerging market economies took over as the engine of wealth creation.
We also explore how GDP growth and variations in the wealth/GDP
ratio help explain trends over time in wealth levels for individual countries.

Figure 1: Global trends in assets and debts per adult, 2000–19                  The end of the “golden age”

USD                                                                             This century, household wealth experienced two
                                                                                distinct phases. The early years saw the most
80,000
                                                                                remarkable spell of wealth creation in recent
70,000                                                                          history. It was notable not only for the rapid
                                                                                expansion – total wealth grew at an annual rate
60,000                                                                          exceeding 10% – but also for the breadth of
                                                                                coverage. Wealth increased significantly in every
50,000
                                                                                region of the world. Emerging market econo-
40,000                                                                          mies, especially China and India, did not simply
                                                                                benefit from this growth, but drove much of the
30,000                                                                          action. Coverage of assets was broad too, with
20,000
                                                                                both financial assets and non-financial assets
                                                                                rising at a fast pace. Last but not least, it was
10,000                                                                          socially inclusive: all levels of the wealth pyramid
                                                                                shared in the rewards.
      0
          00 01 02 03 04 05 06 07 08 09 10 11 12 13 14 15 16 17 18 19
                                                                                This golden age came to an abrupt halt with the
                                                                                global financial crisis. While glimpses of the past
       Net worth          Financial wealth        Non-financial wealth   Debt
                                                                                occasionally resurface, robust wealth growth
                                                                                has not been sustained for any length of time. In
Source: James Davies, Rodrigo Lluberas and Anthony Shorrocks,                   fact, real global wealth per adult has fallen one
Global wealth databook 2019                                                     third of the time since 2007.

                                                                                                          Global wealth report 2019   17
Trends in nominal global wealth Figure 2: Growth of wealth per adult using alternative currency
units, selected countries, 2000–19
Figure 1 illustrates some of the core compo-
nents of the evolution this century of house-
China
hold wealth measured in current US dollars.
On this nominal basis, global wealth per adult India
initially rose from USD 31,410 in 2000 to Russia
USD 53,850 in 2007 before dropping back to
Vietnam
USD 48,500 during the financial crisis. Growth
resumed after 2008, but at a lower and more Sweden
erratic pace. Global wealth per adult in mid-
Korea
2019 is USD 70,840, representing average
annual growth of 3.7% since 2008 compared Poland
to 8.0% before the crisis. Thailand
Turkey
Figure 1 also shows the performance of financial
versus non-financial wealth this century. Financial Brazil
wealth exceeded non-financial wealth at the start, France
but non-financial assets grew faster in the pre-
crisis era. By 2007, they each accounted for half Indonesia
of global household wealth. Post-crisis, financial Australia
assets recovered quickly, fueled by a worldwide
Singapore
upsurge in equity markets. The growth rate was
not far short of that experienced in the pre-crisis Chile
years. However, non-financial assets grew very Canada
sluggishly after 2008. By 2016, they were barely
above the pre-crisis peak. They have fared better United Kingdom
more recently and the gap with financial assets United States
has narrowed. However, financial assets remain
Germany
clearly ahead in household portfolios worldwide,
accounting for 55% of gross wealth in mid-2019. Switzerland
Household debts showed more extreme trends Japan
both before and after the financial crisis, doubling
South Africa
in the period 2000–07, but showing almost no
change since then. Mexico
-1 0 1 2 3 4 5 6 7 8 9 10 11 12 13 14 15 16 17
Exchange rates and real wealth USD real USD LCU real LCU
Previous editions of the Global wealth report Source: James Davies, Rodrigo Lluberas and Anthony Shorrocks,
have focused on wealth measured in current US Global wealth databook 2019
dollars. There are practical reasons for doing so
– a common currency unit is needed to compare
country performance and to provide estimates for
regions and the world as a whole. But it is also millionaires now would need assets worth USD
a potential source of distortions, which can in- 1,438,885 to compare properly with their counter-
fluence assessments. This is particularly true for parts at the start of the century. When assessing
year-to-year changes in a country’s total wealth, the performance of countries in more detail, as
average wealth and the number of millionaires. we do here, the natural basis for evaluation is the
In Figure 1, for example, annual fluctuations in local currency unit (LCU), rather than USD, and
average wealth are largely attributable to short- real rather than nominal values since inflation may
term exchange rate movements as the US dollar otherwise distort the underlying trends.
appreciates or depreciates over time. Replacing
current exchange rates with 5-year average ex- Figure 2 illustrates the implications of changing
change rates yields smoother graphs and often the valuation unit by comparing the average
eliminates instances where growth has been annual growth rate of wealth per adult calculated
negative when measured in current US dollars. in USD, real USD, LCU and real LCU, using
the Gross Domestic Product (GDP) deflator to
Another issue is the reliance on nominal rather than convert from nominal to real units. Results are
real currency units. This is less important over short given for a representative selection of countries
time periods, but becomes problematic over the and ordered in terms of the growth rate in real
two decades covered by our data. A US dollar now LCU. China has performed extremely well under
is worth only 69% of its value in the year 2000; any criteria and heads the ranking for three of
18them. However, in terms of growth of wealth per The contribution of emerging markets
adult in LCU, China is fractionally behind Vietnam
and falls some way short of Turkey and Russia. Emerging markets have become increasing-
In these three countries, high wealth growth is ly important to the world economy and this is
accompanied by high inflation which flatters the reflected in their contribution to the evolution of
comparison in nominal LCU. More generally, global household wealth. Figure 3 provides a
emerging markets and developing countries ex- breakdown of growth of global wealth per adult
perience higher inflation than developed nations. in real USD into the contributions of six groups
This leads to faster growth in LCU terms, but this of countries: China, Other emerging markets,
premium disappears once inflation is taken into Europe, High-income Asia-Pacific, North America,
account. Converting into USD performs a similar and Other countries. China is reported separately
function, since exchange rates reflect domestic in- from the other emerging markets because it would
flation relative to inflation in the United States. But otherwise dominate the category.
the USD exchange rate reflects other factors as
well, so that wealth growth in real US dollars does
not exactly match growth in real LCU. The results
given in Figure 2 show that real wealth growth
has tended to be higher when measured in USD,
suggesting that the US dollar has depreciated on
balance against other currencies this century. Emerging markets
Another notable feature of Figure 2 is the strong have become increas-
wealth performance of transition nations (China,
Russia, Vietnam and Poland), which is perfectly ingly important to the
understandable. State ownership severely limits
opportunities for private wealth, so that when world economy
these restrictions are relaxed, there is usually a
catch-up period during which private businesses
are established and thrive, and asset markets
open up. Further stimulus is provided when
state-owned assets – especially land and housing
– are given away or sold at discounted rates. It The overall picture confirms the rapid wealth
is sometimes forgotten, however, that transition expansion at the start of the century followed by
is a one-time event, not to be repeated. It will be a more subdued and more erratic growth record
more difficult for transition countries to maintain in the period since 2007. While China and other
the growth achieved in the early years of reforms. emerging markets grew at fast pace in the early
years, they did so from a low base. As a result,
their contribution to global wealth growth was
quite modest until 2007. Instead, and perhaps
surprisingly, Europe is revealed as the dominant
Figure 3: Annual growth (%) of real wealth per adult (in real source of wealth growth in the pre-crisis years,
USD) by country type, 2000–19 contributing more than half of the rise in world
wealth per adult in real USD. North America is
18 in second place, averaging 19% of the global
16 rise. Of course, both Europe and North America
14
12 started with a large stock of wealth. But Europe’s
10 contribution is also greatly flattered by exchange-
8
6
rate appreciation: the euro gained 67% against
4 the US dollar between 2001 and 2007. Valuing
2 Eurozone wealth at year 2000 exchange rates
0
-2 would reduce European wealth in 2007 by 25%
-4 and global wealth by 10%.
-6
-8
-10 Since 2008, average real USD wealth growth
-12 in Europe has been negative, in part due to re-
-14
01 02 03 04 05 06 07 08 09 10 11 12 13 14 15 16 17 18 19
trenchment of the euro. North America has taken
the lead among the developed nation groupings,
China Other emerging markets accounting for one-third of the rise in global
Europe High-income Asia-Pacific
North America Other countries wealth per adult. However, China has more than
matched North America in the post-crisis era,
and the gap widens if the period is extended
Source: James Davies, Rodrigo Lluberas and Anthony Shorrocks, to 2007 when North America suffered a heavy
Global wealth databook 2019 loss. Other emerging market economies have
Global wealth report 2019 19also made a significant contribution to real Savings behavior is a more likely candidate
global growth since 2008. The net result is that because household wealth is effectively an
emerging economies including China account for accumulation of past household savings. A
two-thirds of the real wealth gain since 2008, higher savings rate should eventually translate
or double the contribution of North America. into higher wealth. Figure 4 plots the growth
High-income Asia-Pacific has only a small role of wealth per adult against the savings rate,
in this changing scenario, handicapped by a both averaged over the period 2000–19. It
laggard Japan. The rest of the world (including confirms a strong positive relationship between
most of Africa and Latin America) hardly regis- wealth growth and savings, even when China
ters at all in the post-crisis era: their combined is excluded as an outlier. Overall, a percentage
contribution simply offsets the negative impact point rise in the savings rate raises the growth
of Europe. Thus the global financial crisis marks rate of wealth per adult by 0.13% each year on
a turning point in the history of wealth creation – average. Thus, for example, household wealth
the year in which the influence of the “old world” in Poland (with an 18% savings rate) would be
wanes and the “new world” takes over as the expected to be 27% higher in mid-2019 if it had
engine of global advancement. A new regime is matched the savings rate of Sweden (28%).
now in place and looks set to continue.
The drivers of wealth growth
There are many factors that help explain why
wealth per adult follows a different path in different The global financial
countries. Increasing population size is one potential
explanation for lower growth on the grounds that crisis marks a turning
total household wealth is shared among a larger
number of adults. However, this is offset by the point in the history of
economic opportunities offered by a growing popu-
lation and by the way that population growth under- wealth creation
pins the rising price of scarce resources, especially
land and housing. Overall, there is no evidence that
population growth systematically affects average
wealth in either direction.
Figure 4: Impact of savings rate on wealth per adult, 2000–19, selected countries
11
10 China
9
8
India
Russia
Average growth 7
rate (%) of
wealth per adult, 6
real LCU South Africa
5
Sweden
4 Poland South Korea
United States Turkey Singapore
3 Australia
Brazil Chile France
United Kingdom Spain
2 Canada Germany Switzerland
Vietnam Saudi Arabia
1 Indonesia
Italy Mexico Japan
0
0 5 10 15 20 25 30 35 40 45 50
Average saving rate
Source: James Davies, Rodrigo Lluberas and Anthony Shorrocks, Global wealth databook 2019
20The factor that accounts most for the different The ratio of wealth to GDP
trends in household wealth among countries
is the general level of economic activity as The level and growth of GDP, together with short-
represented by aggregate income, aggregate term fluctuations due to changes in the price of
consumption or GDP. The reasons are clear assets (especially equities and houses), explains
– economic expansion increases savings and much of the variation in the level and trend of
investment by households and businesses, and household wealth across countries. However,
raises the value of household-owned assets, another important consideration is the systematic
both financial and non-financial. Wealth and way in which the wealth/GDP ratio tends to rise
GDP do not always move in tandem, especially during the course of development. For a low-
when asset prices fluctuate markedly as they did income country with uncertain property rights,
during the financial crisis. Nevertheless, there is poor infrastructure, weak institutions and a rudi-
a strong correlation between wealth growth and mentary financial sector, the wealth/GDP ratio
GDP growth. could be around one, as Figure 6 records for the
“other countries” group. As development pro-
Figure 5 illustrates the relationship for the 29 gresses and the various constraints are removed
countries for which we have independent esti- or relaxed, confidence grows in wealth ownership,
mates of the level of household wealth. There asset management, and perhaps debt acquisition
is a clear positive growth correlation between for investment purposes. This allows the wealth/
wealth per adult and GDP per adult, even GDP to double or perhaps treble in the right
excluding China and India whose experience circumstances. The prospects for further rises in
does most to confirm the link. Average wealth the wealth/GDP ratio depends on the existence
in Sweden has grown faster than GDP growth of a secure legal infrastructure and a developed
would predict, while Israel and Indonesia have financial sector offering advanced credit facilities,
grown more slowly than expected. But the overall as is now commonplace among richer nations.
pattern suggests that GDP is the starting point
for explaining variations in the level and growth of The implications for wealth growth in individual
wealth per adult across countries. In fact, the link countries is clear. Broadly speaking, wealth can
between GDP and household wealth is the central be expected to rise in line with GDP. But those
component of the model we use to estimate the countries that address institutional deficiencies,
wealth level of countries lacking direct data. and which encourage the development of
appropriate financial instruments, can achieve
higher-than-average growth rates via a rise in the
Figure 5: Growth of wealth vs. GDP growth, 2000–19, selected countries
11
10 China
9
8 India
7
Annual growth 6
rate (%) of
wealth per adult, 5 Czech Republic
real LCU Sweden
4
3
2
Uruguay Indonesia
1
0 Israel
Greece
-1
-1 0 1 2 3 4 5 6 7 8
Annual growth rate (%) of GDP per adult, real LCU
Source: James Davies, Rodrigo Lluberas and Anthony Shorrocks, Global wealth databook 2019
Global wealth report 2019 21wealth/GDP ratio. Figure 6 suggests that other therefore, that instances of wealth growth at a
emerging markets are having some success in faster rate than GDP reflect asset price inflation.
this respect. The “other countries” group shows This in turn leads to a concern that asset price
similar progress. But it is China that has im- bubbles could be developing.
proved the most, raising its wealth/GDP ratio
this century from a starting value of three to a Figures 6 and 7 suggest that the benchmark
level which now exceeds that in High-income level for the wealth/GDP ratio in fully devel-
Asia-Pacific and Europe, and is comparable to oped economies is about four in normal times.
that in North America. Elsewhere, the profiles for Germany and Sweden remain below this level,
High-income Asia-Pacific and Europe show less probably reflecting generous state provision
of an upward trend since 2000, suggesting that of pensions and healthcare, which reduces
the opportunities for raising wealth growth above the incentive for individuals to save for their
GDP growth are largely exhausted. retirement needs. But Figure 7 shows that an
increasing number of countries have not only
achieved the benchmark, but have continued
well beyond. The ratio rose to six in Spain in
2010, providing a forewarning, perhaps, of un-
sustainable trends that Spain has had to tackle
during the last decade. The United States,
This in turn leads to France, the United Kingdom, Australia,
Switzerland and Italy have also seen the
a concern that asset wealth/GDP ratio rise to five or more. Such
levels may become more common in the future if
price bubbles could interest rates remain low. But historical evidence
suggests that economies with unusually high
be developing wealth/GDP ratios underpinned by high asset
prices can be vulnerable when economic
downturns occur.
While the wealth/GDP ratio is expected to rise
with GDP as countries develop, Figure 6 hints
that the ratio may have risen over the past two
decades for other reasons. One obvious can-
didate is widespread inflation-rate targeting Figure 6: Ratio of wealth to GDP by country type, various years
by central banks, which has reduced inflation
expectations and real interest rates. Quantitative 6
easing has reinforced this shift. The conse-
quences are evident in the rising price of assets 5
– especially real estate and equities – which
has become a common feature of economies 4
in all regions of the world, but especially North
America and Europe. The higher wealth/GDP 3
ratio in North America in recent years is a case
2
in point. While the higher values may indicate an
improved wealth creation environment, it more
1
likely reflects the consequences of asset price
inflation fueled by low interest rates. These
0
factors are likely to reverse at some future date. Other Emerging China Europe High-income North World
countries markets Asia-Pacific America
Figure 7 casts some light on this issue by
plotting the evolution of the wealth/GDP ratio 2000 2005 2010 2015 2019
for a subset of countries for which the ratio
has exceeded three at some point in time. The
evidence suggests that the wealth/GDP ratio Source: James Davies, Rodrigo Lluberas and Anthony Shorrocks,
tends to rise with average wealth as expected for Global wealth databook 2019
the reasons discussed above. Vietnam, India and
China show this kind of progression. But the rise
in the ratio among high-wealth countries is less
expected after they are already mature, so that
opportunities for institutional and financial sector
improvements are limited. It seems more likely,
22Figure 7: Wealth/GDP ratio, selected years and countries
8
7
6
5
4
3
2
1
0
Singapore
India
Germany
Vietnam
Italy
France
Australia
Canada
Korea
United States
United Kingdom
Japan
Switzerland
China
Sweden
Spain
2000 2005 2010 2015 2019
Source: James Davies, Rodrigo Lluberas and Anthony Shorrocks, Global wealth databook 2019
Summary evidence suggests that a wealth/GDP ratio
of around four is the normal safe upper limit.
This chapter set out to document the wealth Higher ratios may be commonplace in the
growth record of different countries this century future as financial instruments become more
and to delve into the reasons why countries have refined. But, at present, they may well reflect
grown at different rates. Previous Global wealth high asset valuations – especially house prices
reports have measured household wealth in and equity prices – which are unsustainable in
nominal USD, but country performance is best the longer run. Unfortunately, reliable wealth
evaluated in terms of real domestic currency data is unavailable for most countries. This
units. Figure 2 shows that the choice of currency limits the insights that could otherwise be
unit can make quite a difference to the values drawn from wealth data in order to assess the
recorded for wealth growth. It can also change degree of past success in addressing defective
our perspective on the relative contribution of institutions and inadequate financial markets to
countries to global trends. Simply shifting from identify unsustainable asset-price rises, and to
nominal USD as used in the past to real USD as understand the contribution of wealth to future
used in Figure 3 highlights the seismic change economic growth.
that occurred at the time of the financial crisis,
when China and other emerging market econo-
mies took over as the principal engine of global Notes on country groupings
wealth creation.
Emerging Markets refer to China plus Argentina,
The starting point for assessing wealth perfor- Brazil, Chile, Colombia, Czech Republic, Egypt,
mance across countries is the growth of wealth Greece, Hungary, India, Indonesia, Korea,
compared to GDP. The baseline is growth at a Malaysia, Mexico, Pakistan, Peru, Philippines,
similar rate. Wealth can grow faster than GDP Poland, Qatar, Russia, Saudi Arabia, South Africa,
if institutional and financial sector deficiencies Taiwan (Chinese Taipei), Thailand, Turkey and
are addressed. This is the optimistic outcome United Arab Emirates. To avoid double count-
of economic development and can result in a ing, countries in this list are excluded from
virtuous cycle in which higher wealth stimu- the “Europe” and “High-Income Asia-Pacific”
lates GDP growth, which in turn raises wealth. categories.
China, India and Vietnam provide examples of
virtuous cycles in action. However, historical
Global wealth report 2019 23You can also read