KIEL WORKING PAPER - Sebastian Horn, Carmen Reinhart and Christoph Trebesch - Kiel Institute for the World Economy
←
→
Page content transcription
If your browser does not render page correctly, please read the page content below

KIEL
WORKING
PAPER
China’s Overseas
Lending

                                                         No. 2132 June 2019
Sebastian Horn, Carmen Reinhart and Christoph Trebesch

Kiel Institute for the World Economy
ISSN 1862–1155
KIEL WORKING PAPER                              NO. 2132| JUNE 2019

    ABSTRACT
    CHINA’S OVERSEAS LENDING
    Sebastian Horn, Carmen Reinhart and Christoph Trebesch

                                               This draft: July 3, 20191
    Compared with China’s dominance in world trade, its expanding role in global finance is poorly
    documented and understood. Over the past decades, China has exported record amounts of capital to
    the rest of the world. Many of these financial flows are not reported to the IMF, the BIS or the World
    Bank. “Hidden debts” to China are especially significant for about three dozen developing countries,
    and distort the risk assessment in both policy surveillance and the market pricing of sovereign debt.
    We establish the size, destination, and characteristics of China’s overseas lending. We identify three
    key distinguishing features. First, almost all of China’s lending and investment abroad is official. As a
    result, the standard “push” and “pull” drivers of private cross-border flows do not play the same role
    in this case. Second, the documentation of China’s capital exports is (at best) opaque. China does not
    report on its official lending and there is no comprehensive standardized data on Chinese overseas
    debt stocks and flows. Third, the type of flows is tailored by recipient. Advanced and higher middle-
    income countries tend to receive portfolio debt flows, via sovereign bond purchases of the People’s
    Bank of China. Lower income developing economies mostly receive direct loans from China’s state-
    owned banks, often at market rates and backed by collateral such as oil. Our new dataset covers a
    total of 1,974 Chinese loans and 2,947 Chinese grants to 152 countries from 1949 to 2017. We find
    that about one half of China’s overseas loans to the developing world are “hidden”.
    Keywords: China, international capital flows, official finance, hidden debts, sovereign risk,
    Belt and Road initiative
    JEL classification: F21, F34, F42, F65, G15, H63, N25

    Sebastian Horn                              Carmen M. Reinhart                          Christoph Trebesch
    LMU München                                 Harvard Kennedy School,                     Kiel Institute for the World Economy
    Schackstr. 4                                79 JFK Street,                              Kiellinie 66
    80539 München                               Cambridge, MA 02138                         D-24105 Kiel, Germany
    Email: sebastian.horn@econ.lmu.de           Email: carmen_reinhart@harvard.edu          Email: christoph.trebesch@ifw-kiel.de
    www.sfm.econ.uni-muenchen.de                www.hks.harvard.edu                         www.ifw-kiel.de

    The responsibility for the contents of this publication rests with the author, not the Institute. Since working papers are of a
    preliminary nature, it may be useful to contact the author of a particular issue about results or caveats before referring to, or
    quoting, a paper. Any comments should be sent directly to the author.

    1
     We thank Max Tchirikov, Mattis Bös and Martin Wiegand for excellent research assistance as well as the German Research
    Foundation (DFG) for financial support (SPP 1859). We also thank Vincent Reinhart, Robert Subbaraman, and seminar
    participants at Harvard Kennedy School for helpful comments.
    Contact: sebastian.horn@econ.lmu.de; carmen_reinhart@harvard.edu; christoph.trebesch@ifw-kiel.de.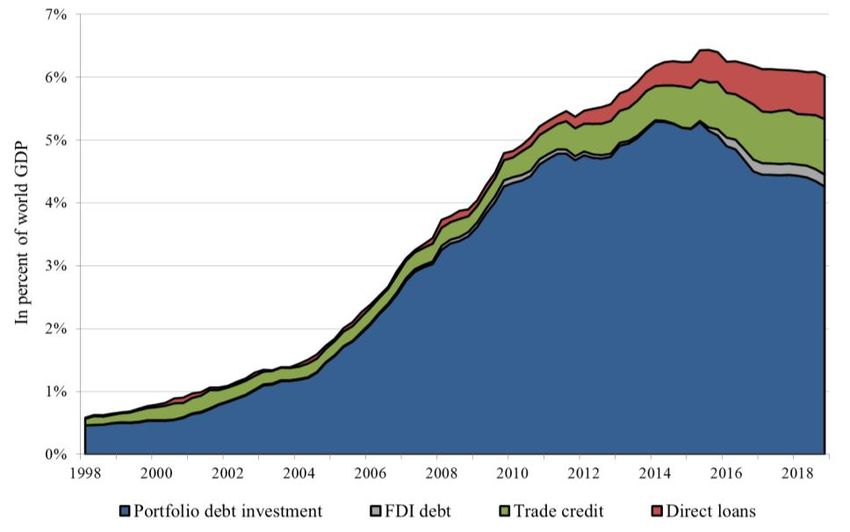
1. Introduction

In this paper we document the surge in China’s capital exports to the rest of the world during the
past decades. While China’s dominant footprint in world trade is well known, its expanding role in
global finance is poorly documented and understood. This paper helps fill this void by establishing
the size, destination, and characteristics of China’s global capital flows.

Unlike other major economies, almost all of China’s overseas lending and investment is official,
meaning that it is undertaken by the Chinese government, state-owned companies or the state-
controlled central bank. Most notable is the fact that the documentation of China’s capital exports
is (at best) opaque. China does not report on its official lending and there is no comprehensive
standardized data on Chinese overseas debt stocks and flows. Documentation of China’s overseas
lending literally falls through the cracks. Credit rating agencies, like Moody’s and Standard and
Poor’s, monitor sovereign borrowing from private creditors (banks, bondholders, or others); official
lending to sovereigns is off their radar screen. The Paris Club tracks sovereign borrowing from
official bilateral creditors (i.e., other sovereigns), which in principle, should cover most of China’s
overseas lending. However, China is not a member of the Paris Club and therefore has not been
subject to the standard disclosure requirements.

Adding to the data scarcity, commercial providers such as Bloomberg or Dealogic do not keep
track of China’s official overseas loans, and such lending is missed even by the most ambitious
recent attempts to measure international capital flows (e.g. Avdjiev et al. 2017, Coppola et al.
2019). The People’s Bank of China (PBoC) does not publish its sovereign bond purchases or the
composition of its portfolio. Similarly, China does not provide details on its “Belt and Road”
initiative and its direct lending activities. Apart from the aforementioned omissions in reporting to
the Paris Club, China does not divulge data on its official flows with the OECD’s Creditor
Reporting System, and it is not part of the OECD Export Credit Group, which provides data on
long- and short-term trade credit flows. With regard to cross-border banking, China recently joined
the list of countries reporting to the Bank for International Settlements (BIS), but the data are not
made available on a bilateral basis and the coverage is incomplete, as we will discuss below. Taken
together, these data limitations make it very challenging to do rigorous empirical work on China’s
official capital exports.

Apart from the lapses in reporting, the entry of China in the international financial system about
two decades ago has created a major gap in the academic literature. There is almost no research on
the consequences of China’s global “finance shock”, while the China “trade shock” has been
studied extensively (Autor et al. 2013).2 Most international macroeconomists continue to focus on
the role of the United States and the capital markets of London and New York, which have

2
    For a survey on the large and growing literature on the Chinese trade shock see Autor et al. (2016).

                                                         1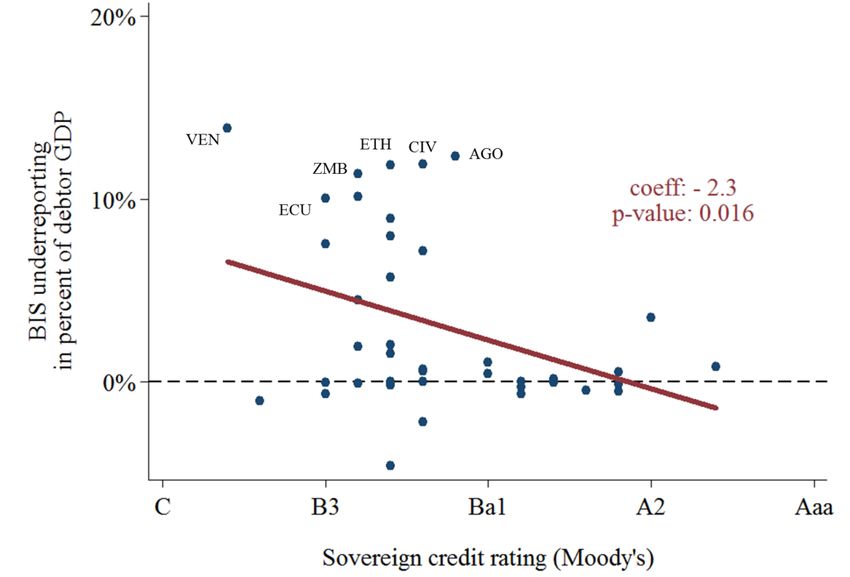
dominated for the past two centuries. The literature on a “global financial cycle”, for example,
focuses almost exclusively on the spillovers from the United States, proxied with variables such as
US interest rates or the VIX - the volatility of US stock markets (Obstfeld 2015, Rey 2015,
Miranda-Aggripino and Rey 2015, Jordá et al. 2018). Few, if any papers, study similar financial
spillovers from China. Also the broader literature on international capital flows or on “global
liquidity” typically centers on US financial conditions and a related set of well-known “push” and
“pull” factors (Calvo et al. 1993, Forbes and Warnock 2012, Fratzscher 2012, Bruno and Shin
2014).3

As we document in this paper, this approach is not well suited to characterize China’s massive
official capital outflows. Instead, we find that variables linked to Chinese domestic activity and
commodity prices do best in explaining the time-variation in China’s government-led investments
abroad. It is not surprising that China’s official flows do not necessarily mirror the incentives of
private agents searching for yield, in the same way that it would be wildly inappropriate to assert
that the post-WWII Marshall Plan was driven by the search for yield. As might be expected,
official lending is likely to be shaped by the geopolitical objectives of the Chinese government.
This is in line with historical precedent. As we show in Horn et al. (forthcoming), rising economic
powers have recurrently used state-driven lending to tap into new markets abroad, to secure
commodity imports, and to further their global ambitions. These are factors usually excluded from
the empirical literature on capital flow drivers.

Another obstacle to understanding China’s role in international finance today is a “silo problem” in
the literature, as the various strands of relevant research have remained largely disconnected. One
branch of research has studied central bank reserve accumulation and “uphill” capital flows from
emerging markets to advanced countries (e.g. Song et al. 2011, Alfaro et al. 2014, Gourinchas and
Jeanne 2013). In that work, China features prominently as a buyer of advanced country bonds, but
this particular type of capital exports is not studied in tandem with China’s other forms of investing
overseas. Other papers have explored Chinese FDI and equity investments in advanced countries
(e.g. Fuest et al. 2019), or China’s capital flows to developing countries, in particular via aid, grants
and loans (see e.g. Dreher and Fuchs 2016, Dreher et al. 2018).4 Yet another strand of work
analyzes the global role of China’s currency in the international monetary system, but without
studying the associated capital flows in detail (Prasad 2016, Farhi and Maggiori 2019, Ilzetzki et al.
2019). While these studies shed light on components of the Chinese official capital outflow surge,
they miss an encompassing picture of China’s international capital exports, ranging from portfolio
investment, asset purchases, cross-border bank lending, and trade credits, to official lending
between governments and between central banks.

3
  See also the literature on global imbalances, which focuses, front and center, on the dominant role of the
United States (Caballero et al. 2008, Mendoza et al. 2009, Gourinchas and Rey 2014).
4
  There is also some research on the growth spillovers from China to other emerging markets, but this work
abstracts from financial spillovers, or broader issues relevant for the international financial architecture.

                                                       2
Here, we take a first step toward quantifying and understanding China’s global capital exports,
including its opaque overseas lending to developing countries that remains largely unexplored. To
motivate our analysis on China’s overseas lending, Figure 1 uses aggregate data from China’s
balance of payments (BoP) statistics. China’s direct loans and trade credits have climbed from
almost zero in 1998 to more than 1.6 trillion USD, or close to 2 percent of world GDP in 2018.5
These loans mostly go to low- and middle-income countries. In total, estimates suggest that the
Chinese state now accounts for a quarter of total bank lending to emerging markets.6 This has
transformed China into the largest official creditor, easily surpassing the IMF or the World Bank.
Beyond that, however, little is known. Among our tasks is to identify these borrowers.

                                Figure 1. China’s Overseas Lending Boom

          Note: This figure shows a subset of outstanding Chinese overseas debt claims as reported in
          China’s BoP Statistics, scaled by global GDP. Trade credit includes short- and long-term
          trade credits and advances. FDI debt claims arise in case of inter-company lending across
          borders (see Footnote 5). Portfolio debt is excluded (see Figure 2). Source: PBoC and IMF.

In light of the acute data shortcomings, our first step is to compile a new “consensus” database of
Chinese loans to the rest of the world and construct corresponding debt flow and stock estimates.
Our new dataset covers a total of 1,974 Chinese loans and 2,947 Chinese grants to 152 emerging or
developing countries from 1949 to 2017. “Consensus” refers to the approach adopted, which
attempts to reconcile what multiple sources record about the same bilateral lending transaction.7

5
  The numbers include debt claims from China’s FDI - a channel of Chinese overseas debt that has received
little attention. FDI debt claims arise, if there is inter-company lending between a foreign direct investor and
a non-resident entity, over which the foreign direct investor has significant control.
6
  This number includes flows via offshore financial centers (Cerutti et al. 2018).
7
  This approach has well-established antecedents in the capital flow literature. Studies on the measurement of
capital flight via trade mis-invoicing (see Chang et al. 1997, for instance) also attempted to reconcile multiple

                                                       3
Our newly assembled database of Chinese lending abroad spans more than six decades from 1949,
when the People’s Republic was established, until 2017. The data is granular and was gathered
from a variety of sources (the consensus approach as described), including international treaties,
debt contracts, policy reports, as well as the work of academics such as the AidData team at
William and Mary (Dreher et al. 2017). Overall, we combined details on more than 1,947 loans as
well as 2,947 grants extended by the Chinese government and state-owned creditor agencies since
1949, to more than 150 countries worldwide, with total commitments of 530 billion US$.
Whenever possible, we also gathered loan-level information on the interest rates, currency
denomination, and the repayment terms of Chinese lending and check what part of the debt is
publicly reported and how much is “hidden”, in the sense that it is not picked up by official
statistics of the IMF, World Bank or BIS.

We find that the People’s Republic has always been an active international lender, even in the
1950s and 1960s, when it lent substantial amounts to Communist brother states. That is, official
Chinese lending has always had a strategic element. What has made China such a dominant global
creditor in the recent 20 years is the drastic increase of China’s GDP, combined with China’s
“Going Global Strategy” to foster Chinese investment abroad, which was initiated in 1999.

Chinese loans have helped to finance large-scale investments in infrastructure, energy and mining
in more than 100 developing and emerging market countries, with potentially large positive effects
for growth and prosperity. At the same time, however, the large lending flows resulted in the build-
up of high debt servicing burdens. For the 50 main recipients of Chinese direct lending, the average
stock of debt owed to China has increased from less than 1% of GDP in 2005 to more than 15% of
debtor country GDP in 2017, at least according to our lower bound estimates. For these countries,
debt to China now accounts for more than 40% of total external debt, on average.

More importantly, using unpublished data from the World Banks’s Debtor Reporting System and
data on BIS reported bank claims, we find that about 50% of China’s lending is “hidden”. Neither
the IMF, nor the World Bank, nor credit rating agencies report on these “hidden” debt stocks,
which have grown to more than 200 billion USD as of 2016. The problem of “hidden” Chinese
debts is particularly severe in crisis countries such as Venezuela, Zimbabwe, and Iran. Indeed,
China does not report any bank claims towards these countries to the BIS, despite substantial
known lending flows over the past 15 years. These findings have important implications for debt
sustainability in recipient countries, also because China’s state-driven lending abroad differs
strongly from other official lenders such as the World Bank or OECD governments.

data sources. The typical exercise compared what a country recorded as exports (imports) versus what its
trading partners posted on their books. For example, if a country reported a level of exports that were lower
than the level of imports its trading partners recorded (export under-invoicing), it was interpreted as a proxy
for capital flight (export proceeds that were left abroad). A similar logic applied to import over-invoicing.

                                                       4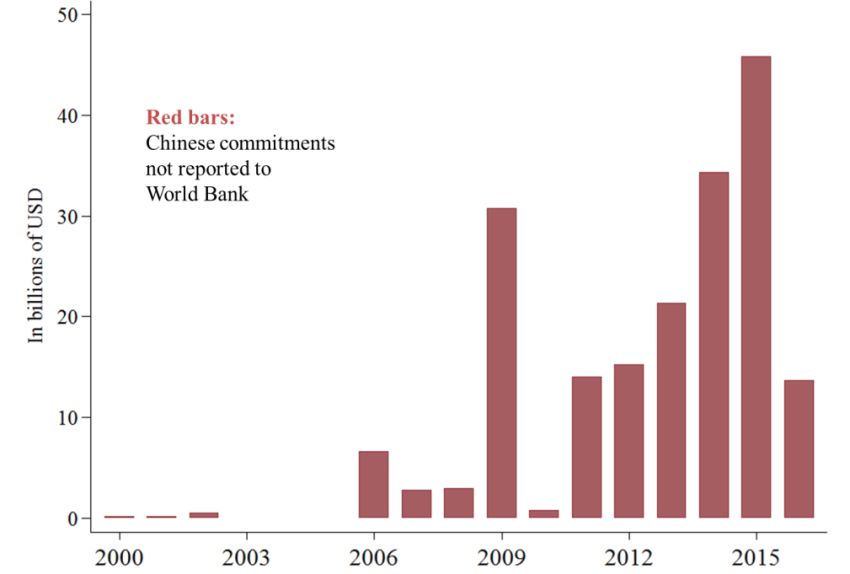
Over the past decades, official creditors have typically lent to developing countries at
concessionary terms with long maturities and at below-market interest rates. China, instead, often
lends at market terms (with risk premia), shorter maturities, and partly with collateral clauses that
secure repayment through commodity export proceeds, in particular from oil. The latter establishes
China’s comparatively high level of seniority among other international creditors (see Schlegl et al.
2019). These practices have a historical analogue. Indeed, China’s overseas loans share many
features with French, German and British 19th century foreign lending, which also tended to be
market based, partially collateralized by commodity income, and characterized by a close link of
political and commercial interests (Feis 1930, Borchardt 1951).

With a view to financial stability, another relevant historical analogue is the lending boom of the
1970s, when resource-rich, low-income countries received large amounts of syndicated bank loans
while commodity prices boomed. The Chinese lending flows during 2008 to 2015 share similarities
with the 1970s lending cycle, which did not end happily once commodity prices, export revenues,
and economic growth slumped across many of the countries that had gone on a borrowing spree.
After 1982, dozens of sovereigns went into default, resulting in a “lost decade” in Latin America
and elsewhere. The sharp increase in the incidence of sovereign debt restructurings of Chinese debt
since 2011 suggests a new wave of debt overhangs. We show that debt sustainability concerns are
largest in developing countries that have received the most Chinese loans, several of which have
benefitted from the HIPC debt relief initiative. Debt levels and the debt service burdens in two
dozen developing countries are much higher than previously thought.

In constructing an encompassing view of China’s lending to the rest of the world, it becomes
evident that China tailors its overseas lending by recipient. Rather than direct loans, advanced and
higher middle-income countries receive portfolio investments, via sovereign bond purchases of the
People’s Bank of China (PBoC). As a result, many advanced countries have become highly
indebted towards the Chinese government. Most famously, China’s purchases of US Treasury
securities (and other US fixed income assets) soared since the early 2000s and reached a peak in
2011 at 1.6 trillion USD or 10 percent of US GDP. The US Treasury’s data on foreign purchases of
US assets facilitates tracking that type of bilateral lending. However, in the past decade the PBoC
has also escalated its purchases of other countries’ sovereign bonds, and these asset purchases, as
we discuss, are more challenging to track. Other types of state-driven finance, in particular
officially guaranteed trade credits as well as equity and FDI flows to advanced countries have also
strongly grown. Furthermore, China has built a global network of central bank swap lines, meaning
standing lines of credit with the PBoC and foreign central banks, including most advanced
economies. The total sum of these official swap line drawing rights exceeds 500 billion USD.

Figure 2 shows that, as of 2018, the government of China holds more than five trillion USD of debt
towards the rest of the world (6% of world GDP), up from less than 500 billion in the early 2000s
(1% of world GDP). The main difference to Figure 1 is that we now add portfolio debt holdings
(blue area) and combine these with the direct loans and trade credits shown before. If we also add
                                                 5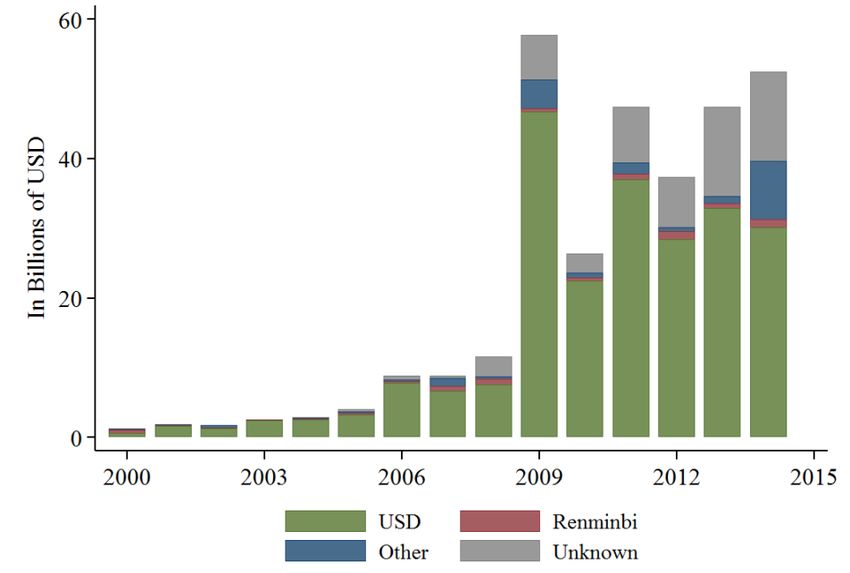
foreign equity and direct investments (not shown), China’s total financial claims abroad amount to
more than 8% of world GDP in 2017. This dramatic increase in Chinese official lending and
investment is almost unprecedented in peacetime history, being only comparable to the rise of US
lending in the wake of WWI and WWII (Horn et al. forthcoming). Indeed, the rapid growth of
claims have transformed the Chinese government into the world’s largest official creditor (the
largest overall creditor remains the United States). Despite these developments, however, we know
strikingly little about China’s capital exports and their global implications.

                        Figure 2. Total Chinese debt claims on the rest of the world

    Note: This figure shows China’s cumulative balance of payments position for selected asset
    categories, scaled by global GDP. Portfolio debt investment summarizes claims on non-residents from
    PBoC holdings of debt instruments (reserve assets) and from holdings of non-reserve asset portfolio
    debt. Portfolio debt are mostly sovereign bond purchases by the central bank. Trade credits include
    short- and long-term trade credits and advances. Source: People’s Bank of China and IMF WEO.

The remainder of the paper is structured as follows. Section 2 introduces our new “consensus”
database; we highlight the key stylized facts on Chinese lending to developing countries that
emerge. Section 3 focuses on country exposure to Chinese loans and the related problem of
underreporting and estimates the size of “hidden” debts to China. The features of the borrowers are
discussed. Section 4 reassesses debt burdens and debt dynamics from the perspective of recipient
countries and explores the consequences for debt sustainability and financial stability; we discuss
the implications for potential mispricing of risk. Section 5 focuses on China’s lending to advanced
countries, in particular the scale of portfolio holdings of advanced country sovereign bonds by the
Chinese central bank. Finally, Section 6 combines the different “types” of capital flows and
indebtedness into an encompassing panoramic view of China’s financial role in the global
economy. We explore the unique characteristics of China’s tailored approach of investing and
lending across the globe. We also show simple regressions on the drivers of Chinas capital flows in
Section 7. The last section concludes.
                                                   6
2. Chinese direct lending to the developing world: a new database and stylized facts
2.1. Why China’s overseas lending is opaque
A main challenge to explore China’s large-scale official lending boom is its opacity. Unlike the
United States, the Chinese government does not release data on its lending activities abroad or
those of its government entities. Moreover, China is not a member of the most important creditor
organizations that provide data on official lending and restructurings, in particular the Paris Club of
creditor governments but also the OECD. No data is therefore available from the creditor side.
On the debtor side, the data coverage on Chinese lending is highly incomplete as well. One reason
is the way in which the Chinese government lends abroad. The credits are rarely borrowed
bilaterally, i.e. government-to-government. Instead, almost all of China’s overseas lending is
extended via Chinese state-owned entities and the recipients also tend to be state-owned
enterprises. This type of company-to-company lending is often not collected by the statistical
offices of developing countries so that international debt statistics suffer from chronic
underreporting. According to the IMF, fewer than one in ten low-income countries report debts of
public corporations that are outside the general government (IMF 2018). As a result, the debtor
countries themselves have an incomplete picture on how much they have borrowed from China and
under which conditions.
Figure 3. Why we lack data on China’s overseas lending
7Also the private financial industry does not monitor China’s state-driven cross-border lending
flows. Rating agencies such as S&P or Moody’s track debt and credit events (defaults) on private-
to-private or private-to-official flows, but they miss official lending, such as the loans by state-
owned Chinese policy banks. For similar reasons, major data providers such as Bloomberg or
Dealogic have failed to identify the international Chinese lending boom. They carefully track
publicly traded debt instruments such as sovereign bonds or private syndicated loans, but miss
China’s official loans, which are not priced in international markets.
The data provided by the BIS locational banking statistics do not help either. China started to report
to the BIS in 2015, but the government has not agreed to publicly release the bilateral (country-by-
country) claims data, as many other BIS reporting countries do. Only aggregate Chinese claims are
available, and only back to 2015. Nevertheless, in Section 3.2., we describe a way to infer the size
of Chinese claims from BIS data as of end-2015. The evidence suggests that China only reports
parts of its overseas claims to the BIS, with large reporting gaps particularly in high-risk countries.
One potential explanation for the incomplete reporting to the BIS is that China uses a “circular”
lending strategy that minimizes the risk of default on its loans. For risky debtors, China’s state-
owned policy banks often choose not to transfer any money to accounts controlled by the recipient
government. Instead, the loans are disbursed directly to the Chinese contractor firm that
implements the construction project abroad – a closed circle.8 The loans thus remain within the
Chinese financial system, making it harder for recipient countries to misuse the money. Because
this type of overseas loan is not actually transferred abroad, there is nothing to report to the BIS,
which could explain part of China’s large reporting gaps.
Figure 3 summarizes why we know so little about China’s overseas lending. The knowledge gap is
a major problem for debt management, surveillance work and asset pricing alike. Debt
sustainability analyses are challenging, to say the least, if large parts of a country’s debt and debt
service burden remain excluded from the official aggregates. The same is true for the IMF’s
surveillance work. From the perspective of private investors, the opacity makes risk pricing
difficult. If a substantial portion of total external debts of a country is unknown, it is almost
impossible to price sovereign bonds and the associated default risk properly. Finally, opacity is a
problem when it comes to crisis resolution. In case of a default, the stock and composition of a
country’s debt is crucial information to assure fair burden sharing and an orderly process to manage
and exit the crisis.
In the remainder of this section we address the lack of transparency, by creating a new consensus
database of Chinese overseas lending and summarize its main characteristics.
8
Bräutigam (2009) calls this strategy the “Eximbank Cycle”.
82.2. Identifying Chinese lending: a database of flows and stocks
A key contribution of this paper is to create a new consensus database of Chinese overseas lending
(loans and grants) spanning seven decades (1949-2017) that builds on a broad range of existing
data sources, historical archives and the existing literature. We then use the loan-level data to
compute debt stock and debt servicing profiles for each country, focusing on the period 2000-2017.
Data sources and merging approach: Appendix I describes our approach and the sources in detail.
For the modern period, our main source is AidData’s Chinese Official Finance database (Dreher et
al. 2017), which encompasses more than 1,200 loans and 2,300 grants to 140 recipient countries
during 2000-2014 and was coded from hundreds of primary sources. We complement and cross-
check this rich source with various region- and sector-specific databases that have excellent
coverage for subsets of China’s foreign lending and which allow us to extend our dataset until
2017. These sources are summarized in Table 1 below and in Appendix I. To go further back in
time, we collected a large number of historical sources, most importantly a set of recently
declassified CIA reports that contain rich transaction-level details on China’s international grants
and loans in the post-WWII era. We cross-check and complement the information from this source
with multiple other archival documents and sources on Chinese lending going back to 1949, when
the People’s Republic was founded.
Table 1. Data sources on Chinese foreign lending, 1950 - 2018
Total
Institution Dataset / source Geographic coverage Time coverage Type commitment
AidData at China's Official Finance Database Global 2000 - 2014 Loans and grants 279 bn
William & Mary China's Public Diplomacy Dataset East Asia & Oceania 2000 - 2016 Loans and grants 38 bn
Boston University GDPC China's Global Energy Finance Global 2000 - 2018 Energy finance 250 bn
Inter-American Dialogue China - LA Finance Database Latin America 2005 - 2018 Loans 141 bn
John Hopkins CARI Chinese Loans to Africa Africa 2000 - 2017 Loans 144 bn
Lowy Institute Chinese Aid in the Pacific Pacific Islands 2002 - 2018 Loans and grants 6 bn
US Export Import Bank Competitiveness Reports Global 2013 - 2017 Export credits 50 bn
CIA Reports on Communist Aid Global 1950 - 1983 Loans and grants 5.9 bn
Bartke (1989) Chinese Aid Projects Global 1950 - 1988 Aid projects n.a.
Lin (1993) Forein Aid of the PRC Global 1950 - 1992 Loans and grants n.a.
Copper (2016) China's Foreign Aid & Investment Global 1950 - 2015 Country case studies n.a.
Our merged database Horn, Reinhart, Trebesch (2019) Global 1950 - 2017 Loans and grants 530 bn
Note: This table summarizes the main existing data sources on Chinese overseas lending for the modern, post-2000
period. A complete list of sources and the respective references are provided in the appendix. Commitments are
expressed in current USD.
To generate a consensus database, we compare each loan or grant across all sources in case of
overlaps, filter out duplicates, identify missing data points and, in case of conflicting information,
consult additional primary sources. Our final, unified dataset covers 1974 loans and 2947 grants by
9different Chinese official and state-owned creditors to more than 150 countries and spans the entire
history of the People’s Republic from 1949 to 2017, with total recorded commitments amounting to
530 billion USD.
From flows to stocks: To transform the flow data into stocks we computed estimated repayment
histories for each loan and then aggregate these on a country-year level. This procedure requires
reliable data on the repayment terms of the loans which is best available for the period 2000-2017.
For about one third of all loans in this period, we know all necessary details from the existing
datasets. For an additional 45 percent of loans we can approximate the repayment terms by making
use of the fact that Chinese lending practices are highly standardized, i.e. largely predetermined by
who lends (creditor agency). We first created a typology of creditor-specific Chinese lending terms
by combining qualitative and quantitative information and cross-checking our results with existing
literature (see Appendix I for details). In a nutshell, Chinese foreign loans fall into three broad
categories: (i) interest-free loans, (ii) other concessional loans by the China Export Import Bank
and (iii) commercial loans extended by a variety of state-owned banks and enterprises. Taken
together, this approach gives us detailed lending terms for around 75 percent of loans in our
database. For the remaining 25 percent, we make the conservative assumption that loans are
extended at concessional terms, thus under-estimating debt service to China. The product is a new
yearly database of debt stocks owed to China, and the resulting interest and amortization payments.
The dataset starts in 2000 and covers 106 recipient countries of Chinese direct lending that have
received Chinese loans of at least 1 percent of GDP (see Table 5 in Appendix I for the country list).
Comparison to aggregate figures: Our estimates on debt to China represent a conservative, lower
bound. We might overestimate debt figures in a few individual cases (see Appendix I), but for the
large majority of countries the true debt levels and debt service payments to China are likely to be
higher than our conservative estimates.9 This is because, despite our best efforts to gather loan-
level data from dozens of sources, we still capture only about 60 percent of total Chinese overseas
loans. In total, our estimates for 106 developing and emerging countries amount to 400 billion USD
to China at the end of 2017. This compares to 650 billion of outstanding loans reported in China’s
BoP statistics. Another piece of evidence is provided by Cerutti et al. (2018) who use confidential
data reported to the BIS to show that, at the end of 2018, Chinese bank claims towards emerging
market debtors reached 919 billion USD. This is more than twice the amount of 400 billion USD
we were able to trace down for developing and emerging markets at the end of 201710. They further
show that two thirds of total Chinese bank lending to EMEs is channeled through offshore financial
9
In Appendix I we discuss the caveats of our approach. Most importantly, we rely on loan-level data that is
based on commitments rather than actually disbursed loans. While we do our best to drop non-disbursed parts
of Chinese lending, it is possible that total debt stocks are lower than what we estimate in some countries,
because not all promised loans were paid out.
10
This gap might partly be explained by bank lending to Chinese corporations operating abroad, which we do
not aim to cover in our estimates.
10centers and foreign affiliates of Chinese banks. These offshore flows are often hardest to track, as
emphasized by Zucman (2013) or Coppola et al. (2019).
2.3. China’s overseas lending 1950-2017: overview and recipient countries
A first insight from our dataset is that the People’s Republic of China has been an active
international lender for much of its history. Figure 4 shows Chinese bilateral commitments in the
form of loans and grants as a share of Chinese GDP since 1949. During the 1950s and 1960s, China
extended sizeable bilateral loans and grants to selected communist allies, even though the country
was going through severe hardship and famines (Meng et al. 2015). Overseas lending was much
lower in the 1980s and 1990s, and starts rising again in the early 2000s in the wake of China’s
“going-out” policy. This coincides with China’s economic boom and its increasing share of world
GDP, which is illustrated with the black dotted line. Now that China represents more than 15
percent of global GDP on a purchasing power parity basis, the financial ramifications of its
overseas lending are larger than ever before.
Along with the much larger outflow amounts, the geographic scope of China’s lending has also
increased notably. The share of countries receiving Chinese official grants or loans has increased to
almost 80% as of 2017 (Figure 5). With almost full global coverage, US official lending is still
further-reaching than Chinese official finance, but the gap is narrowing fast.
Figure 4. China has always been an active international lender, 1949 - 2017
Note: This figure shows Chinese overseas lending from our database (Appendix I) scaled
by Chinese GDP (red bars, left axis) and the Chinese share of global GDP on a purchasing
power parity basis (dashed line, right bar). GDP data is from the Penn World Tables.
11Figure 5. China vs the US – global reach of direct lending
Note: This figure shows the share of developing and emerging countries that have received
Chinese or US official funds during the past five years. The data on US official lending is
from the USAID Greenbook.
Figure 6. Capital flows to Low-Income Developing Countries 1990 - 2017
Note: This figure shows gross overseas lending by China, the World Bank (IBRD and
IDA), the IMF and private creditors to low-income developing countries in percent of total
GDP of low income developing countries, using the country classification provided by the
IMF (World Economic Outlook 2018). All four series exclude loans to private borrowers.
Data on Chinese flows come from our database (Appendix I), data on private, IMF and
World Bank flows is from the World Bank’s WDI Database.
12The overseas lending boom has transformed China into one of the major official creditors
worldwide. The footprint of China is particularly large among low-income countries, where
Chinese lending flows have surpassed total capital flows from multilateral creditors such as the
IMF or the World Bank, as well as flows from private creditors (Figure 6). Figure A3 in the
Appendix shows a similar comparison of China versus other creditors, using outstanding debts.
The flipside of China’s large-scale lending flows is an increasing debt stock and growing annual
debt service obligations in many recipient countries. Figure 7 ranks countries that are most
indebted to China according to our estimates. The debt stock estimates include both loans to public
borrowers (public and publicly guaranteed debt) as well as to private borrowers in recipient
countries. As mentioned earlier, the large bulk of China’s state-driven lending goes to public
entities, while loans to private entities account for less than 10% of total (we drop private
borrowing in parts of our analysis below).
More than two dozen countries now owe more than 10% of their GDP to the Chinese government.
On average, for the top 50 recipients of Chinese direct loans, debt to China has increased to more
than 16% of GDP in 2017. Chinese official lending now also trumps that by other major official
creditor nations. Developing and emerging countries are now much more indebted to China than to
all other major creditor governments combined: According to our estimates, developing and
emerging market sovereigns owe 380 billion USD to China compared to 246 billion USD in debt
owed to the group of 22 Paris Club member governments (see also Appendix I.4).
The country group most exposed to China are low income developing countries (LIDCs), many of
whom are commodity exporters and some are former highly-indebted poor countries (HIPCs) who
benefitted from large-scale official debt relief in the 1990s and 2000s. This can be seen in Figure 8
(Panel A), which shows that the average LIDC indebtedness to China was 11% of GDP as of 2017.
In comparison, emerging market (EME) countries owed 6.5% of GDP in debt to China, on average,
using our sample and database. Another highly exposed group are oil-exporting countries, such as
Angola, Ecuador, Niger or Venezuela, as well as countries that are commonly associated with
China’s “Belt and Road” initiative (listed in World Bank 2018). For the BRI countries, the median
in our data is comparatively low (3.6% debt to GDP), while the average is more than twice as high
(8.8% debt to GDP). This reflects the fact that some BRI countries have already borrowed heavily
from China (pushing up the average), while others have only recently joined and are not as highly
indebted as of 2017, such as countries in Eastern Europe and the Middle East.
The regions most indebted to China are Far East Asia and Central Asia, including highly exposed,
small economies that are in geographic proximity to China such as Laos, Cambodia and the Kyrgyz
Republic (see Panel B of Figure 8). Next come Sub-Saharan Africa and Latin America, as well as
some parts of the MENA (Middle East and North Africa) region. The debt flows to Eastern Europe
are smaller, when measured as a share of debtor country GDP, but the amounts of credit to Europe
have been growing substantially over the past five years. Figure 9 shows a world map on the scale
13of indebtedness towards China, measured as a share of debtor country GDP. The map only includes
direct loans, but excludes portfolio debt, short-term trade credits or FDI and equity investments.
Figure 7. External debt to China (debt stock as share of GDP) – top 50 recipients
Note: This figure shows the stock of total external debt from direct loans owed to China as of 2017,
focusing on the 50 countries most indebted to China. Total debt includes loans to public borrowers
(PPG debt) as well as private borrowers (Chinese official loans to private entities abroad amount to less
than 10% of total). The estimates are based on our loan-level consensus database (see also Appendix I).
Chinese portfolio debt holdings and short-term trade debt are excluded from these estimates. GDP is
from the IMF’s WEO database.
14Figure 8. External debt to China by region and functional groups (as of 2017, share of GDP)
Panel A. Debt to China by country group
Panel B. Debt to China by region
Note: This figure shows average debt to China (blue dots), median debt to China (red squares) and the
inter-quartile range (the distance from the lower to the upper quartile of the debt distribution, grey
lines) for different country groups (Panel A) and regions (Panel B), each as a share of debtor country
GDP in 2017. Debt estimates are based on loan-level data (see text and Appendix I) and include loans
to public borrowers (PPG debt) as well as to private borrowers (Chinese loans to private entities
abroad are less than 10% of total). Chinese portfolio debt and short-term trade debt are excluded. GDP
and country classifications from IMF WEO, LIDCs stands for Low Income Developing Countries.
See Appendix I for the list of countries in our sample.
15Figure 9. World map of external debt to China (as of 2017, direct loans only)
Note: This figure shows the geographic distribution of total external debt owed to China through
direct loans by countries across the globe. The debt estimates are based on loan-level data and
measured as of 2017 in percent of debtor country GDP (see text and Appendix I). They exclude
Chinese portfolio debt holdings and short-term trade debt. GDP data is from the IMF’s WEO
Database.
2.4. China’s loans: are these official or commercial flows?
China’s overseas lending has unique characteristics when compared to the post-WWII lending of
other major economies. First and foremost, China’s capital outflows are almost exclusively official
lending and thus controlled by the Chinese government. The main creditors are state-owned banks,
plus a variety of state-owned enterprises. Privately-owned banks play a minor role.
At the same time, the terms and characteristics of China’s state-driven overseas loans look in many
ways more like commercial lending. Most of China’s overseas loans are denominated in US dollars
and lending is at interest rates that reflect a risk premia and contractual characteristics that resemble
private bank loans. In low income countries, China’s loans are generally repayable at interest rates
of 2 to 3 percent, in contrast to the interest-free loans and grants LIDCs usually receive from most
other bilateral and multilateral creditors. As to emerging markets and middle-income countries,
most loans are extended at market terms, meaning with interest rates that are comparable to those
prevailing in private bond or loan markets. For example, Ecuador in 2010 borrowed a 1.7 billion
USD from China Export-Import Bank at 7 percent interest over 15 years. Similarly, over a period
of 10 years, Angola borrowed a total of $20US billion from Chinese state banks at an average
interest rate of 6 percent and with maturities ranging from 12 to 17 years.
Moreover, the loans enjoy a comparatively high degree of seniority, since they are often backed by
collateral and because debt stocks and repayment flows are not public information. Most
importantly, the interest and principal repayments are often secured, either in the form of
commodities (e.g. export proceeds of raw materials and agricultural products) or by giving the
16creditor the right to attach the profits of state-owned enterprises. To our knowledge, no other
official lender collateralizes its international loans in this way, at least not this systematically.
The institutional and legal characteristics of China’s loans also have commercial rather than official
characteristics. The loans are extended by a variety of creditors, including more than a dozen public
banks and public enterprises that behave like private entities. In addition, the lending contracts
often look like commercial loans, with secrecy and arbitration clauses, so that repayment amounts,
or any default or restructuring details are kept outside of the public domain.
All of these features are highly unusual for official lending as extended by OECD governments and
Paris Club member countries during the post-WWII era. Around 70 percent of Paris Club claims on
low-income and emerging countries are in the form of Official Development Assistance as defined
by the OECD, i.e. are concessional in character and have a grant element of at least 25 percent. The
United States government, for example, typically extends funds for military and economic
cooperation in the form of grants rather than loans. The same is true for official creditors in Europe,
where the European Stability Mechanism, ESM, lent with maturities of up to 30 years and at almost
no risk premia (Corsetti et al. 2018).
In sum, China’s official lending overseas is not comparable to the lending activities by most other
creditor governments, in particular those organized in the OECD and Paris Club (see Kraay 2014 or
Horn et al. forthcoming).
To provide more details, Figure 10 shows a compact overview of the characteristics of China’s
overseas lending, based on all loans from our consensus database between 2000 and 2017, and
weighted by commitment amounts. More than half of total lending was extended at commercial
terms, compared to 15% at concessionary terms. These shares were rather stable over time, as
shown in Appendix I, which summarizes the lending terms in each year since 2000.
Two banks have dominated China’s overseas lending universe: the Chinese Export-Import Bank
and China Development Bank. Together, they account for more than 75% of all direct cross-border
lending between 2000 and 2017, while government entities such as the Ministry of Commerce play
only a subordinated role (see also Figure A5 in Appendix III showing the share of each creditor per
year).11 The two banks are both owned by and subordinated to the Chinese State council, as shown
in the overview chart in Appendix 2. Against this backdrop, it is evident that the Chinese
government could add transparency on much of its overseas lending activities by publishing
balance sheet and claims data from just these two banks.
Figure 10 also shows that most of China’s overseas loans are denominated in foreign currencies.
Around 85 percent of loans in our sample are contracted in US dollars, while Renminbi
In recent years, China’s large state-owned, commercial banks such as the Bank of China and the Industrial
11
and Commercial Bank of China have strongly increased their overseas loan portfolios. This increase is not
captured in our data collection.
17denominated loans play a minor role. Furthermore, we depict numbers by Bräutigam and Gallagher
(2014) who estimate that around 50 percent of Chinese overseas lending is collateralized by a
broad range of different commodities.
Figure 10. Characteristics of Chinese overseas loans
Note: This figure shows main characteristics of Chinese overseas loans as debt-weighted shares
in our sample of Chinese loan commitments since 2000. The share of collateralized loans (*) is
taken from estimates of Bräutigam and Gallagher (2014) based on Chinese loans to South
America and Africa.
3. Hidden debts: how large is the underreporting problem?
The opaqueness of China’s lending abroad results in potentially severe underreporting of external
debt stocks (primarily public and publicly-guaranteed). This is especially true in the developing
world, which has received the bulk of China’s direct loans. Here, we quantify the degree of
“hidden” Chinese debt flows and stocks with a focus on more than 100 debtor countries. In a first
step, we benchmark our lower-bound debt stock estimates to World Bank data. Second, we
compare our estimates to claims by China extracted from the BIS banking statistics. In both cases
we find large discrepancies between the stock of debt gathered from our well-documented micro
sources on the one hand and the debtor- and creditor-reported aggregates of official statistics on the
other hand.
3.1. Estimating “hidden debts” part 1: country reporting to the World Bank (debtor side)
To assess the scope of underreporting of Chinese claims in IMF and World Bank statistics, we use
non-public data from the so-called Debtor Reporting System (DRS), to which developing debtor
18countries around the world report on a regular basis. The World Bank publishes the aggregates
from the DRS in its International Debt Statistics, but bilateral (country to country) claims are not
publicly released. Here, we use an unpublished, bilateral data extract on Chinese loan commitments
by country and year (loans by China to public and publicly guaranteed entities). The DRS data is
used as an input to our calculations but not shown here, for reasons of confidentiality.
Based on this data, we can assess the size of missing commitments by China, i.e. the amounts of
Chinese loans that we know of but that do not appear in the most widely used external debt
statistics. For the comparison we clean and rearrange our own dataset of Chinese loans to match the
exact definition of the DRS data extract we have. Specifically, our subset of the DRS data
aggregates all loans extended by China to public and publicly guaranteed recipients, including the
central government. These claims do not include, however, loans by China’s state-owned but
commercial creditor banks, such as the Bank of China or ICBC, so that we purge these from our
consensus dataset. We also drop the (few) Chinese loans extended to private borrowers abroad.
The main insight from this exercise is that 50 percent of Chinese overseas loans are not recorded by
the World Bank and thus do not enter officially reported debt statistics. As of end-2016, the amount
of “missing” Chinese loans to developing countries exceeds 200 billion USD in total. Compared to
the early-and mid-2000s, the yearly amounts of missing Chinese debt outflows have increased
substantially in recent years (see Figure 11).
Figure 11. “Hidden” Chinese debts to the developing world: total non-reported flows
Note: This figure shows “hidden” Chinese lending flows to developing countries per year
focusing on public and publicly guaranteed debt (PPG). The estimates come from comparing
the aggregated flows from our loan-level consensus dataset to the aggregate commitments
recorded in the World Bank’s Debtor Reporting System database.
19We turn to our estimates of “hidden” public external debt stocks across developing countries. We
focus, in particular, on the 50 top recipient countries (see Figure 7). For this group, debt stocks
owed to China soared to an average of 17 percent of GDP in 2016 (Panel A of Figure 12). Of these
debts, 40 percent, or around 7 percent of GDP is not reported in the official statistics of debtor
countries.
Figure 12. Debt to China, total and “hidden” parts, 2001-2016, top 50 recipients
Note: This figure shows average debt owed to China by 50 developing and emerging economies, focusing
on public and publicly guaranteed debt (black solid line). The left panel shows debt to China as percent of
GDP, while the right panel shows debt to China as a share of reported, total external debts. The red
dashed line stands for “hidden” debt to China by the same country group. It is based on missing
commitments, i.e. Chinese loan commitments that are not reported to the World Bank’s Debtor Reporting
System. External debt stocks are from the World Bank’s International Debt Statistics.
The averages in Figure 12 conceal the large heterogeneity in the hidden debts owed to China.
Figure 13 presents frequency distributions for our sample of 50 top recipients (capital importers).
The left panel shows that, for around one half of the sample, hidden debt levels are low. But for the
other half, i.e. 25 countries, the hidden liabilities to China exceed 5 percent of GDP and for 12 of
them exceed 10 percent of GDP. To put these magnitudes in perspective, the right panel of Figure
13 shows by how much total external debt stocks need to be adjusted once hidden Chinese debts
are taken into account. As before, no major adjustment is needed for about half of the sample, but
for about two dozen countries the underreporting problem is severe. Officially reported external
debts stocks need to be adjusted upwards by up to 50% once China’s hidden lending is included.
20Figure 13. Scale of hidden debts to China - histograms
Note: This figure shows the frequency distribution of hidden debt to China as a percentage of debtor GDP
(Panel A) and in percent of reported, total external debt stocks (Panel B) for the top 50 recipients in the
developing world.
3.2. Estimating “hidden debts” part 2: China’s BIS reported bank claims (creditor side)
Our second approach to estimate “hidden” Chinese debts builds on recently released BIS data. As
explained above, China (along with Russia) started reporting its cross-border bank claims to the
BIS Locational Banking Statistics in 2016, and these claims are dominated by state-owned banks
that lend overseas. The BIS is not authorized to publish data on bilateral (country to country)
Chinese claims, but we can exploit the structural break in total reported claims after China joined
the locational banking statistics (following the approach of Cerutti and Zhou 2018). Specifically,
we focus on the fourth quarter of 2015 and the first quarter of 2016. In the original BIS time series,
the claims of China or Russia were not included. But in 2016 the series were revised backward to
include total claims to all reporting countries, including the recently joined ones, and the old and
new series are both publicly available. More specifically, we downloaded the new, revised series
(which includes China and Russia) in February 2019 and compare it to the original series (without
claims by China and Russia), which we hand-coded from the BIS Statistical Bulletins for 2015 and
2016.
This procedure yields aggregate claims toward each country with and without China. Subtracting
one series from another thus gives us an estimate of bilateral Chinese claims around the world.
Figure 14 illustrates this procedure for four countries that heavily borrowed from China, namely
Laos, South Africa, Zambia and Pakistan. In each case, total claims increase substantially and the
dynamics of the time series changes markedly after claims to China (and Russia) are included into
the BIS series.
21The obvious confounder here is that Russia’s bank claims were added to the BIS at the same point
in time. Russia’s overseas lending, however, is much smaller and concentrated on a few regions
only. Russia’s banks mostly lend to countries of the former Soviet Union, plus a few advanced
countries and to offshore havens. The rest of the world, however, especially countries of Africa,
East Asia and Latin America receive little if any bank loans from Russia (Cerutti and Zhou 2018).12
For most countries in the sample, the approach of comparing old and new BIS series will thus
generate a useful proxy of total bank claims by banks resident in mainland China.
Figure 14. Aggregate bank claims towards selected debtor countries (BIS)
Note: This figure shows aggregate bank claims in billions of USD towards various debtor
countries (all currencies, all instruments, all sectors). We compare the BIS time series on
total bank claims (dotted blue line) to a revised series that also contains bank claims by China
and Russia (red line). The break in the series occurred because China and Russia started to
report to the BIS in end-2015. The difference between red line and dotted blue line thus
represents claims by China and Russia, i.e. the size of external debt stocks owed to the banks
resident in these two creditor countries.
We next compare the BIS-based estimates of total Chinese claims to our own, loan-based debt
stock estimates. To make both estimates comparable, we drop from our estimates all debt to non-
bank Chinese creditors. Just like our own estimates, the BIS reported claims should be interpreted
as a lower bound, as both series (the BIS statistics and our own) do not capture large amounts of
Chinese lending that flows through offshore centers, as discussed above.
12
An exception is Venezuela, to which Russian banks reportedly have high exposure.
22As expected, the two estimates are highly correlated for the majority of countries and a scatter plot
of the two sources (using end-2015 data) reveals only small deviations for the majority of
countries. We do, however, find a number of anomalies that point towards an interesting pattern of
under-reporting of Chinese lending in some parts of the world. Our estimates of debt owed to
Chinese banks by far exceed BIS implied debt stocks for some of the riskiest and most volatile
debtor countries worldwide, such as Angola, Equatorial Guinea, Venezuela or Zimbabwe. All four
countries have received large amounts of Chinese bank loans, but these loans do not show up in the
numbers reported by China to the BIS.
Figure 15 (Panel A) shows that the old series (without China) is very close to the new series (with
China) in each case, suggesting that banks in mainland China have barely any outstanding claims
towards these countries. Our loan-level dataset, however, shows that Chinese banks lent
extensively to each country and our numbers are more in line with those reported in the financial
press.13 The reporting gaps are evident in Panel B of Figure 15, which compares BIS claims by
China to our own debt stock estimates for the four countries, shown as a share of debtor country
GDP. As of end-2015, our bank debt estimate for Zimbabwe is 2.7 billion USD, compared to no
debt in the BIS data. The gap is similarly large for the other countries, with discrepancies of 1.2
billion USD, 14 billion USD and 33 billion USD in Equatorial Guinea, Angola and Venezuela,
respectively. As a share of output, the underreported claims range from 9% of GDP in Equatorial
Guinea to almost 20% of GDP in Zimbabwe.14
One explanation for the large degree of “hidden” debt in crisis countries is that China uses “circular
lending” strategies to minimize the risk of default on its overseas loans. For risky debtors, China’s
state-owned policy banks often choose not to transfer any money to accounts controlled by the
recipient government. Since the overseas loans are not actually transferred abroad, there is no
cross-border bank claim to report to the BIS and this could explain parts of China’s reporting gaps.
A systematic comparison of BIS reporting gaps and sovereign risk ratings supports this conjecture.
Figure 16 plots the difference between BIS implied Chinese claims and our loan-level estimates of
bank debt against the sovereign credit risk rating of Moody’s. In some countries with low credit
ratings, there are large reporting gaps according to our estimates. The debt reported by China to the
BIS is significantly lower than our conservative debt numbers.15 In contrast, for countries with
comparatively higher sovereign credit ratings, debt stocks tend to match our debt stock numbers
well. This pattern is robust to using other sovereign ratings (incl. by Fitch, S&P, Dagong of China).
13
For example, the Financial Times recently reported that “At the end of 2017, Angola’s debt to China
amounted to $21.5bn” (FT, June 13, 2018, “Angola’s debt reliance on China may leave it short-changed”).
Our own estimate is exactly that: 21.5 billion US Dollar as of 2017, but the BIS implied stock is almost zero.
14
Note that hidden bank claims in the BIS Locational Banking Statistics (a source based on reporting by
creditor countries) do not necessarily imply that there is also hidden debt in the World Bank’s International
Debt Statistics (a source that is based on debtor country reporting).
15
It is possible that, in a few cases, we overestimate outstanding bank debt to China, if disbursements fall
considerably short of commitments (see Appendix I for a discussion).
23You can also read