Towards improved access to broadband inAfrica - United ...
←
→
Page content transcription
If your browser does not render page correctly, please read the page content below

Towards improved
access to broadband
in Africa
Towards improved
access to broadband
in Africa
To order copies of Towards improved access to broadband in Africa by the Economic Commission for Africa,
please contact:

Publications Section
Economic Commission for Africa
P.O. Box 3001
Addis Ababa, Ethiopia
Tel: +251 11 544-9900
Fax: +251 11 551-4416
E-mail: eca-info@un.org
Web: www.uneca.org

© 2017 Economic Commission for Africa
Addis Ababa, Ethiopia

All rights reserved
First printing November 2017

Material in this publication may be freely quoted or reprinted. Acknowledgement is requested, together
with a copy of the publication.

The designations employed in this report and the material presented in it do not imply the expression of
any opinion whatsoever on the part of the Secretariat of the United Nations Economic Commission for
Africa concerning the legal status of any country, territory, city or area or of its authorities, or concerning
the delimitation of its frontiers or boundaries.

Designed and printed in Addis Ababa by the ECA Printing and Publishing Unit. ISO 14001:2004 certified.
Printed on chlorine free paper

Cover photos: Shutterstock.com
Table of Contents

Acknowledgements ............................................................................................................... VI

Executive summary...............................................................................................................VII

CHAPTER 1: Background and context...............................................................................1
   1.1   Introduction ............................................................................................................................. 1
   1.2   Rationale for improved access
         to broadband in Africa.......................................................................................................... 2
   1.3   Methodology............................................................................................................................ 7
   1.4   Conclusion................................................................................................................................. 7

CHAPTER 2: Review of the state of broadband infrastructure and services
in Africa.......................................................................................................................................8
     2.1        Introduction.............................................................................................................................. 8
     2.2        Trends in broadband access and use in Africa.......................................................... 9
     2.3        Backbone infrastructure and bandwidth................................................................. 11
                2.3.1 International connectivity............................................................................... 11
                2.3.2. Backbone network infrastructure............................................................... 13
                2.3.3 Access network infrastructure...................................................................... 14
     2.4        Facilitating universal access: the role of public ICT access points............... 16
     2.5        Investment expenditure on broadband infrastructure in Africa.................. 16
     2.6        Conclusion.............................................................................................................................. 19

CHAPTER 3: Status of development of national broadband policy, strategy
and plans in Africa................................................................................................................. 20
    3.1     Introduction........................................................................................................................... 20
    3.2     Status of broadband policies and regulatory frameworks in Africa............ 20
    3.3     Goals of broadband policies and strategies............................................................ 21
    3.4     Regulatory issues................................................................................................................. 23
    3.5     Challenges............................................................................................................................... 25
    3.6     Conclusion.............................................................................................................................. 25

CHAPTER 4: Broadband in the context of African regional integration.................. 27
   4.1   Introduction........................................................................................................................... 27
   4.2   Impact of broadband on regional trade and integration................................... 28
   4.3   Regional broadband initiatives ..................................................................................... 30
         4.3.1 Regional policy, regulatory and legal frameworks................................ 32
         4.3.2 Regional backbone infrastructure for integration............................... 34
   4.4   Challenges to and constraints on regional integration..................................... 41
   4.5   Conclusion.............................................................................................................................. 42

CHAPTER 5: Regulation and pricing of broadband services...................................... 43
   5.1   Introduction........................................................................................................................... 43
   5.2   Fixed-broadband prices in Africa................................................................................. 43
   5.3   Mobile broadband prices in Africa.............................................................................. 45
   5.4   Price and pricing trends.................................................................................................... 47

                                                                                                                                                        III
Towards improved access to broadband in Africa
5.5 Regulation is key to enhancing broadband access and
making it affordable............................................................................................................ 48
5.6 Introducing innovative pricing models...................................................................... 49
5.7 Conclusion.............................................................................................................................. 49
CHAPTER 6: Conclusion and policy recommendations.............................................. 50
6.1 Conclusion.............................................................................................................................. 50
6.2 Policy recommendations.................................................................................................. 51
6.2.1 Broadband policies and strategies............................................................... 51
6.2.2 Universal access to broadband..................................................................... 52
6.2.3 Harmonization of policy and regulatory frameworks........................ 52
6.2.4 Regional backbone infrastructure and exchanges............................... 53
6.2.5 Broadband for regional integration............................................................ 53
6.2.6 Pricing and regulation........................................................................................ 53
References............................................................................................................................... 55
Annex I: List of African countries with national broadband policies......................... 61
Annex II: Broadband concepts and terminologies......................................................... 64
Annex III: Common traits/features of broadband policies and strategies................ 68
List of Figures
Figure I: Impact on GDP of an increase of 10 per cent in broadband
penetration (Per cent)........................................................................................... 3
Figure II: Growth effects of the ICT sector (Per cent).............................................. 3
Figure III: Broadband ecosystem......................................................................................... 8
Figure IV: Status of ICT access and useage in Africa, 2005 -2015 (Per 100
inhabitants/households)...................................................................................... 9
Figure V: Fixed broadband subscriptions by region, 2015 (Per 100
inhabitants)............................................................................................................. 10
Figure VI: Fixed broadband subscriptions in selected African countries,
2015 (Per 100 inhabitants)............................................................................. 10
Figure VII: Active mobile broadband subscriptions by region, 2015 (Per 100
inhabitants)............................................................................................................. 11
Figure VIII: International bandwidth per Internet user by region, 2004 and
2013 (Bits per second)...................................................................................... 12
Figure IX: Top 10 countries in Africa in terms of international Internet
bandwidth per Internet user, 2014............................................................. 13
Figure X: 3G and 4G networks by deployment by region, 2012....................... 15
Figure XI: Deployment of mobile networks in 53 African
countries, 2014 (Per cent)............................................................................... 15
Figure XII: Goals of national broadband plans in Africa, 2012 (Per cent)........ 22
Figure XIII: Africa international Internet bandwidth, 2006-2015 ...................... 33
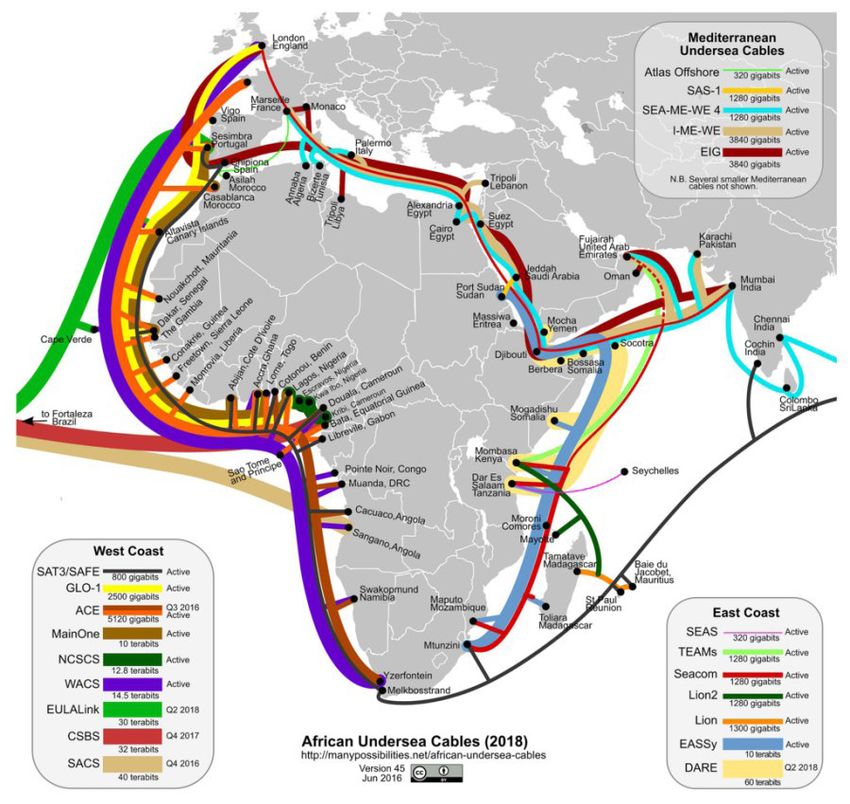
Figure XIV: Map ofAfrican submarine cables.................................................................. 36
Figure XV: Used international bandwidth growth by region, 2011-2015 (Per
cent)............................................................................................................................ 37
IVFigure XVI: International Internet bandwidth in sub-Saharan Africa supplied
by terrestrial cross-border networks......................................................... 39
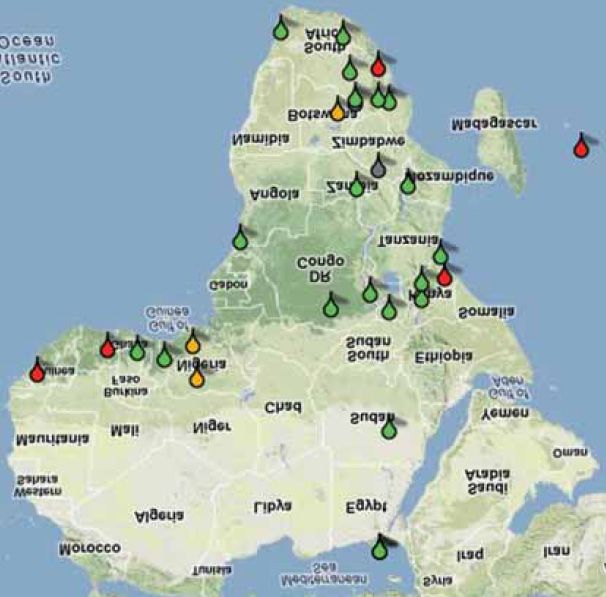
Figure XVII: Map of African Internet exchange points ................................................ 40
Figure XVIII: Fixed broadband prices as a proportion of gross national income
per capita in Africa, 2014 (Per cent)........................................................... 44
Figure XIX: Fixed broadband prices as a proportion of gross national income
per capita, by region, 2014 (Per cent)........................................................ 45
Figure XX: Mobile broadband prices as a proportion of gross national income
per capita by region, 2013 (Per cent)......................................................... 46
Figure XXI: Cheapest prepaid 1GB basket for quarter 1 of 2014
(United States dollars)....................................................................................... 46
Figure XXII: Broadband development index, ranking of regions, 2014............... 50
List of Tables
Table 1: Research results regarding the impact of broadband on growth.... 4
Table 2: Investing in different network infrastructure layers.......................... 17
Table 3: Examples of goals found in national broadband plans/strategies.22
Table 4: Destination of African regional economic community exports, on
average, 2000-2015 (Percentage of world total)................................ 28
Table 5: Sources of Africa regional economic community imports, on
average, 2000–2015 (percentage of world total)................................ 29
Table 6: Status of broadband development in the
East African Community.................................................................................. 32
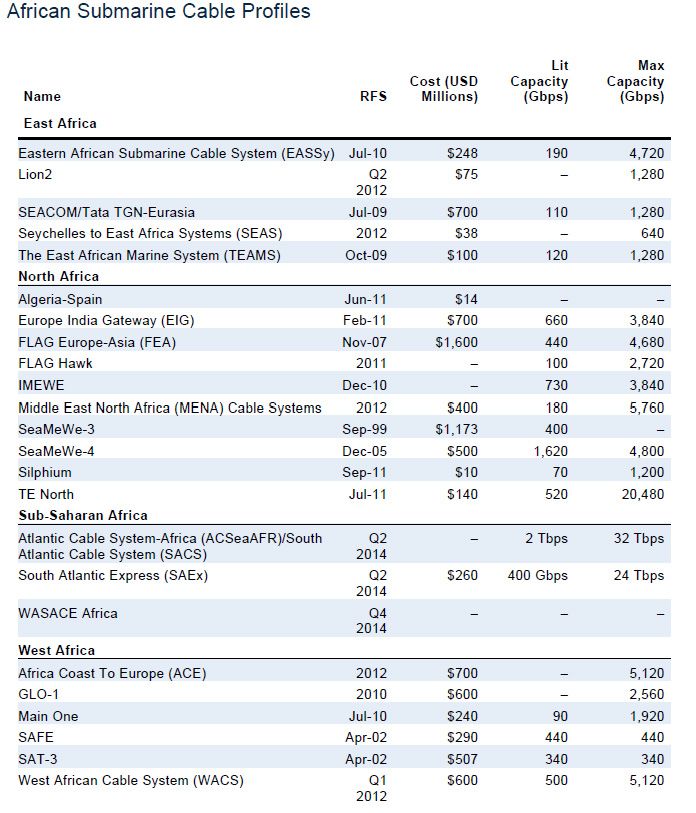
Table 7: African submarine cable profiles.................................................................. 35
Table 8: East African Community national optical fibre
cable deployment................................................................................................. 38
Table 9: Internet exchange points and data capacity, 2012-2013................. 40
List of Boxes
Box 1: Example of broadband effects on economic growth
in South Africa.......................................................................................................... 5
Box 2: Egypt’s eMisr national broadband plan of 2011, with a short-term
target to 2015 and a long-term target to 2021.................................... 18
Box 3: Kenya’s national broadband strategy, 2013 – 2017........................... 18
Box 4: Nigerian national broadband plan for the period 2013-2018:
funding estimates for deployment .............................................................. 19
Box 5: Open access to international submarine or terrestrial cables....... 24
Box 6: Regional backbone initiatives........................................................................ 31
Box 7: Fourth generation regulation......................................................................... 48
VTowards improved access to broadband in Africa Acknowledgements This report was prepared by a team led by Kasirim Nwuke, Chief of the New Technologies and Innovation Section, Special Initiatives Division, Economic Commission for Africa (ECA). Fatima Denton, Director of the Special Initiatives Division, provided overall direction and guidance. It was conceptualized by Mr. Nwuke and coordinated by Mactar Seck, Economic Affairs Officer, New Technologies and Innovation Section. Mr. Seck drafted chapters 1, 2, 3 and 6, Mr. Abebe Chekol, chapter 4,5 with contributions from Abdul Jethro James Guillaume. Research and technical support was provided by Asfaw Yitna and Gedion Workneh, while Hidat Mebratu and Rahel Menda provided logistical and administrative support. Mr. Nwuke reviewed and quality assured the report. The report was edited and printed by ECA Publishing. The views expressed in this report do not necessarily reflect the views of ECA, the United Nations, its senior officials or any of its Member States. VI
Executive summary

African countries are striving to create a digital economy to foster new drivers of
economic and social transformation, innovation, governance, and regional integration.
Progress on this score is critically dependent on infrastructure, notably broadband
infrastructure, and access to it. Africa has enormous infrastructure gaps, including
broadband infrastructure, and access to broadband services, where they exist, is also
very expensive. Accordingly, building broadband infrastructure and making broadband
services accessible and affordable have been major policy preoccupations of African
Governments.

Broadband services are delivered using various technologies throughout the continent.
The infrastructure used mostly to provide broadband includes asymmetric digital
subscriber line technology over the copper access network, the 3G and 4G (recently
being rolled out in many countries) mobile networks, Fibre to the Node networks and
Fibre to the Premises networks. With landing of the submarine fibre optic cables, the
terrestrial networks have been dominating and satellite broadband networks have
been declining. With the extraordinary penetration of mobile on the continent and the
limited availability, mobile broadband subscriptions have grown exponentially, leaving
the fixed broadband penetration progressing very slowly.

The present report presents an analysis, based on secondary data and government
documents, progress in Africa in building broadband infrastructure and in promoting
access to it. The findings presented in this document are based on a detailed analysis
of the data for the coverage of broadband customer access networks, along with their
likely performance, given the known constraints. The analysis also uses the available
information to measure broadband availability in terms of the infrastructure currently
in place, and the policy and regulatory environment at both the national and regional
levels, for enabling improved broadband access.

Overall, the analysis found that, while there is impressive growth in mobile broadband
access in African countries, there is very limited access to fixed broadband. In many
countries, fixed broadband does not exist. As a result, the continent has the least
affordable broadband services in the world. However, the increasing number of
countries with national broadband plans in place shows the intention to improve access
and affordability through various measures.

The report considers not only broadband availability, but also its quality, which is
affected by several factors. It also provides an analysis measuring availability through
the infrastructure currently in place and the possible achievable speeds over that
infrastructure as the measure of quality. In this regard, with the increased access to
international connectivity through fibre optic submarine cables, Africa has been the
fastest-growing region, with international bandwidth demand increasing 69 per cent
compounded annually between 2009 and 2013. This enables important regional
cooperation and collaboration to enhance availability and to ensure optimal use of
the available infrastructure for the benefit of the continent. In this regard, the report

                                                                                      VII
Towards improved access to broadband in Africa contains a discussion of the important role for broadband in the context of fostering regional integration. The impact of broadband pricing and regulation is also discussed as key to improving access at the national and regional levels. The structure of pricing in itself can both cause and address the challenges. The importance of both regulation and competition is highlighted. Lastly, the report makes a set of recommendations for consideration by African stakeholders, especially by policymakers and decision makers, in order to improve access to broadband on the continent and to unleash the contribution of broadband to the African transformation agenda. VIII
CHAPTER 1: Background and context

1.1 Introduction
African countries have long recognized the importance of information and
communications technologies (ICT), such as broadband access and services, for their
development and structural transformation. In 1999, the Economic Commission
for Africa (ECA) organized the first African Development Forum on the theme “The
challenge of globalization and the information society”. The Forum helped to create an
African consensus to assess the opportunities, address the challenges and develop a
plan of action to ensure that Africa does not fall behind in the information society.

This subject was taken up years later by the African Union. At its 2010 Summit, African
Union Heads of State and Government adopted a declaration on ICT, declaring the sector
a top priority for the development of the continent. In the declaration, member States
and development partners were encouraged to acknowledge telecommunications and
ICT services as basic public utility infrastructure (African Union, 2010). The importance
of ICT is reiterated in the African Union’s Agenda 2063, the continent’s long-term
strategy for structural transformation.

African countries have made significant advances in access to ICT, although at a pace still
far behind other regions of the world. Broadband technology is critical for expanding
access. The diffusion of broadband technology, defined as the technology that enables
the high-speed transfer of data, is inextricably linked to the emergence of the Internet.
While, in the early days, gaining access to the Internet was done primarily through
dial-up connections,1 consumer and enterprise demand promoted the evolution of
technologies that facilitated access at higher speeds.

As technology advances and new applications and services emerge, the ability for
broadband technology to influence the economy expands. Investment in broadband
infrastructure and services has a direct impact on the economy. Factors driving growth,
such as innovation, firm efficiency and productivity, competition and globalization, offer
indirect impacts (Atkinson, 2007). Studies confirm that broadband has the highest
effect on growth by, at 1.38 per cent of gross domestic product (GDP) in low-income
and middle-income economies, compared with the effects of the Internet (1.12 per
cent), mobile telephony (0.81 per cent) and fixed telephony (0.73 per cent).

Apart from the economic benefits seen in its impact on GDP, broadband has a positive
impact on many socioeconomic sectors. In the agriculture sector, for example, farmers
increasingly rely on this technology to obtain an accurate measure of and control
over the amount of minerals in the soil. They also rely on the Internet to forecast
weather conditions, market their products and find high-quality and cheap supplies.
In non-agriculture industries, business people and entrepreneurs view the services as
necessary to the future of their activities and invest resources in areas in which they

1
 Dial-up technology refers to Internet access over conventional voice telephone lines at speeds that do not
exceed 56 Kbps.

                                                                                                              1
Towards improved access to broadband in Africa
can conduct e-commerce business online. Such consumer spending was expected to
grow to $1.4 trillion by 2015.2
Mobile Internet (mobile broadband) is particularly important for Africa. On the one
hand, it brings millions of users online in many countries, given the limitations in the
coverage of the fixed network, On the other hand, it enables new innovative services on
the basis of mobile access to the Internet, using all features embedded into the smart
devices and accessible through apps. The continent has to overcome many challenges,
however, before it can fully harness the potential of broadband for its development
aspirations.
In response to these challenges, the Economic Commission for Africa (ECA) conducted
the present study to support member States in their efforts to deploy broadband
technology for their development and structural transformation. The report contains a
number of recommendations for consideration and adoption by African Governments
and their development partners, including recommendations on the way forward.
The report consists of several chapters. This first chapter provides the background
and context for the study. Chapter two reviews the state of broadband infrastructure
and services in Africa, with specific emphasis on growth trends, penetration rates (both
fixed and mobile broadband), access and usage, investment expenditure and business
models that operators use and how these affectuptake and use of broadband services,
including the issue of affordability.
Practically all African countries have adopted broadband policy as a means of driving
the diffusion and uptake of the technology. Chapter three reviews the status of
development of broadband policy and strategies in Africa and the various goals that
countries set in extending access to broadband, including the various innovative policies
and regulatory frameworks to enhance widespread and universal access and use.
Chapter four contains an exploration of the role for broadband technology in fostering
African regional integration and cooperation. It focuses on how regional strategies and
policies, including harmonization of regulatory frameworks, are important in uptake
and use of broadband on the continent and for enabling its special role in facilitating
regional integration and cooperation.
Chapter five looks at pricing and regulation issues as the key determinant factors in the
expansion and widespread adoption and use of broadband technology. Lastly, chapter
six provides a summary of the findings and key recommendations for consideration by
African policymakers and decision makers.
1.2 Rationale for improved access
to broadband in Africa
Several studies demonstrate that broadband penetration and broadband quality
are important factors for economic growth. According to a World Bank study, it is
estimated that every 10 per cent increase in broadband penetration in low-income and
2
See www.invesp.com/blog/ecommerce/how-big-is-ecommerce-industry.html.
2Chapter 1: Background and context
Figure I: Impact on GDP of an increase of 10 per cent in broadband
penetration (Per cent)
Czernich et al.a 0.90% 1.5%
Qiang & Rossotto b 1.21% 1.38%
Analysys Mason c 1.10%
McKinsey (Average studies) d 0.60% 0.70%
Katz e 0.24% 0.26%
0.00% 0.20% 0.40% 0.60% 0.80% 1.00% 1.20% 1.40% 1.60%
Minimum Difference
Source: Czernich and others (2009); Zhen-Wei Qiang and Rossotto (2009); Analysys Mason (2010); Beardsley and
others (2010); Katz and others (2010).
a
Sample of the 20 countries of the Organization for Economic Cooperation and Development.
b
Various countries; upper range applies to developing countries and lower range applies to developed countries.
c
Limited to mobile broadband impact in India.
d
Average of five country studies. Australia, Egypt, Malaysia, New Zealand and the United Kingdom of Great
Britain and Northern Ireland (various sources for 2003 and 2004 and Zhen-Wei Qiang and Rossotto (2009)).
e
Includes only Germany.
Figure II: Growth effects of the ICT sector (Per cent)
1.6
1.38
1.4
1.21
0.2 1.12
1.0
0.81 0.77
0.8 0.73
0.6
0.6
0.43
0.4
0.2
0.0
Fixed telephony Mobile telephony Internet Broadband
High-Income Countries Low- and Middle-Income Countries
Source: Adapted from Zhen-Wei Qiang and Rossotto (2009).
middle-income countries results in a commensurate increase of 1.38 per cent of GDP
(Kim and others, 2010). The study also demonstrates that broadband has a potentially
higher growth effect than other ICT, as shown in figure I.
3Towards improved access to broadband in Africa
Table 1: Research results regarding the impact of broadband on growth
Country/ Study Data Impact
Region
Crandall and 48 states in the United No statistically significant impact on
United States of others (2007) States, 2003-2005 GDP growth
America
Thompson and 46 A 10 per cent increase in broadband
Garbacz (2008) states in the United States, penetration was linked to a 3.6 per cent
2001-2005 increase in efficiency
Organization Czernich and 25 OECD countries, 1996- Broadband adoption elevated per
for Economic others (2009) 2007 capita GDP by between 1.9 and 2.5 per
Cooperation and cent
Development
(OECD)
Koutroumpis 22 OECD countries, 2002- A 10 percentage point increase in
(2009) 2007 broadband penetration produced
between a 0.7 and 1 per cent increase
in GDP growth
Germany Katz and others 424 counties in Germany, A 10 per cent increase in broadband
(2010) 2000-2006 penetration produced a 0.255 per cent
increase in GDP growth
Developed Zhen-Wei Qiang Developed counties from a A 10 per cent increase in broadband
countries and Rossotto sampling of 120 countries, penetration produced a 1.21 per cent
(2009) 1980-2002 increase in GDP growth
Low-income and Zhen-Wei Qiang Remaining countries (low- A 10 per cent increase in broadband
middle-income and Rossotto income and middle-income penetration contributed 1.38 per cent
countries (2009) developing economies) to economic growth
from a sampling of 120
countries, 1980-2002
United Kingdom of SQW (2013) The study covers all the The availability and uptake of faster
Great Britain and areas from least densely broadband speeds will add some £17
Northern Ireland populated to most densely billion to the annual gross value added
broadband impact populated by 2024
studya (density decile, using
census data) in the United
Kingdom since 2008
Source: Broadband Commission for Digital Development (2012b). a SQW (2013).
Other studies also reveal the economic impact of broadband deployment directly,
through jobs created by the establishment of broadband infrastructure and, indirectly,
as a result of “spillover” externalities, such as increased productivity and new products
and services through accelerated innovation (Broadband Commission for Digital
Development, 2012a).
Governments are also increasingly leveraging broadband to provide online services in
which citizens can receive information and interact with the public service administration.
Broadband facilitates such civic engagement and provides Governments with ease in
performing specific functions, such as tax collection and civic registrations. Broadband
enables government-to-citizen, government-to-government and government-to-
business engagement. By facilitating access to economic opportunities and social
welfare in developing countries, mobile broadband, for example, has been driving
4Chapter 1: Background and context
Box 1: Example of broadband effects on economic growth in South Africa
In July 2010, the Government of South Africa issued a broadband policy for the country. The
policy provides that, by 2019, 15 per cent of the country’s households will have direct access to
broadband of at least 256 Kbps download speed, with broadband reaching within 2 km of the
remaining households. A 2010 study by Analysys Mason reviewed the likely direct and indirect
effects that this broadband policy might have on the South African economy. The study found
that wireless broadband could increase the country’s GDP by 1.8 per cent, or more than $9.4
billion, by 2015. In addition, wireless broadband was expected to create some 28,000 new jobs
directly, not including jobs created outside the communications industry.
As a result, the direct effect alone of wireless broadband (i.e., spending on broadband services
and broadband-enabled devices) increased the GDP of South Africa by 0.71 per cent by 2015, or
$3.7 billion. The biggest impact on GDP, however, was expected to come from productivity and
efficiency gains.
Source: World Bank (2012).
financial inclusion through mobile banking and mobile money in Africa and supporting
new ways of delivering health care in many developing nations (GSMA, 2016).
As the continent looks ahead to achieving sustainable development that embraces
green growth strategies, broadband also contributes to a more energy-efficient
future in which connected homes and businesses are able to monitor and reduce their
electricity consumptions, which, in turn, helps to realize energy savings, among other
benefits. These are just a few examples of the benefits of broadband to showcase why
countries are increasingly investing in expanding its access and use.
Nevertheless, while Africa made remarkable advances in the growth of the mobile
market, it has not been replicated in the Internet sector, give that access to broadband
has been very limited. While fixed broadband has been growing continuously since
2012 because of the significant investment made in optical fibre infrastructure in
Africa, the penetration rate remains below 1 per cent, compared with 27 per cent in
Europe.
The main reasons for this low level of broadband penetration in Africa are limited
availability and the price of the services. In 2013, Africa had the least affordable
broadband services, with the average fixed price at approximately 64.3 per cent of
gross national income per capita, which is almost three times the world average of 22.1
per cent. It is only in four countries (Gabon, Mauritius, Seychelles, and South Africa)
that the price for fixed broadband is below 5 per cent of gross national income per
capita. In more than half the African countries, the prices are more than 40 per cent of
gross national income per capita.
Given that several international submarine cables have become operational in Africa
since 2009, the bottlenecks in the broadband chain have improved. Nevertheless,
regulatory action to open international gateways to competition, including for the
regional backbone and access networks, could lower barriers to entry into the market,
which could stimulate competition in broadband services.
5Towards improved access to broadband in Africa Africa has been the fastest-growing region in international bandwidth demand, which increased 69 per cent, compounded annually, between 2009 and 2013. While international bandwidth demand, measured in terms of used international capacity, reached 138 Tbps in 2013, which represents a 4.5-fold increase from the 30 Tbps of demand used globally in 2009, the pace of annual international bandwidth demand growth has slowed around the world and declined to 39 per cent in 2013. By contrast, international bandwidth in Africa increased by 20 times from 2009 and reached 2.034 Tbps by December 2015. In North Africa alone, bandwidth increased 36 per cent by 2015, while in sub-Saharan Africa it grew by 39 per cent. Submarine cables have been designed with vast capacity, and by mid-2015 barely 8 per cent of capacity was being utilized. International bandwidth in Africa is expected to continue growing, given the projected growth in mobile broadband and the associated growth in mobile data traffic. According to the 2012 annual report of GSMA (2012), by 2017, half of the 8.5 billion mobile connections would be in 3G or 4G. While the mobile-cellular population coverage is getting better, operators are yet to deploy mobile Internet-capable networks as widely as the mobile voice services. This is evident by the fact that 3G population coverage in sub-Saharan Africa remains at 42 per cent of the level of mobile-cellular networks (Internet Society, 2015). For Cisco (2016), global mobile data traffic grew 74 per cent in 2015, reaching. 3.7 exabytes per month by the end of 2015, up from 2.1 exabytes per month at the end of 2014. Mobile data traffic has grown 4,000 times since 2005 and almost 400 million times since 2000. This will put operators under pressure to expand access and the capacity of network backbone to meet the growing demand for bandwidth. At the global level, several initiatives are in progress, aimed at the accelerated penetration of high-speed Internet and its dissemination in the various sectors of the economy. For example, in response to the call of the previous Secretary-General to step up efforts to meet the Millennium Development Goals, the International Telecommunication Union (ITU) and the United Nations Educational, Scientific and Cultural Organization formed the Broadband Commission for Digital Development. The Commission published a report in 2013 entitled ““Transformative solutions for 2015 and beyond”, which contained an analysis of national broadband plans for 138 countries and highlighted how broadband had positively changed the world by transforming and improving people’s living conditions. National backbone remains a major supply bottleneck and may be the weak link in the emerging African broadband infrastructure value chain. There has been progress in expanding the national backbone in Africa, with Angola, Botswana, Burundi, Ethiopia, Ghana, Kenya, Madagascar, Malawi, Rwanda, the Sudan, South Africa, Uganda and the United Republic of Tanzania among the countries that have launched plans since 2013 to develop their national backbone networks. A wide gap remains for a number of countries in Central and West Africa. 6
Chapter 1: Background and context

The regional backbone has attracted only limited private sector interest because of the
diversity of regulatory frameworks and the unattractiveness of some of the routes that
are prone to high sunk costs. Nevertheless, at the subregional level, fibre backbones
have been growing in Southern Africa, which acts as a hub for surrounding countries. In
West Africa, Ghana, Nigeria, and Senegal act as the connectivity hubs in that subregion.

Given that broadband network investment tend to follow regional trade and economic
activities, with the goal of connecting profitable urban centres rather than rural and
underserved areas, the major regional broadband gap is in West, Central and East
Africa. In this regard, while Africa is striving towards improving intraregional trade
and economic integration, the role of broadband in enhancing regional integration is of
paramount importance.

1.3 Methodology
The various approaches and analytical techniques considered in this study include
existing surveys and administrative data, case studies, panel studies, the use of focus
groups, direct observation and document examination. To this end, the research
relied primarily on secondary sources of data, namely, data gathered and maintained
by internationally mandated organizations by ITU, the World Bank and others. These
data were supplemented and verified by primary data from official policy and other
documents from member States. The “secondary” reference documents were used
mainly contextually to examine data gathered on key aspects of world events that have
an impact on policy analysis.

As stated by Duke (2002), Tait (2010) and Yanow (2000), written documents are key
primary sources in interpretive studies and are of paramount importance in policy
research. To this end, documents and literature from government authorities and
institutions, mainly ministries in charge of ICT, from as many countries as possible have
been consulted. In addition, relevant sources of information to assess current and future
trends in the ICT sector globally and at the continental level have been reviewed. In
this regard, data have been collected from the databases of international organizations
and research institutions that gather primary data on the ICT and telecom industry.

1.4 Conclusion
Broadband has been increasingly recognized in many countries as critical infrastructure,
such as railways, roads and others that enable rapid socioeconomic growth. To this effect,
the development of broadband infrastructure and services needs to be guided by carefully
designed national and regional broadband plans and strategies, with specific targets in
terms of coverage, quality, economic impact and other socioeconomic outcomes.

This report is therefore structured to provide an account of the status of broadband
infrastructure and services on the continent, as reflected in the national plans and strategies
towards achieving such development. The regional context of broadband, and the
progress on its contribution to regional integration and cooperation are also highlighted.
Lastly, as key determinants of improved access, price and regulation are addressed in the
recommendations for consideration by African policymakers and decision makers.

                                                                                                7
Towards improved access to broadband in Africa CHAPTER 2: Review of the state of broadband infrastructure and services in Africa 2.1 Introduction Traditionally, the term broadband referred to high-speed communications networks that connected end users at a data transfer speed greater than 256 Kbps. For example, the United States Federal Communications Commission recently proposed to raise the minimum speeds allowed for broadband from 4 Mbps down and 1 Mbps up to 25 Mbps down and 3Mbps up. Apart from the quantitative indicators, a number of qualitative indicators, such as class of service and quality of service, are now associated with broadband definitions. These cover applications and services that are made possible only by broadband technology, as well as the likely impact that broadband has on socioeconomic development. In a related topic, these indicators are what constitute the “broadband ecosystem”, as shown in figure III. The World Bank has been promoting the concept of an ecosystem of users, services, networks and applications, positing that growth in broadband availability results from interactions in the demand and supply chain, with the intention of accelerating access and increasing adoption and use (Kim and others, 2010). This chapter provides a general overview of broadband infrastructure and services in Africa, growth trends in the penetration rate, (both fixed and mobile broadband), access Figure III: Broadband ecosystem Source: Federation Communications Commission. Available from http://www.broadband.gov/plan/3-current- state-of-the-ecosystem/. 8
Chapter 2: Review of the state of broadband infrastructure and services in Africa

  and usage statistics, investment expenditure and how universal access is enabled
  through public ICT access points.

  2.2 Trends in broadband access and use in Africa
  During the period 2005-2010, Africa’s ICT infrastructure significantly improved, with
  growing access to ICT, although at a rate still far behind other regions of the world. In
  2015, it was estimated that there were 2.04 billion users of social media around the
  world; that number was expected to increase to 2.22 billion in 2016.3

  Overall, it is estimated that approximately 9 per cent of Africans use social media. South
  Africans are among the world leaders in time spent on social networks, with an average
  of 3.2 hours a day, compared with a global average of 2.4 hours. The active Facebook
  user population in Africa grew by 20 per cent, to 120 million, in June 2015, from 100
  million in September 2014. Some 4.5 million of these users are based in Kenya, 15
  million in Nigeria and 12 million in South Africa. More than 80 per cent of users gain
  access to Facebook from their mobile phones. By 2018, between 50 and 70 per cent of
  the African population could have access to a smartphone (Ericsson, 2017).

  ICT penetrationcontinued to grow, with an increase in mobile-cellular subscriptions
  from 63 per cent in 2013 to 76.2 per cent in 2015. Active mobile-broadband
  subscriptions almost doubled, from 10.9 per cent in 2013 to 19 per cent in 2015, and
  individuals using the Internet increased from 16.7 per cent in 2013 to 22.5 per cent in
  2015. The 6.7 per cent of households with Internet access at home in 2013 increased
  to 13.6 per cent in 2015, which is also a key indicator in terms of guaranteeing inclusive
  access. In terms of the number of SIM cards in circulation, the accounts of the African
  mobile market are even higher. Many African users often have several cards and had

  Figure IV: Status of ICT access and useage in Africa, 2005 -2015 (Per 100
  inhabitants/households)
                                    90.0
                                    80.0
                                    70.0
Per 100 in habitants /House holds

                                    60.0
                                    50.0
                                    40.0
                                    30.0
                                    20.0
                                    10.0
                                     0.0
                                           2005   2006      2007      2008       2009          2010   2011     2012        2013          2014   2015

                                                     Fixed-telephone subscriptions                      Fixed broadband subscriptions
                                                     Mobile-cellular telephone subscriptions            Households with internet access at home
                                                     Active mobile-broadband subscriptions              Individuals using the internet

  Source: International Telecommunication Union (2017).

  3
   See Statistica. “Number of social network users worldwide from 2010 to 2012 (in billions)”. Available from
  www.statista.com/statistics/278414/number-of-worldwide-social-network-users/.

                                                                                                                                                       9
Towards improved access to broadband in Africa
accumulated 965 million SIM cards by the end of 2015. This number is projected to
reach 1.3 billion by end of 2020, given the rapid rates of increase in access and usage
(International Telecommunication Union, 2016).
Average fixed broadband penetration in Africa is below 1 per cent and is the lowest
in the world. This is far below the developing country average of 7.4 per cent and the
world average of 11.2 per cent, as shown in figure V.
While 12 countries have attained more than 1 per cent penetration in fixed broadband
subscriptions, 2 countries have more than 10 per cent penetration: Seychelles (15.7 per
cent) and Mauritius (14.3 per cent). They are the leading countries in fixed broadband
penetration on the continent (see figure VI).
Figure V: Fixed broadband subscriptions by region, 2015 (Per 100 inhabitants)
29.4 29.2
30.0
20.0 18.4
14.8
11.2
7.4 8.9
10.0
4.2
0.5
-
Developed
World
Developing
Europe
The Americas
CIS
Asia & Pacific
Arab States
Africa
Source: International Telecommunication Union (2017).
Figure VI: Fixed broadband subscriptions in selected African countries, 2015
(Per 100 inhabitants)
15.74
16.00
14.31
14.00
12.00
per 100 inhabitants
10.00
8.00
6.00 5.57 5.25 4.52
4.00 3.38
2.33
2.00 1.72
0.00
Mauritius
Seychelles
Algeria
South Africa
Egypt
Morocco
Djibouti
Namibia
Source: International Telecommunication Union (2017).
10Chapter 2: Review of the state of broadband infrastructure and services in Africa
Other countries achieved penetration rates of between 1 and 6 per cent: Algeria (5.6),
followed by South Africa (5.3), Egypt (4.5), Morocco (3.4), Djibouti (2.3) and Namibia
(1.7). This largely reflects limited access and the high price of fixed broadband access.
As shown in figure VII, mobile broadband penetration is highest in the Americas (75 per
cent), followed by Europe (73 per cent), the Commonwealth of Independent States (51
per cent), the Arab States (43 per cent), Asia and the Pacific (38 per cent) and Africa
(19 per cent). During the period 2013-2016, all regions showed double-digit growth
in mobile broadband penetration. However, in this case, Africa led with a phenomenal
growth rate of more than 40 per cent, twice as high as the global average. By end of
2015, mobile broadband penetration in Africa reached almost 20 per cent, which is a
10-fold growth from less than 2 per cent in 2010.
2.3 Backbone infrastructure and bandwidth
The numbers indicated show only the overall growth of broadband access on the
continent, but effective use can be assessed by looking at such aspects as speed and
the quality of broadband connections and services. In this regard, two aspects of
broadband infrastructure could be taken as indicators to assess the quality and speed
of broadband: backbone infrastructure and the amount of international bandwidth
available in the region and in the countries of that region.
2.3.1 International connectivity
One of the key indicators that highlights the quality and speed of networks is the
amount of international internet bandwidth available in the region as a whole and
in each country. This bandwidth is a key requirement for delivering data-intensive
applications and services using high-speed networks in the current digital society.
Figure VII: Active mobile broadband subscriptions by region, 2015 (Per 100
inhabitants)
Developing 35
World 44
Developed 87
Africa 19
Asia & Pacific 38
Arab States 43
CIS 51
Europe 73
The Americas 75
0 20 40 60 80 100
Source: International Telecommunication Union (2017).
11Towards improved access to broadband in Africa
Figure VIII: International bandwidth per Internet user by region, 2004 and 2013
(Bits per second)
180000
170000 161027
160000
150000
140000
130000
120000
110000
(bit/s per user)
100000
90000
80000
70000
60000 53992
50000 43072
40000
30000 19037 21472
20000 8074 11572
10000 221 420 1213 702 4384
0
Africa Arab States Asia & Pacific CIS The Americas Europe
2004 2013
Source: International Telecommuniocation Union (2014).
The data in figure VIII indicate that Africa’s international Internet bandwidth had
increased more than 36 times between 2004 and 2013.
This clearly shows the impact of available international bandwidth on Internet usage.
Availability differs widely between countries and regions, with Africa being the lowest,
six times lower than the world average of 52,000 bit/s per user. Europe is a global
leader, with 161,000 bit/s per user, which was almost 20 times that of Africa in 2013.
Nevertheless, with the placement of several submarine fibre optic cables on the east
and west coasts of the continent since 2012, Africa has been the fastest-growing
region n the world, with international bandwidth demand increasing 69 per cent,
compounded annually between 2009 and 2013.
Such growing traffic has direct implications in terms of the capacity requirements for
the underlying broadband infrastructure. To this end, all three network components
of this broadband infrastructure, namely, international (and regional) connectivity,
national backbone and access networks, have to be in place and optimally used to meet
the increasing demand in the most cost-effective way.
The first component of the broadband network is the international and regional
infrastructure that provides connection to the rest of the world. Until 2010, sub-
Saharan Africa had been the most underserved region in the world in terms of
international fibre capacity, in particular East Africa, which was reliant exclusively on
costly and less-reliable satellite connections.
Since the mid-2000s, the situation dramatically changed, due to the mobile phone
revolution on the continent, driving growth in both bandwidth demand and operator
revenue, on the one hand, and, on the other, the increased support from international
financial institutions and private financiers in providing lending for telecom
infrastructure projects, including the focus by submarine cable suppliers on potential
12Chapter 2: Review of the state of broadband infrastructure and services in Africa
Figure IX: Top 10 countries in Africa in terms of international Internet
bandwidth per Internet user, 2014
160,000
140,000
120,000
100,000
80,000
60,000
40,000
20,000
0
South Africa
Namibia
Mauritius
Alegeria
Seychelles
Tunisia
Kenya
Gabon
Botswana
Libya
Source: World Bank world development indicators: the information society. Available from http://wdi.worldbank.
org/table/5.12.
market opportunities in Africa. As a result, Internet bandwidth per Internet user
increased significantly in several countries (see figure IX).
Kenya is the bandwidth-richest country in Africa. Its international Internet bandwidth
per Internet user increased from 4,500 Mbit/s in 2011 to 24,000 Mbit/s in 2012,
followed, respectively, by Tunisia, South Africa, Côte d’Ivoire and Seychelles as the top
five countries. In a number of other African countries, including Botswana, Djibouti and
Ethiopia, international bandwidth per Internet user has actually decreased. This is not
because there was a reduction in the international bandwidth, but because the number
of Internet users increased faster than the amount of bandwidth available.
All of Africa’s international bandwidth is supplied by submarine cables, terrestrial
networks connected to submarine cables or satellite. Currently, of the total bandwidth
supplied to sub-Saharan Africa, 94 per cent (1.070 Tbps) was supplied directly by
submarine cable. There is great scope for future growth, given that the total bandwidth
available is still less than 5 per cent of the total design capacity of at least 28.841 Tbps
that can be made available by the more than 18 submarine cable landing stations
serving the continent as of December, 2013 (Hamilton Research, 2015). International
bandwidth was expected to exceed 50 Tbps by the end of 2014, which was the capacity
estimated to meet the needs of Governments, households and business users for the
medium term (African Development Bank, 2013).
2.3.2. Backbone network infrastructure
The second component is the domestic backbone network (including backhaul)
infrastructure that carries traffic from the international landing point or from the
nearest point of the border in a landlocked country to the various parts of the country.
While microwave and satellite transmissions account for a steadily decreasing amount,
an increasing and majority share of data traffic is transferred nationally through
13Towards improved access to broadband in Africa terrestrial fibre. As a result, there has been an increase in backbone infrastructure, with the regional network (terrestrial transmission networks across Africa) increasing to 958,901 route km by June 2014, compared with 465,659 km in 2009. There was also a plan to deploy a further 92,402 km of fibre optic network under construction, with a further 86,045 km planned and 70,573 km proposed. Currently, approxiamtely 44 per cent of the African population is within reach of fibre networks, of which 22 per cent live within a range of 10 km. Once the planned and proposed networks enter into service, the reach will increase to 52.3 per cent of the population (African Development Bank, 2013). Given the dynamic growth of mobile broadband in Africa, the key requirement in servicing the growing demand is to supply sufficient national fibre capacity for the backbone, including backhaul connectivity to base stations, which are currently mostly using microwave radio links on networks designed for the second generation of mobile telecommunications technology (2G). This is important for accommodating and handling the growing amount of traffic on the backbone level of the network. Otherwise, operators will not be able to expand their retail offerings and increase the speed of broadband connections in the access network infrastructure serving end users. Apart from connecting more cities, these terrestrial backhaul networks are also delivering much greater bandwidth to those countries that do not have their own submarine cable landing points. A landlocked country, Zimbabwe, increased its international bandwidth to 9.060 through connection to submarine cables for its supply, facilitated by Botswana, Mozambique, Namibia and South Africa. Ethiopia reached 8.686 Gbps in 2013 and is connected to submarine cables through Djibouti, Kenya and the Sudan. Rwanda reached 4.997 Gbps, backhauled through Kenya, Uganda and the United Republic of Tanzania, while Botswana reached 3 Gbps, backhauled through Namibia and South Africa (African Development Bank, 2013). Therefore, there is great scope and opportunity for countries to expand their user base. 2.3.3 Access network infrastructure The third network component, the access network infrastructure, is the one that links the backbone network to the end user. At this point, two main groups of “last mile” broadband access technologies are available: fixed broadband technologies and mobile broadband technologies (see annex I). While it is important to note that broadband access network technologies are strongly determined by network deployment and technical and financial constraints, the deployment of specific technologies tends to follow commercial viability, in that fixed broadband technologies are more prevalent in highly populated areas (in conjunction with the rapid development of complementary mobile broadband access), while mobile broadband solutions are more prevalent in less densely populated areas. The quality and speed of broadband connections also differ between mobile and fixed technologies. With technological evolution, mobile technologies are improving high-speed broadband access. While 3G networks are continuing to be built and 14
Chapter 2: Review of the state of broadband infrastructure and services in Africa

expanded throughout the continent, several countries have made significant increases
in penetration. Botswana is leading, with 74 per cent, followed by Cabo Verde, which
attained the second-highest penetration in the region, at 43 per cent. Burkina Faso,
having launched 3G in 2013, reached a penetration of 9 per cent by end of the same
year. Globally, 2012 was considered to be the year of rapid 4G adoption, with 49
countries procuring at least one commercial 4G LTE network.

Mobile devices, either 3G or 2.5G EDGE networks, are already the main platform for
Internet access in Africa, allowing people to bypass the limited reach of fixed broadband
networks. By the end of 2014 (oAfrica, 2012), 24 African countries had 4G service.

Figure X: 3G and 4G networks by deployment by region, 2012
            60
Countries

            0
                 Western    Central and        North         Developed         Emerging      Middle East and   Latin America    Sub-Saharan
                 Europe    Eastern Europe     America        Asia-Pacific     Asia-Pacific    North Africa     and Caribbean       Africa

                                               Total Countries        Countries with 3G Networks          Countries with 4G Networks

Source: Internet Society, 2014.

Figure XI: Deployment of mobile networks in 53 African
countries, 2014 (Per cent)

                                        13%
                                                                               Countries with 2G
                                                                               Countries with 3G
                                                    13%
                     45%                                                       Countries with 4G LTE
                                                                               Countries with 2G, 3G, 4G LTE

                                            29%

Source: International Telecommunications Union (2014).

                                                                                                                                       15
Towards improved access to broadband in Africa
In mid-2016, there were 72 4G LTE services in 32 countries in Africa. In 2017, 102
mobile operators have launched 4G LTE services in 43 countries.4
In practice, there are concerns over 4G LTE services. On one hand, there is the issue
of whether the potential speed and affordability of 4G can be realized in the years
to come. On the other hand, the speed offered in most markets is well below what is
possible with broadband coverage. Lastly, most devices in Africa are still only capable
of 2G or 3G, and users need a 4G-enabled device to utilize the high transfer speeds.
2.4 Facilitating universal access: the role of public ICT
access points
As indicated above, Africa hosts only 11 per cent of households with Internet access.
Ultimately, as can be seen in the various goals of the broadband plans presented in
chapter three, the policy for universal access to broadband Internet is to ensure that
every household has access. Household access is mostly a shared access whereby all
family members can use the service and share the subscription fees. The challenge is both
availability and affordability. In view of these issues and the low level of household Internet
access, public access points to the Internet, in particular, play a great role in Africa.
Public access to ICT can be provided by commercial facilities, such as privately operated
Internet cafes, and community-type facilities, which typically provide Internet access
free of charge. Schools, post offices and public libraries also play an important role in
providing access to broadband. For example, globally, only 10 per cent of post offices
provide public access to the Internet, even though 31 per cent of them had a broadband
Internet connection in 2012.
According to the Universal Postal Union, increasing the proportion of post offices
offering public Internet access to more than 45 per cent would ensure that up to a third
of all rural areas and small towns have access to the Internet, while, with 60 per cent
coverage, half of all rural areas could be connected (International Telecommunication
Union, 2014a).
To this end, African countries need to encourage the development of public ICT
access points both in urban and rural areas to ensure widespread adoption and use of
broadband.
2.5 Investment expenditure on broadband
infrastructure in Africa
Backbone networks have a major impact on the delivery of ICT services in a country.
In a typical mobile voice network, the backbone network accounts for approximately
10-15 per cent of total network cost. GSMA (2013), reported that mobile operators
throughout the region had invested an estimated $44 billion between 2007 and
4
See Balancing Act, “4G/LTE in Africa: number of subscribers, launches, trends and projects (May 2017)”
(July 2017). Available from www.balancingact-africa.com/reports/telecoms-internet/4glte-network-pro-
jects-and-launches-in-africa-july-2017.
16You can also read