Brief Analysis of Sustainable Water Infrastructure and Water Technologies - In Florida and Wisconsin 2018 - GACC South
←
→
Page content transcription
If your browser does not render page correctly, please read the page content below
Brief Analysis of Sustainable
Water Infrastructure and
Water Technologies
In Florida and Wisconsin 2018
Imprint
    Publisher
    German American Chamber of Commerce of the Southern U.S., Inc.
    1170 Howell Mill Road, Suite 300
    Atlanta, GA 30318
    Phone: +1 404 586 6837
    Fax: +1 404 586 6824
    Email: info@gaccsouth.com
    Web: www.gaccsouth.com

    German American Chamber of Commerce® of the Midwest, Inc.
    321 North Clark Street, Suite 1425
    Chicago, IL 60654
    Phone: + 1 (312) 644-2662
    Fax: +1 (312) 644-0738
    Email: info@gaccmidwest.org
    Web: www.gaccmidwest.org

    Date
    30.01.2018

    Photo Credit
    pixabay.com

    Contact
    Michaela Schobert
    Director, Consulting Services
    mschobert@gaccsouth.com

    Corinna Jess
    Director, Consulting Services & Trade Missions
    jess@gaccmidwest.org

    Authors
    AHK USA – Atlanta
    AHK USA – Chicago

1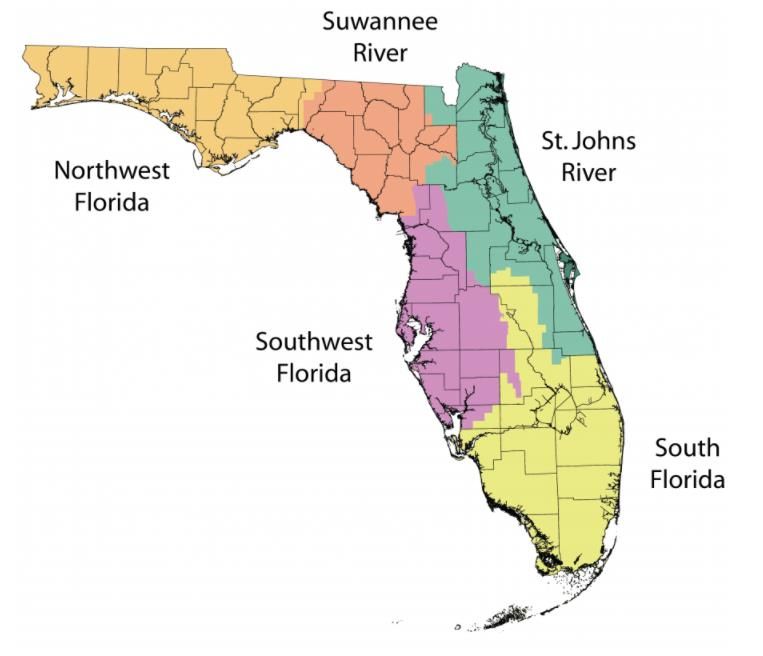
Table of Content
Table of Content ..................................................................................................................................................................................... 2

I. List of Figures ................................................................................................................................................................................... 4

II. List of Tables ..................................................................................................................................................................................... 5

III. List of Abbreviations ........................................................................................................................................................................ 6

IV. Unit Conversion ................................................................................................................................................................................ 8

1. Project Introduction ........................................................................................................................................................................... 9

    1.1 Project description ........................................................................................................................................................................ 9

    1.2 Project Goals................................................................................................................................................................................. 9

2. General Country Overview of the United States of America ........................................................................................................ 11

    2.1 State Profile: Florida ................................................................................................................................................................... 12

    2.2 State Profile: Wisconsin ............................................................................................................................................................. 14

3. Market situation ............................................................................................................................................................................... 16

    3.1 Water Infrastructure ...................................................................................................................................................................... 16
       3.1.1 Water Supply ......................................................................................................................................................................... 17
       3.1.2 Water Distribution ................................................................................................................................................................. 17
       3.1.3 Water recycling / Water reclamation ..................................................................................................................................... 18
       3.1.4 Outlook .................................................................................................................................................................................. 19

    3.2 Challenges .................................................................................................................................................................................... 19
       3.2.1 Aging Water Infrastructure .................................................................................................................................................... 20
       3.2.2 Contamination ....................................................................................................................................................................... 21
       3.2.3 Urbanization and Agriculture ................................................................................................................................................ 21

    3.3 Regulatory Environment ............................................................................................................................................................... 25

    3.4 Financing Opportunities ............................................................................................................................................................... 30

    3.5 Trends and Market Opportunities ................................................................................................................................................. 36

    3.6 Current and Future Projects .......................................................................................................................................................... 39

    3.7 SWOT Analysis .......................................................................................................................................................................... 42

4. Contacts in the U.S. ........................................................................................................................................................................ 43

    4.1 Government Agencies – National Level ....................................................................................................................................... 43

2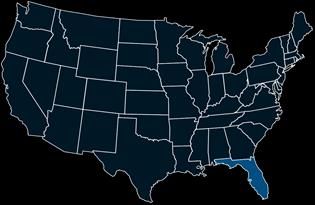
4.2 Government Agencies – Florida ................................................................................................................................................... 43

    4.3 Government Agencies – Wisconsin.............................................................................................................................................. 47

    4.4 Organizations and Associations – National Level ........................................................................................................................ 48

    4.5 Organizations, Associations and Institutes – Florida .................................................................................................................... 50

    4.6 Organizations, Associations and Institutes – Wisconsin............................................................................................................... 54

5. Conclusion ....................................................................................................................................................................................... 55

6. Preparation for Workshop............................................................................................................................................................. 56

7. List of Sources ................................................................................................................................................................................. 57

3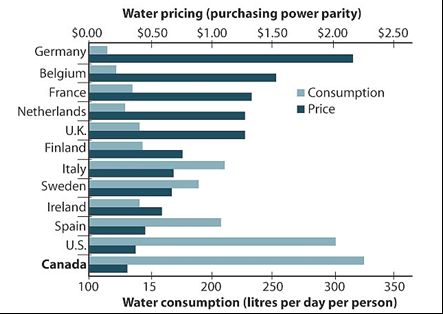
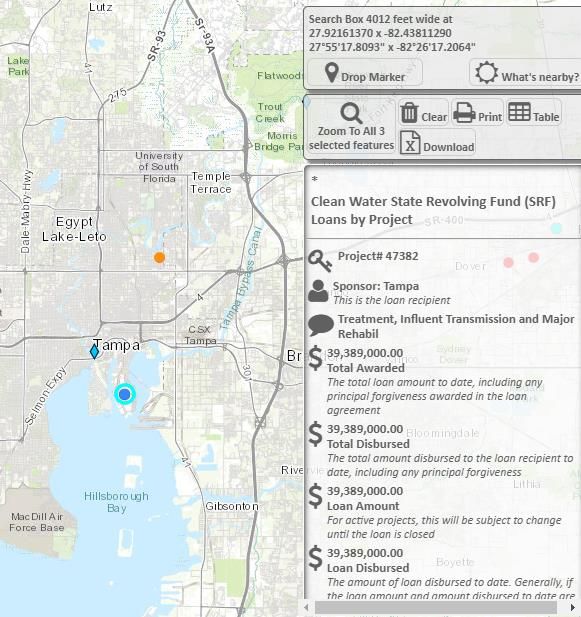
I. List of Figures
Figure 1: Economic Overview of the United States of America ................................................................................................ 11
Figure 2: Geographical Location of Florida ............................................................................................................................... 12
Figure 3: Overview of the State of Florida ................................................................................................................................. 12
Figure 4: Geographical Location of Wisconsin .......................................................................................................................... 14
Figure 5: Overview of the State of Wisconsin ............................................................................................................................ 14
Figure 6: Ratio of the number of water systems in Wisconsin to the number of population served..................................... 23
Figure 7: Water withdrawal in Wisconsin’s agriculture in 2015 .............................................................................................. 24
Figure 8: Wisconsin Department of Natural Resources: Service/Satellite Center Locations by Region .............................. 26
Figure 9: Overview of Florida's five Water Management Districts ......................................................................................... 30
Figure 10: Wisconsin Funding per Program by Biennium ...................................................................................................... 32
Figure 11: Map of State Revolving Fund Loans by Projects in Florida .................................................................................... 33
Figure 12: Project overview of Clean Water State Revolving Fund (SRF) Loans Project in Tampa, FL ................................ 34
Figure 13: Water Pricing in Relation to Water Consumption ...................................................................................................37
Figure 14: Area-Wide Optimization Programs May 2014 ........................................................................................................ 40

4
II. List of Tables
Table 1: Gross domestic product (GDP) and unemployment rates in Florida between 2009 and 2016 ................................ 12
Table 2: Occupational Employment Statistics and Wage in Florida in the water and wastewater treatment industry, May
2016 ............................................................................................................................................................................................. 12
Table 3: Overview of EPA drinking water regulations ............................................................................................................. 25
Table 4: Sections overview of Florida Administrative Code addressing water quality standards ......................................... 25
Table 5: Sections of Florida Statute (F.S.) addressing water quality standards ..................................................................... 26
Table 6: State Standards in Effect for CWA Purposes in Wisconsin ........................................................................................27
Table 7: Sections of Florida Statute (F.S.) addressing water quality standards ..................................................................... 29

5
III. List of Abbreviations
     ASCE     American Society of Civil Engineers
     AWOP     Area-Wide Optimization Program
     AWT      Association of Water Technologies
     AWWA     American Water Works Association
     BMUB     German Federal Ministry for the Environment, Nature Conservation, Building and
              Nuclear Safety
     CFWI     Central Florida Water Initiative
     CWA      Clean Water Act
     CWSRF    Clean Water State Revolving Fund
     DEP      Florida Department of Environmental Protection
     DNR      Department of Natural Resources
     DNS      Department of Neighborhood Services
     e.g.     exempli gratia
     est.     estimate
     EAA      Everglades Agricultural Area
     EPA      United States Environmental Protection Agency
     FDEP     Florida Department of Environmental Protection
     FDOH     Florida Department of Health
     FDOT     Florida Department of Transportation
     FDOT     Florida Department of Transportation
     ANSI     American National Standards Institute
     FGWA     Florida Ground Water Association
     FOWA     Florida Onsite Wastewater Association
     FRWA     Florida Rural Water Association
     FSAWWA   Florida Section of the American Water Works Association
     FWEA     Florida Water Environment Association
     FWPCOA   Florida Water and Pollution Control Operators Association
     GACC     German American Chamber of Commerce
     GDP      Gross Domestic Product
     i.e.     That is
     IPWA     International Private Water Association
     km2      Square kilometer
     MDWASD   Miami-Dade Water and Sewer Department
     Mgal/d   Million gallons per day
     MMSD     Milwaukee Metropolitan Sewage District
     MWW      Milwaukee Water Works
     NPDES    National Pollutant Discharge Elimination System Standards
     OSTDS    Onsite sewage treatment and disposal systems
     PWRA     Provision of Water Restoration
     PWS      Public Water Systems
     SCADA    Supervisory Control and Date Acquisition
     SDWA     Safe Drinking Water Act
     SJRWMD   St. Johns River Water Management District
     SRF      State Revolving Funds
     sq mi    Square mile
     SSAC     Site Specific Alternative Criteria
     U.S.     United States
     USA      United States of America

 6
USD US-Dollar
USGS United States Geological Survey
WIFIA Water Infrastructure Finance and Innovation Act
PCI Per Capita Income
R&D Research & Development
RTU Remote Terminal Units
NFRWSP North Florida Regional Water Supply Partnership
WIFIA Water Infrastructure Finance and Innovation Act Program
WRWA Wisconsin Rural Water Association
WTP Water Treatment Plant
SSO Sanitary Sewer Overflows
7IV. Unit Conversion Power units: 1000 Watt = 1 kW 1000 kW = 1 MW 1000 MW = 1 GW Liquid volumes: 1 US gal. = 3,785 Liter (l) 1 l = 0,264 gal 1 Cubic m (1 m3) = 1000 liters Lenghts and distance: 1 inch (1" U.S.) = 2.54 cm 1 foot (1' U.S.) = 12 inches = 30 cm 1 yard (1 yd) = 3 feet = 90 cm Surface areas: 1 square inch (in2) = 6.5 square centimeters (cm2) 1 square meter (m2) = 11 square feet 1 hectare (ha) = 10,000 m2 = 2.5 acres 1 square kilometer (km2) = 100 ha = 0.4 square miles. Weight: 1kg = 2.2 pounds 1 ounce (1 oz) = 28.35 grams 1 pound (1 lb) = 16 ounces = 454 grams Temperatures: 0°Fahrenheit (F) = -18° Celsius (C) 0° C = 32° F Currency Conversion: 1 USD = 0.80440 Euro 1 Euro = 1.24300 USD1 1 https://www.oanda.com/currency/converter/, retrieved on 01/26/18 8
1. Project Introduction
1.1 Project description
In preparation for the Export Initiative Environmental Technology / "Environmental Protection - Made in Germany" of
the German Federal Ministry for the Environment, Nature Conservation, Building and Nuclear Safety (BMUB), the
project called "German American Dialogue for Sustainable Water Infrastructure & Technologies" was created to examine
the U.S. American Water Infrastructure and opportunities for future collaboration between American and German
companies were identified. This is a joint project of the GACC South in cooperation with the GACC Midwest.
Through the application of strict requirements to environmental protection, sustainability and efficiency, Germany has
taken a leading role in the area of water infrastructure. By the mid 1980’s, Germany had already begun developing
sustainable measures and activities for the improvement of water quality after rapid industrialization resulted in a
significant deteroriation of the water quality. As of today, the quality of European drinking water is unique, with the
quality of surface water being exceptionally good. The rate of non-revenue water in Germany is one of the lowest across
Europe and since 1990, more than 110 billion Euros have been invested in the industry. The German water industry
excels in the supply and disposal, the provision of quality drinking water and the sustainable handling of resources.
The vast majority of the U.S. American water infrastructure (urban drinking water and sewage systems, drinking water
treatment, wastewater treatment plants, etc.) was built more than 50 to 100 years ago. Due to years of lacking financial
investments and environmental pollution by industrial processes, American drinking water and wastewater systems are
oftentimes in poor condition. It is estimated that every year, approximately 240,000 main pipeline breaks in the U.S.,
which accounts for a loss of about 14-18% of all treated water. It will require around $ 1 trillion in investments over the
next 25 years to maintain and / or expand water systems. Based on various interviews with U.S. water experts, this
analysis probes the causes of the outlined problems above and researches potential solutions.
The urgency of these issues and the potential for action and collaboration inspired German American Chambers of
Commerce in Atlanta and Chicago to tackle the challenges facing the water sector as part of their mission to promote and
support trade and investment between the U.S. and Germany. Given that Germany and the U.S. are two of the most
innovative countries globally when it comes to water technologies, and Germany is well-known for its best practice
technologies in the sustainability field, the German American Chamber of Commerce in Atlanta and Chicago saw it as an
opportunity to connect U.S. and German stakeholders to foster a sustainable knowledge exchange on a professional level.
This project gives U.S. decision makers the opportunity to engage in a bilateral dialogue with German organizations and
companies.
1.2 Project Goals
The goal of the „German American Dialogue for Sustainable Water Infrastructure and Technologies” is to support
communities in Florida and Wisconsin in order to develop a strategic plan for the sustainable modernization of the water
infrastructure.
Stakeholders of the German water industry have the necessary know-how to modernize the water infrastructure in a
sustainable fashion and consequently are valuable partners to support American municipalities to reach the common
goals of sustainability and safety in the water industry.
In general, there are two areas of expertise in which Germany has taken on a leading role and which are gradually gaining
importance in the U.S.:
Stricter environmental control, as well as sustainability and efficiency requirements
Needed updates to largely outdated water infrastructure systems
9There is a particular potential in the following areas of U.S. water management: water recycling, water quality tests (body of waters), safety in the drinking water supply, reducing energy consumption or energy recovery in the treatment as well as micro irrigation in agriculture. 10
2. General Country Overview of the United States of
America
The area size of the U.S. equals 9,833,517 sq. km, which is about half the size of Russia and more than twice the size of the
European Union. The United States of America is the second largest democracy in the world by size of electorate with
India being the largest one.

The U.S. has a per capita GDP of 57,600 USD and has the most technologically powerful economy in the world. U.S.
companies are among the world technological leaders responsible for advances such as computers, pharmaceuticals and
medical devices, aerospace and military equipment. In terms of purchasing power parity, the U.S. has had the second
largest global economy since 2014, with China being the largest. In addition, the country has a highly developed service
sector, comprising of 80.2% of the nation’s GDP. Additional prominent sectors include the Agricultural sector, which
generated 0.9% and the industry sector generated 18.9% of the nation’s GDP in 2017.2

Figure 1: Economic Overview of the United States of America

     Population: 325,5 Million (2017)
     Capital: Washington, D.C.
     Correspondence Language: English, Spanish
     GDP: 18.62 trillion (2016 est.)
     GDP per Capita: 57,600 (2016 est.)
     Unemployment Rate: 4.9% (2016 est.)
     Public debt: 76.5% of GDP (2016 est.)
     Gross national savings: 18% of GDP (2016 est.)
     Total Imports: $2,208 billion (2016 est.)
     Imports from Germany: $ 114.1 billion (2016)
     Total Exports: $1,456 billion (2016 est.)
     Exports to Germany: $ 49.4 billion (2016)

Source: Central Intelligence Agency (2017): The World Factbook, accessed on 12/20/2017 and United States Census Bureau (2017): Foreign Trade, accessed on 12/20/2017

2   Central Intelligence Agency (2017): The World Factbook, accessed on 12/20/2017

11
2.1 State Profile: Florida
Figure 2: Geographical Location of Florida
The State of Florida is the most southeastern state of the United States of America, which borders the Gulf of Mexico on
its west coast and to the Atlantic Ocean on its east coast. On a national level, Florida has one of the largest populations
due to its mild climate and various coastal beaches, which also make it an ideal destination for tourists and retirees.
Additionally to its strong tourism, Florida also accounts for approximately half of the U.S. American production of
lemons.3
Figure 3: Overview of the State of Florida
Population: 20.612. 439 (July 2016, est.)
Area: 170.304 km2 / 65,7 sq mi
State capital: Tallahassee
Source: Based on United States Census: Quick Facts Florida, accessed on 12/18/2017
Table 1: Gross domestic product (GDP) and unemployment rates in Florida between 2009 and 2016
Indicator 2009 2010 2011 2012 2013 2014 2015 2016
GDP in current dollars (in billion USD) 721,76 735,1 741,46 764,14 794,64 833,97 888,83 926,05
Real economic growth (in %) -5,5 0,8 -0,6 0,8 2,1 2,8 3,9 2,4
Unemployment rates (in %) 10,53 10,90 9,80 8,35 7,09 6,18 5,33 4,92
Source: Based on U.S. Department of Commerce – Bureau of Economic Analysis (2015): Regional Economic Accounts, accessed on 12/01/2017 and United States Department of Labor -
Bureau of Labor Statistics (2017): Local Area Unemployment Statistics, accessed on 12/01/2017
Table 2: Occupational Employment Statistics and Wage in Florida in the water and wastewater treatment
industry, May 2016
Occupation Employment per 1,000 jobs Hourly mean wage Annual mean wage
5,800 0.705 22.72 USD 47,250 USD
Source: Based on US Bureau of Labor Statistics (2017): State Occupational Employment and Wage Estimates Florida, accessed on 12/05/2017
3 U.S. Energy Information Administration (2017): Florida – Data, accessed on 12/01/2017
12Industry Clusters in Florida There are over 19,000 manufacturers in Florida that employ approximately 331,000 workers in diverse manufacturing industries with a wide production range from plastics and tortillas, to motor vehicles. One sector that differentiates Florida from other U.S. states is the Clean Tech industry with industry innovators such as Mitsubishi Power Systems Americas and Siemens Energy, who play a key role in the state’s Clean Tech technologies by combining economy with sustainability. Other economic strengths of Florida include energy, efficiency, and environmental technologies, which can be seen in the high number of producers of power generation systems, solar technology companies, biofuel producers, and battery and fuel cell manufacturers. Furthermore, Florida is home to specialized companies in the production of water testing, desalination and remediation technologies resulting in strong environmental monitoring, compliance and remediation sectors in the state.4, 5Florida Enterprise, a principal economic development organization for Florida, provides an interactive map that gives further insights into Florida’s key industries and the location of industry clusters within Florida that were mentioned above. According to this map, industry clusters in close proximity to the City of Tampa and the City of Miami are highly developed.6 Florida has a diverse portfolio of industry clusters such as Life Sciences, Manufacturing, and Clean Tech, which directly influences water usage and water quality in Florida. Regarding Life Sciences, Florida has established itself as a true hub and is home to more than 1,100 biotech, pharmaceutical and medical device companies. More precisely, there are 260 biotech companies and R&D institutes and more than 220 pharmaceutical and medicine manufacturing companies in the state, comprising of 14% of the biotech and 22% of the pharmaceutical manufacturing workforce nationally. Within Florida, the City of Tampa and Hillsborough County are clusters for Life Sciences and Health Care industries and employ more than 62,100 workers. Water Industry Clusters According to Enterprise Florida, Florida companies are at the forefront of the latest water testing, desalination and remediation technologies. The environmental monitoring, compliance and remediation sector is also strongly represented in Florida. A look at Florida’s Cleantech Cluster Map reveals that companies in the environmental sector are mainly located on the state’s coastlines.7 In recognition of the importance of water issues and the need to address them in a new interdisciplinary manner, the University of Florida (UF) established a campus-wide interdisciplinary Water Institute in May 2006. The Water Institute develops engineering, policy, and legal solutions in Florida, providing a model, both nationally and internationally. Furthermore, the institute is committed to addressing Florida’s issues while being recognized for providing solutions, science, and education for national and global water resource problems8. 4 Enterprise Florida (2018): Industry Overview, accessed on 01/08/2017 5 Tampa Hillsborough Economic Development Corporation (2018): Life Sciences & Health Care, accessed on 01/08/2018 6 Enterprise Florida (2018): Maps, accessed on 01/08/2018 7 Enterprise Florida: Cleantech: Water Air & Environment, accessed on 01/26/2018 8 University of Florida: Water Institute, accessed on 01/26/2018 13
2.2          State Profile: Wisconsin

The State of Wisconsin is located in the north central region of the United States in the heartland of the Midwest and is
second to Michigan in the Great Lakes coastline. Agriculturally, Wisconsin is a major producer of dairy products;
producing the largest quantities of cheese of any U.S. state.

Figure 4: Geographical Location of Wisconsin

Figure 5: Overview of the State of Wisconsin

     Population: 5,795,483 (July 2016, est.)
     Area: 170.304 km2 / 54,157.80 sq mi
     State capital: Madison
Source: United States Census Bureau (2017): Quick Facts Wisconsin, accessed on 01/08/2018

Table 4: Gross domestic product (GDP) and unemployment rates in Wisconsin between 2009 and 2016
     Indicator                                          2009            2010           2011         2012            2013            2014          2015            2016
     GDP in current dollars (in million USD)            245             252,88         262,46       272,42          281,57          291,40        304,66          313,09

     Real economic growth (in %)                        -2,7            2,2            2,1          1,0             1,0             1,0           1,0             1,0

     Unemployment rates (in %)                          9,00            8,40           7,80         7,10            6,60            5,30          4,50            4,20
Source: Based on U.S. Department of Commerce – Bureau of Economic Analysis (2015): Regional Economic Accounts, accessed on 01/11/2018 and United States Department of Labor -

Bureau of Labor Statistics (2017): Local Area Unemployment Statistics, accessed on 01/11/2018

Table 5: Occupational Employment Statistics and Wage in Wisconsin in the water and wastewater
treatment industry, May 2016
     Occupation                                Employment per 1,000 jobs                     Hourly mean wage                         Annual mean wage
     2,480                                     0.884                                         22.80 USD                                47,420 USD

Source: Based on US Bureau of Labor Statistics (2017): State Occupational Employment and Wage Estimates Florida, accessed on 12/05/2017

Water Industry Clusters

84% of the drinking water available in North America comes from the Great Lakes, which is why the Midwest region plays
such an important role in the water industry. Consequently, the Midwest is a hub of water clusters with know-how centers
in Minneapolis-St. Paul, Minnesota, the Confluence Water Technology Innovation Cluster in Cincinnati, Ohio, the Water
Council in Milwaukee, Wisconsin (WI), and the Blue Tech Alliance in Chicago, Illinois. According to the American Society
of Civil Engineers (ASCE), new technologies and infrastructure solutions are in high demand. Industries located in the
region with higher water consumption, such as food, agriculture and paper industries, are particularly faced with the
challenge of using more sustainable and efficient systems and technologies for water supply and wastewater treatment.

14
The Water Council, located in Milwaukee, WI, is the leading U.S. cluster for water. As a result of being situated next to the largest source of freshwater in the U.S. (totally 84%), it stands not only as a national innovator in the field of water provisioning and waste water management, but also as an international center for connecting informational resources. Comprising of 11 global partners, 170 Water Council members and almost 200 affiliated businesses in water technology, making it Wisconsin’s main water industry cluster with a truely global reach. As a result of the region’s significant water cluster, various stakeholders and major players in Wisconsin’s water industry came together to tackle current water industry issues and founded the Global Water Center in 2013. The center is a 98,000 square feet (9104.5 square meter) facility offering research space for universities, existing companies and an accelerator space for new, emerging water technology companies. Interested parties from all over the world come to Milwaukee to use the space and expand their network.9 9 The Water Council: About us, accessed 01/11/2018 15
3. Market situation
Across the United States, there is a general trend of deteriorating water infrastructure that was largely constructed 50 to
150 years ago and consists of more than water mains and the distribution system, but also recycling and treatment
facilities, as well as the natural water resources.

The effect of the aging water infrastructure far extends public usage, as U.S. businesses rely directly or indirectly on the
aging and outdated technology with operations being greatly impacted through utility service interruptions, polluted
drinking water, and higher water bills. Currently, as reported by the American Society of Civil Engineers (ASCE) in 2017,
the American drinking water infrastructure network is equivalent to a grade "D". However, water infrastructure
conditions across the United States vary greatly from state to state and even city to city. This paper will examine two
distinct regions within the United States, Florida and Wisconsin, whose current infrastructure and immediate needs vary
significantly, yet both states face similar problems in obtaining and maintaining needed technology.

3.1 Water Infrastructure

Providing safe drinking water for the country is a cooperative effort between public water systems, federal and local
government agencies, consumers and many more. As stated in the federal Safe Drinking Water Act (SDWA) every state
must test their public water system to meet minimum outline drinking water standards set by the United States
Environment Protection Agency (EPA) and report all yearly violations. EPA is a federal agency of the U.S. and serves the
purpose of protecting human health and the environment by writing and enforcing relevant regulations in these fields
based on laws that have been passed by Congress.10

In 2016, the American Society of Civil Engineers (ASCE) created a Report Card for Florida, which evaluated and analyzed
the condition and management of Florida’s drinking water infrastructure utilizing quantitative and qualitative evaluation
methods. According to the results, Florida’s utilities are safe and resilient, and provide relatively high level of service.
However, Florida’s drinking water infrastructure was rated with a C+(with an A being the best and a D being the worst
grade). The lowest score were in the categories “asset management” and “condition of infrastructure” and were lower due
to a significantly higher number of utilities that inspect less than 20% of their distribution system annually for leaks.
Infrastructure scores were also relatively low as a result of outdated utilities, sometimes older than 30 years, which
require high levels of maintenance and also due to a high number of unplanned annual service disruptions. 11

In contrast, 99% of the public water systems in Wisconsin met EPA requirements, high above the national average.
However, roughly 76 systems monitored higher contaminations, including bacteria, nitrate arsenic and radioactive
chemicals such as radium and uranium. A bigger problem than violations of contaminant levels were public notice
regulations, as 15% of all water systems that experienced nitrate and bacteria contaminations failed to announce it
publicly. Even though they are ahead of other states and cities across the United States, the American Society of Civil
Engineers estimates that the state of Wisconsin will need about $1 billion over the next 20 years to rehabilitate domestic
clean water infrastructure. Another $6.33 billion is needed to repair the wastewater system and restore them to proper
working conditions.12 A failure in updating the infrastructure will result in a danger to public health, higher legal exposure
costs and business losses.

10 United States Environmental Protection Agency (2018): About EPA, accessed on 1/18/2018
11 American Society of Civil Engineers (2016): 2016 Report Card for Florida’s Infrastructure, accessed on 12/12/2017
12 American Society of Civil Engineers (2017): Infrastructure Report Card for Wisconsin, accessed on 12/10/2017

16
3.1.1 Water Supply

Both surface and ground waters are part of an interconnected and complex natural system, which remains indispensable
to the nation’s water infrastructure. Each state within the nation faces varying water resource challenges based on their
unique geography, which has a direct impact on the water infrastructure of the state.

Florida is surrounded by the ocean and has vast amounts of water resources including 33 first-magnitude springs. In
terms of surface water, there are approximately 10,000 miles (16,000 km) of rivers and streams, and approximately
7,800 lakes within Florida. Despite half of the state’s original wetlands being drained for development in previous years,
the state still has diverse surface water resources, especially in its southwest region, including the Florida Everglades and
Big Cypress Swamp. Additionally, Florida is estimated to have 1 quadrillion gallons of groundwater available through its
aquifers. 13

In comparison to Florida, Wisconsin’s main water resource is Lake Michigan where the Milwaukee Water Works operate
two water treatment plants to provide around 1 million residents in the Milwaukee, Ozaukee, and Wauhesha Counties
with fresh water.14 Both plants, Linnwood Water Treatment Plant and the Howard Avenue Water Treatment Plant have
received $508 million to improve their overall infrastructure including state-of-the-art filters, particle monitors, and
ozone disinfection and have a combined capacity of 380 million gallons per day.15 After being purified, Lake Michigan
water flows into large underground clear wells at the water treatment plants that temporarily hold the water before it is
pumped into the distribution system. The Milwaukee Water Works also partners with a variety of agencies to promote the
health of their watershed.

3.1.2 Water Distribution

Across the nation, drinking water distribution systems consist of various interconnected components, such as pipes,
storage facilities and components that convey drinking water, providing uninterrupted supply of pressurized safe
drinking water to all consumers with drinking water distribution systems accounting for the vast majority of the physical
infrastructure. As development occurs, new pipes added to the existing grid result in a wide variation in pipe size,
materials and methods used and deterioration resulting from corrosion, materials erosion and external pressures.

In Florida alone, there are 5,275 active public and private drinking water treatment systems providing an estimated
population of 20.2 million inhabitants with drinking water. At this point, agriculture and water supply account for the
largest portion of freshwater usage in the state (roughly 39% each). Freshwater usage for commercial/ institutional/
industrial purposes, domestic and small public supply (3%) and power generation (3%) are other significant contributors
to the overall freshwater usage in Florida.16

Looking at Wisconsin, Milwaukee’s distribution system includes over 200 miles of water mains that carry over 100
million gallons of treated water every day to 865,000 residents in 16 communities in Milwaukee, Ozaukee and Waukesha
Counties.17 The larger diameter water mains range in diameter from 20 to 84 inches, with smaller mains ranging from 4
to 16 inches in diameter and range in age from 1873 to present day. The mains primarily carry water from the three major
pumping stations to smaller mains and then to seven booster stations that regulate water pressure. The pumping and
booster stations also pump water into storage facilities such as two elevated storage tanks and four ground level tanks for
additional supply during periods of increased water demand.18 The Milwaukee Water Works uses sustainable practices
such as supply-side conservation, water accountability, energy conservation, operational efficiency and consumer
advocacy for preventing water waste. These actions aim to ensure the long-term availability of safe and affordable
drinking water, while considering the other uses and priorities for water in the area.

13 United States Geological Survey: Florida’s Water Resources, accessed on 12/05/2017
14 Wisconsin Department of Natural Resources Bureau of Drinking Water and Groundwater (2003): Water Assessment for Milwaukee Waterworks,
accessed on 12/10/2017
15 Milwaukee Water Works (2014): Milwaukee Water Works Today, accessed on 12/20/2017
16 American Society of Civil Engineers (2016): 2016 Report Card for Florida’s Infrastructure, accessed on 12/05/2017
17 City of Milwaukee: About the Milwaukee Water Works, accessed 12/20/2017
18 Milwaukee Water Works: Water Mains: Replacement and Repair, accessed 12/20/2017

17
3.1.3 Water recycling / Water reclamation

In Florida, there is continuously growing demand for fresh water and wastewater removal systems. Wastewater treatment
systems in the state treat 2.7 billion gallons of wastewater per day, with 1.5 billion gallons per day being reclaimed water.
The State of Florida is a national leader in terms of efficiently reusing reclaimed water for beneficial purposes and in
2015, 44% of reclaimed water could be utilized for beneficial purposes.

Highighting the importance of water reclamation in Florida, the The South Florida Water Management District
(SFWMD) Governing Board declared May 14-20, 2017 as Water Reuse Week in Florida. The resolution urges local
governments, utilities and businesses to implement water reuse programs to help protect future water supply of 8.1
million South Florida residents. The SFWMD Governing Board continues to partner with utilities to expand their water
reuse capabilities. 19

Currently, there are more than 3,800 wastewater treatment facilities in Florida, which serve about 2/3 of the population
and have a capacity greater than 1 million gallons per day account for approx. 2% of the total permitted domestic
wastewater treatment capacity in the state.20 The remaining population relies on onsite sewage treatment and disposal
systems (OSTDS) or more commonly known as septic systems and when designed, installed and maintained properly,
these systems help to protect Florida’s precious water supplies. 21

Independent from the wastewater systems, the state’s storm water systems primarily capture rain water which is then
transported for cleaning or release via drainage pipes, storm water ponds and runoff treatment devices. With
approximately 1 in every 3 localities introducing storm water programs, there is in total, 165 local storm water systems,
serving 116,665 people per system. The storm water system in Florida requires significant capital improvements,
estimated at to $ 1 billion through 2019 with only 1 in 4 utilities expressing adequate funds from usage fees meeting the
most recent needs.

In Wisconsin, Milwaukee Metropolitan Sewage District (MMSD) is the regional government agency that provides water
reclamation and flood management services for about 1.1 million people in 28 communities in the Greater Milwaukee
Area, covering all 6 area watersheds. Since 1994, MMSD has been able to capture and clean 98.4% of all rain and
wastewater that enters the sewer systems and return the water to the lake per the Jones Island Water Reclamation
Facility and the South Shore Water Reclamation Facility. Despite the fact that both facilities started operating several
decades ago, the facilities operate well above the national goal of 85%. MMSD is responsible for cleaning billions of
gallons of wastewater every year and treats a wide range of wastewater sources including residential, industrial and
surface runoff with the Jones Island Water Reclamation Facility producing Milorganite, a fertilizer produced from of
human feces Similar, the South Shore Water Reclamation Facility creates energy at this facility through the process of
using anaerobic digester to turn organic material into methane gas, used to produce electricity.

MMSD is also responsible for the sanitary sewer system in the area, which consist of over 3,000 miles of sewer pipes,
serving 28 communities in the region. Additionally, MMSD also has an approximate 300 miles of regional sewer pipes,
responsible for transporting wastewater to the reclamation facilities. In addition to the sewer pipes, MMSD has a Deep
Tunnel that prevents more than 110 billion gallons of pollution from entering into Lake Michigan annually. Since 1994,
98.4% of all water that has entered into the sewer system has been captured and cleaned. MMSD began construction on
the Deep Tunnel in the 1980’s and it became fully operational in 1994. The tunnel is carved out in bedrock 300 feet
underground and has 19.4 miles of pipes. The region has spent over $4 billion to reduce sewer overflows and prior to the
Deep Tunnel, the region polluted Lake Michigan with between 8 to 9 billion gallons of sewage each year. Another $1

19 South Florida Water Management District: Governing Board Declares Water Reuse Week May 14-20, accessed on 01/26/2018
20 Florida Department of Environmental Protection (2017): General Facts and Statistics about Wastewater in Florida, accessed on 12/06/2017
21 The Florida Department of Health (DOH): Onsite Sewage Programs, accessed on 12/07/2017

18
billion was invested in the Deep Tunnel system in 2010, which increased the storage capacity to 521 million gallons and is
now 28.5 miles long.

3.1.4 Outlook

In May 2017, the Trump Administration laid out the first vision for a $1 trillion national infrastructure plan which
outlined $200 billion in direct federal spending over the next decade on needs such as roads, bridges, tunnels, railroads
and expanded broadband, along with incentives for states, cities and private investors and efforts to reduce the burdens
of regulations.22 In January 2018, the White House reported it would delay the release of its long-awaited infrastructure
package yet again, after announcing it would come to realization by the end of January.23

In terms of water infrastructure, the initial fact sheet argued that “underperformance is evident in many areas, from our
congested highways, which costs the country $160 billion annually in lost productivity, to our deteriorating water
systems, which experience 240,000 water main breaks annually.” The two pillars of funding addressed by this new
infrastructure initiative included the Water Infrastructure Finance and Innovation Act (WIFIA) Program as well as a
reform of the laws governing the Inland Waterways Trust Fund.24

In February, Bloomberg reported that “water infrastructure funding would be essentially shielded from the deep cuts the
Trump administration is seeking in Environmental Protection Agency funding in fiscal 2019…” notwithstanding the
government’s intention to cut or substantially downsize regional water quality programs. Despite a 25 percent funding cut
in comparison to fiscal year 2017, “the proposed budget would maintain funding levels for EPA-funded water
infrastructure projects,” with the EPA’s two largest water funds, which give money to states for infrastructure loans,
receiving almost $2.3 billion in 2019. However, most regional water quality programs, in which the EPA supports
cooperative efforts by states, would take a hard hit under President Trump’s 2019 budget request. As the article states, the
plan proposes “to eliminate EPA support for all such regional programs, with the exception of the Chesapeake Bay and
the Great Lakes. Those two programs would be cut to 90 percent below the fiscal 2017 enacted levels.”25

Critics maintain the plan does not go far enough to address water infrastructure in rural areas. The activism group, Food
& Water Watch, claims that the new infrastructure plan will privatize much of the infrastructure and according to the
group’s research, privately owned water systems charge 59% more than publicly owned systems. As a result, Food &
Water Watch is urging Congress to approve only plans that would keep these critical systems publicly controlled. 26

Regarding the nation’s aging and deteriorating water infrastructure, the urge for financial investments remains clear,
despite of the above mentioned uncertainties. The Clean Water State Revolving Fund (CWSRF) and the Drinking Water
Sate Revolving Fund (DWSRF), for instance, continue to be powerful investment tools for a sustainable water
infrastructure. Through these programs, the EPA provides communities and government agencies with financial aid for a
range of water quality infrastructure projects, which organizations, associations, municipalities and utilities in each state
profit from.

3.2 Challenges

In the United States, there are over 150,000 active public drinking water systems that collectively deliver treated water
through an estimated 1.2 million miles of distribution pipes. As such, the municipal water systems and the clean water
they provide are one of the country’s greatest health achievements. However, the infrastructure of these essential systems
face an array of challenges that are described below.

22 Politico (2017): Trump slips infrastructure plan into budget, accessed on 1/10/2018
23 Politico (2018): Release of Trump infrastructure plan may slip past January, accessed on 1/10/2018
24 Water Online (2017): What Could Trump's Infrastructure Plan Mean For Water?, accessed on 1/10/2018
25 Scott, Dean (2018, February 12). Water Infrastructure Among Few EPA Winners in Trump Budget Plan. Bloomberg BNA. Retrieved from

https://www.bna.com/water-infrastructure-among-n57982088642/, accessed 2/22/2018
26 Food & Water Watch (2017): Trump’s Water Infrastructure Plans in Two Words: Higher Rates, accessed on 1/10/2018

19
3.2.1 Aging Water Infrastructure

To supply the nation’s homes and businesses with water, the United States depend on a country-wide network of aging
underground pipes, many of which are reaching or have exceeded the end of their useful life. As stated earlier in this
study, according to the American Water Works Association (AWWA), updating the water infrastructure will cost $1
trillion over the course of the next 25 years.

The effect of the aging water infrastructure far extends public usage as U.S. businesses rely directly or indirectly on the
water infrastructure, and in light of the aging and outdated technology, business operations will be greatly impacted
through utility service interruptions, polluted drinking water, and higher water bills. The EPA estimates that it could cost
between $2,500 to $8,000 to replace a typical home’s full service line with total costs on a national level between $16
billion to $80 billion.27 Furthermore, about 6 billion gallons of treated water are lost every day due to broken and leaky
pipes alone according to the American Society of Civil Engineers.

However according to expert interviews, repairs to the underground water infrastructure are often only made when
failure occurs and only act as a short term solution.

William Young, Chairman of the Florida Section of the American Water Works Association and Utilities Director at St.
Johns County, highlighted that pipe breaks in Florida occur on a daily basis. However once noticed, authorities are
relatively quick about fixing these issues. 28

As wastewater infrastructure of municipalities across the United State are old and in disrepair, environmental events can
also have significant effects on the state’s water infrastructure. For example, in September 2017, Hurricane Irma hit the
mainland of Florida, which lead to the evacuation of millions of Americans. In terms of Florida’s water infrastructure,
heavy rains and flooding from storm surges caused by the hurricane overran sewage treatment plants that already were
taxed by rapid population growth and deferred maintenance. In the City of Delray Beach located on Florida’s east coast,
70 % of the city’s sewage pumping stations lost power which contributed to sewage backups. Although hurricane Irma
affected Florida’s water infrastructure only temporarily, rising sea water levels most likely will impose similar, but
permanent effects on Florida.29

Based on ASCE’s estimates there is a need to invest a total of $123 billion annually in water
infrastructure over the next 10 years (in current 2016 dollars) to achieve a good state of repair.30

The aging wastewater systems in Florida have led to a declining condition of installed treatment and conveyance over the
years. According to Addie Javed, who is the former President of the Florida Section of the American Society of Civil
Engineers, deferred maintenance as the biggest problem as sooner or later large investments for maintaining Florida’s
water infrastructure will have to be made. He identifies tightening budgets as the key reason why costly maintenance has
been deferred in the States. Mr. Javed also explained, that much of Florida’s infrastructure has reached the end of its
useful life and that the swelling population makes future investments into Florida’s water infrastructure even more
important.31

Wisconsin faces similar problems. The American Society of Civil Engineers estimates that the state of Wisconsin will need
about $1 billion over the next 20 years to rehabilitate domestic clean water infrastructure. Another $6.33 billion is needed
to repair the wastewater system and restore them to proper working conditions. 32

27 Berkey (2017): Understanding Aging Water Infrastructure in the US, accessed on 1/10/2018
28 Expert Interview with William Young, Chairman of the Florida Section of the American Water Works Association and Utilities Director at the St. Johns
County
29 Think Progress (2017): Florida’s sewage infrastructure woes come gushing to the surface with Irma, accessed on 12/08/2017
30 Value of Water Campaign (2017): The Economic Benefit of Investing in Water Infrastructure, accessed on 1/10/2018
31 New York Times (2017): Irma Will Test Florida’s Infrastructure, From Dikes to Sewage Plants, accessed on 12/08/2017
32   American Society of Civil Engineers (2017): 2017 Infrastructure Report Card for Wisconsin, accessed on 12/10/2017

20
To react to the aging and deteriorating water infrastructure, the EPA created a review on how to enforce that the states
adequately monitor and report drinking water sampling results from public water systems (PWSs) through the Safe
Drinking Water Act (SDWA). Secondly, the EPA aimed to determine how the agency could improve its overall oversight of
state drinking water sampling programs. The review concluded that there are limitations to the EPA’s oversightthat affect
the agency’s ability to actually maintain a consistent oversight of the national drinking water program. Furthermore,
these limitations of the EPAreduce the reliability of EPA monitoring and reporting data. In order to correct these issues
and to address these limitations, the agency is engaging in ongoing activities.

“EPA works with collaborators and stakeholders to conduct projects that will fill identified aging drinking water and
wastewater research gaps,” said Thomas Speth, Director of the Water Supply and Water Resources Division at the EPA’s
National Risk Management Research Laboratory. “The application of new technologies and management practices from
this research could also narrow the large funding gap.”33

3.2.2 Contamination

Another problem for the aging water infrastructure is contamination. According to the EPA, at least 10 million homes and
buildings in the U.S. receive water from lead pipelines.34 Every year across the country, there are approximately 240,000
water main breaks and as many as 75,000 yearly sanitary sewer overflows that discharge three to ten billion gallons of
untreated wastewater, leading to some 5,500 illnesses due to exposures to contaminated recreational waters.35

As a result of the nation’s severely outdated sewer systems and due to the lack of capacity for the growing population,
billions of raw sewage is discharged into local surface water every year when heavy rains exceed the capacity of the sewer
systems.

Sanitary Sewer Overflows (SSO) are a significant problem in the Southeast of the U.S. due to aging water infrastructure.
In 2013, the Miami-Dade County agreed to invest $ 1.6 billion in rehabilitating its existing wastewater treatment plants
and collection and transmission system within the next 15 years to eliminate these SSOs. Within the State of Florida,
Miami-Dade County’s commitment to address its sewage problems is a leading example and underlines the importance of
reducing SSOs. The county also has been implementing and developing management operation and maintenance
programs to minimize 211 sanitary sewer overflows that occurred in the county the between January 2007 and May
2013.36

Furthermore, the aging water systems are burdened by increasing populations and are struggling to treat and remove new
and persistent chemicals found in the wastewater.

At least 20 million Americans in 33 states have perchlorate in their drinking water supply that can affect the development
of the brain and possibly lead to developmental disabilities and cancer. The EPA already has this on their radar but other
chemicals such as trichloroethylene (TCE), hexavalent chromium, and atrazine remain in drinking water supplies
nationally.37

Other studies have found the presence of other chemicals, antibiotics, and hormones from pharmaceuticals in the water
supply, as a result of improper disposal, urinary excretion and waste from the manufacturing processes.
The presence of these various chemicals in the water supply complicates water treatment and elevates pollution in the
drinking water.

3.2.3 Urbanization and Agriculture

33 EPA: EPA Research Highlights - Aging Water Infrastructure, accessed on 1/10/2018
34 Berkey (2017): Understanding Aging Water Infrastructure in the US, accessed on 1/10/2018
35 EPA: EPA Research Highlights - Aging Water Infrastructure, accessed on 1/10/2018
36 The United States Department of Justice (2013): Miami-Dade Agrees to $1.6 Billion Upgrade of Its Sewer System to Eliminate Sewage Overflows,

accessed on 01/08/2017
37 Antonia Sohns: Water pollution, old infrastructure contaminates water supplies, accessed 1/11/2018

21
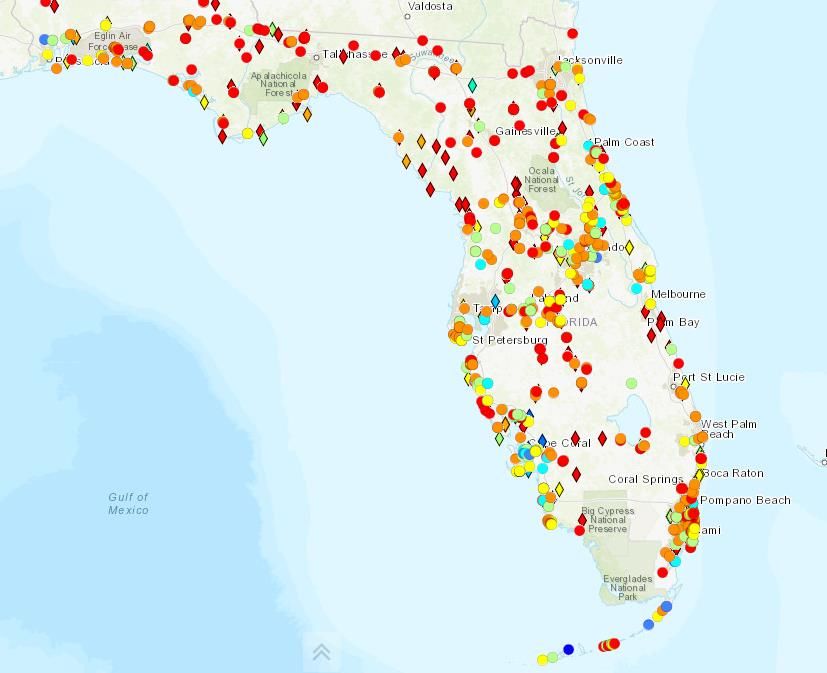
In Wisconsin one of the leading problems of water quality issues is polluted runoff from agriculture.

In Florida, agriculture also accounts for a significant portion of Florida’s freshwater withdrawals and also contributes to
the gradual deterioration of the state’s water quality, which directly affects the state’s natural water reservoir and
environment. The United States Geological Survey (USGS) published the report “Water Withdrawals in Florida, 2012”,
which gives a general overview of water use by category and by water management district. The report underlines the
importance of groundwater sources which supplied drinking water to 17.699 million residents which equaled 93% of the
state’s population and 4,173 Mgal/d of groundwater withdrawals in 2012. Fresh surface water, all from public water-
supply systems, provided 1.375 million residents, which equaled 7% of Florida’s population in 2012.

Agricultural self-supplied was the largest user of freshwater in Florida in 2012. The term “Agricultural self-supplied use”
is defined by all water withdrawals for crop irrigation and also for all other agricultural and farming operations. It
accounted for 39% of all Florida’s freshwater withdrawals in 2012 which equals a total of 2,505 Mgal/d. 56% (1,400
Mgal/d) of these freshwater withdrawals were supplied by groundwater’s, whereas the remaining 43% (1,105) were
supplied by surface water. The majority of water for agricultural irrigation purposes in Florida is freshwater, only 73
Mgal/d of reclaimed wastewater was used for irrigation purposes additional to freshwater supplies. 99% (2,480 Mgal/d)
of the water used in agriculture are used for the irrigation of crops whereas only 1% (25 Mgal/d) is used for no irrigational
causes related to livestock and fish farming. There are a 2.744 million acres of cropland in Florida, 1.493 million acres,
which is the majority of cropland (54%), were estimated to be irrigated.38

In large parts of southern Florida, water quality has been deteriorating gradually by human activities resulting in high
nutrient concentrations of water, primarily through agricultural activities. The high levels of nutrient concentration then
contribute to the over-enrichment of surface waters, including important natural systems, such as Lake Okeechobee and
the northern Everglades. The source of these high phosphorus concentrations is fertilizer used in agricultural runoff.
Phosphorus then enters the northern Everglades and significantly contributes to the ecosystem degradation.39

To conclude, the agricultural runoff in Florida not only accounted for 39% of the states freshwater withdrawals. However,
agricultural runoff is also related to deteriorating the overall water quality in Florida and has significant impacts on its
environment and ecosystems.

Wisconsin has the largest number of public water systems in comparison to all other states in the U.S., around 11,408.
The largest share consists of municipal community water systems owned by cities, villages, towns or sanitary districts
with the biggest municipal water system, Milwaukee Water Works, serving almost 650,000 residents. Additionally, non-
community water systems serve workplaces, schools, restaurants, and other public venues with 10,354 non-community
systems statewide, whose water comes from privately owned wells. This group of systems is divided into transient non-
community systems, which serve primarily motels, campgrounds, and non-transient non-community systems, which
serve a similar population including schools, and day care centers. Overall, Wisconsin has 9,463 transient non-
community systems.

Similar to many areas across the Midwest, most public water systems in Wisconsin rely on groundwater. However, some
of the largest communities such as Milwaukee and Green Bay, receive water through one of 56 surface water systems,
which receive water from one of Wisconsin’s numerous lakes. Even though most of the state’s public water systems rely
on groundwater, the surface water systems, encompassing one percent of all water systems, serve 37% of the state’s
population as shown in Figure 6 below.40 This relatively high population dependence on surface water systems highlights
the state’s reliance on the Great Lakes and their environmental stability.

38   United States Geological Survey (2012): Water Withdrawals in Florida, 2012, accessed on 12/19/2017
39 United States Geological Survey: Major Findings, accessed 12/19/2017
40 Wisconsin Department of Natural Resources Bureau of Drinking Water and Groundwater (2017): Wisconsin Public Water Systems 2016 Annual Drinking

Water Report, accessed on 1/10/2018

22
You can also read