Natural Gas Flaring and Venting: State and Federal Regulatory Overview, Trends, and Impacts - June 2019 - Department of Energy
←
→
Page content transcription
If your browser does not render page correctly, please read the page content below

Office of Oil and Natural Gas
                      Office of Fossil Energy

Natural Gas
Flaring and Venting:
State and Federal
Regulatory Overview,
Trends, and Impacts
June 2019

            NATURAL GAS FLARING AND VENTING: STATE AND FEDERAL REGULATORY OVERVIEW, TRENDS, AND IMPACTS   1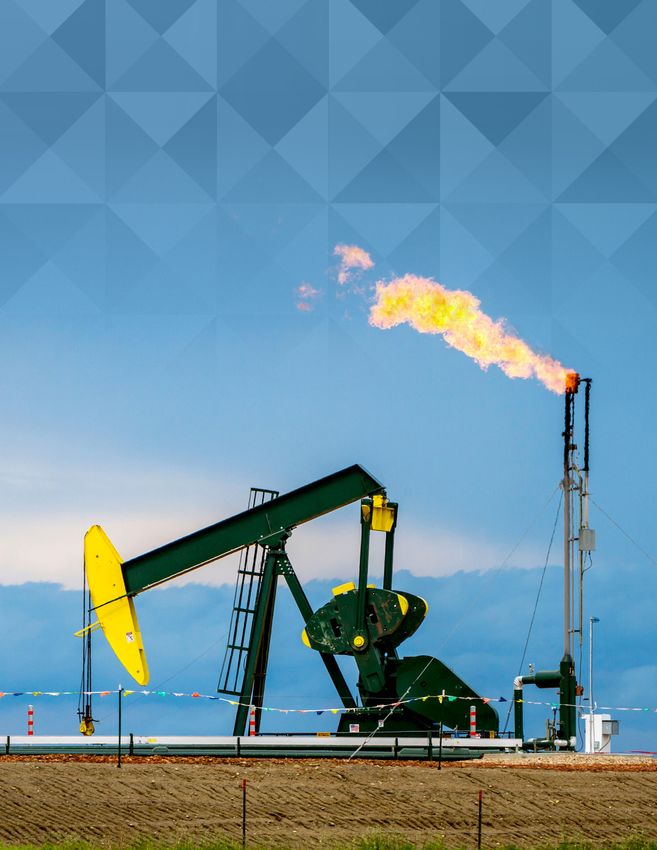
Executive Summary
The purpose of this report by the Office of Fossil         that is permitted, as described in the “Analysis of
Energy (FE) of the U.S. Department of Energy               State Policies and Regulations” section of this report.
(DOE) is to inform the states and other stakeholders
                                                           Domestically, flaring has become more of an issue
on natural gas flaring and venting regulations, the
                                                           with the rapid development of unconventional,
level and types of restrictions and permissions,
                                                           tight oil and gas resources over the past two
and potential options available to economically
                                                           decades, beginning with shale gas. Unconventional
capture and utilize natural gas, if the economics
                                                           development has brought online hydrocarbon
warrant. While it is unlikely that the flaring and
                                                           resources that vary in their characteristics and
limited venting of natural gas during production
                                                           proportions of natural gas, natural gas liquids and
and handling can ever be entirely eliminated, both
                                                           crude oil. While each producing region flares gas for
industry and regulators agree that there is value in
                                                           various reasons, the lack of a direct market access
developing and applying technologies and practices
                                                           for the gas is the most prevalent reason for ongoing
to economically recover and limit both practices.
                                                           flaring. Economics can dictate that the more valuable
FE’s objective is to accelerate the development of
                                                           oil be produced and the associated gas burned
modular conversion technologies that, when coupled
                                                           (or reinjected) to facilitate that production. Until
with the currently available commercial alternatives,
                                                           transmission, storage, and delivery infrastructure
will provide a complete portfolio of options for
                                                           increases in these newer or expanding producing
companies seeking to monetize flared gas volumes of
                                                           regions, flaring and venting will continue to represent
practically any magnitude and at any location.
                                                           environmental issues and lost market opportunities.
Natural gas is a gaseous mixture of hydrocarbon            Of specific importance has been the increase in
compounds, the primary one being methane and               flaring of gas associated with oil production in liquids
non-hydrocarbon gases (e.g., water vapor, carbon           rich plays where there is not enough gas gathering
dioxide, helium, hydrogen sulfide, and nitrogen).          and transportation infrastructure to enable the gas to
Natural gas flaring is the controlled combustion           be marketed.
of volatile hydrocarbons and venting is the direct
                                                           Two states where flaring has increased are Texas
release of natural gas into the atmosphere, typically
                                                           and North Dakota, while both states are working
in small amounts. While flaring is more common
                                                           with producers to limit the need for flaring without
than venting, both of these activities routinely
                                                           shutting down or impacting the timely and continued
occur during oil and natural gas development as
                                                           production of oil from new wells. In both cases, these
part of drilling, production, gathering, processing,
                                                           states have seen rapid development of unconventional
and transportation operations. The reasons behind
                                                           oil plays (e.g., Permian Basin and Eagle Ford in Texas
both flaring and venting may be related to safety,
                                                           and Bakken Shale in North Dakota) with significant
economics, operational expediency, or a combination
                                                           volumes of associated gas production. In 2017, the
of all three. Both federal and individual state
                                                           volumes of gas flared and vented reported to DOE’s
regulations control the amount of flaring and venting

                         NATURAL GAS FLARING AND VENTING: STATE AND FEDERAL REGULATORY OVERVIEW, TRENDS, AND IMPACTS   i
Energy Information Administration (EIA) by Texas            Many companies have implemented technology
     totaled 101 billion cubic feet (Bcf) and North Dakota       solutions to venting—voluntarily or in response to
     by 88.5 Bcf. These totals are 10 to 20 times the            regulations, although continued increases represent
     volumes reported by other states that collect such          losses to valuable economic resources and sources
     data and the numbers reflect the much higher level of       for emissions. Technologies currently exist to capture
     oil and natural gas production in these two states.         gas that would otherwise be flared and convert it
                                                                 into useful products, or used onsite to facilitate
     Data on flaring and venting volumes have been
                                                                 production. Opportunities exist to increase the
     collected from producers by some producing state
                                                                 prevalence of these technological solutions and
     agencies, who then share the data with EIA. The data
                                                                 improve their economical uses, ultimately benefiting
     compiled by EIA show that the reported volumes
                                                                 domestic and international gas consumers.
     of gas flared reached levels of between 225 and 285
     Bcf per year in the mid-1990s. After dropping to less       Commercial alternatives to flaring include
     than half that during the early 2000s, reported flared      compressing natural gas and trucking it short
     volumes have again risen to levels between about 200        distances for use as a fuel for oil field activities;
     and about 300 Bcf per year during the 2011-2017             extracting natural gas liquids from the flare gas
     time period as both oil and natural gas production          stream before flaring the remaining methane (a
     levels have increased significantly.                        partial solution); converting the gas to electric power
                                                                 using small-scale generators, small-scale gas-to-
     Every oil- and gas-producing state has in place
                                                                 methanol or gas-to-liquids conversion plants; and
     regulations to limit or prevent the “waste” of gas
                                                                 converting captured gas to LNG and trucking it short
     resources. However, the flaring limits vary from state
                                                                 distances for use as a fuel for oil field activities.
     to state and no national standards currently exists. FE
     has developed a series of individual state fact sheets      FE is currently implementing a plan to expand its
     that summarize the flaring and venting regulations          research program focused on mitigating emissions
     applicable in each of 32 oil- and gas-producing             from midstream natural gas infrastructure. One of
     states and provide context and contact information          the areas of interest is focused on accelerating the
     for interested stakeholders. These fact sheets will be      development of technologies capable of converting
     available on FE’s website.                                  gas that would otherwise be flared, into transportable,
                                                                 value-added products. It is envisioned that successful
     In the states where a large number of associated gas
                                                                 technologies developed in this research and
     flares have been permitted over the past few years,
                                                                 development effort will be integrated into small-
     planned increases in natural gas processing and
                                                                 scale modular systems that, in the future, can be
     pipeline takeaway capacity may reduce the volume
                                                                 transported from one flare site to the next for use
     of flaring over the next five years. In both Texas
                                                                 during periods when planned natural gas gathering
     and North Dakota, gas processing and gas pipeline
                                                                 and transportation systems are not yet functional.
     capacities are being expanded to handle the increased
     volumes of associated gas being produced so that it         FE is specifically targeting two areas where
     can be economically captured and sold. In the short         basic research needs have been identified: (1)
     term, however, flaring percentages have the potential       multifunctional catalysts, and (2) modular conversion
     to rise above current levels in both Texas and North        equipment designs. The first area involves the early-
     Dakota if oil prices continue to recover and drilling       stage development and evaluation of multifunctional
     rigs remain active.                                         catalysts for the direct conversion of methane to
                                                                 liquid petrochemicals (e.g., methanol, ethanol,

ii   NATURAL GAS FLARING AND VENTING: STATE AND FEDERAL REGULATORY OVERVIEW, TRENDS, AND IMPACTS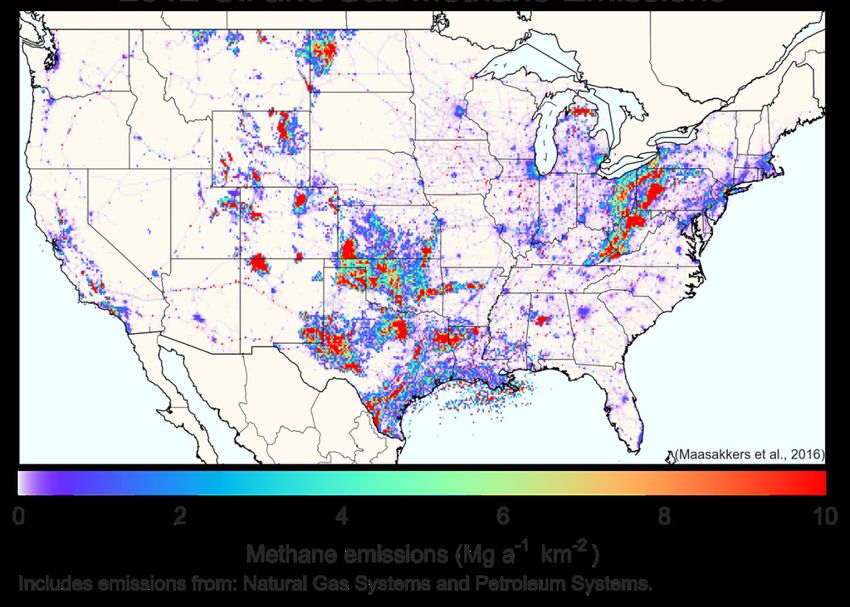
ethylene glycol, acetic acid, and other hydrocarbons)
that can be easily transported and are suitable for
subsequent conversion into commercial products.
The second area of interest is the development of
novel equipment and process design concepts for
achieving high-selectivity pyrolysis, which is integral
to the manufacture of high-value carbon products
from methane or the mixtures of methane, ethane,
propane, and butanes representative. Research in
this area will focus on the application of process
intensification at modular-equipment scales suitable
for deployment and transport between remote
locations where gas is being flared.

Introduction to
Natural

                          NATURAL GAS FLARING AND VENTING: STATE AND FEDERAL REGULATORY OVERVIEW, TRENDS, AND IMPACTS   iii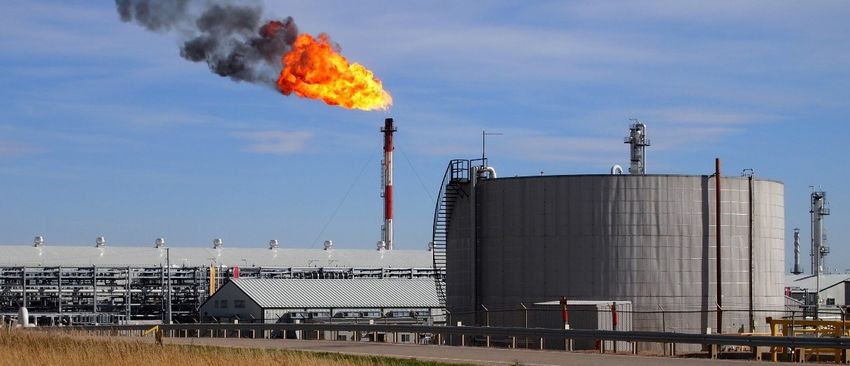
Table of Contents
     Executive Summary.......................................................................................................... i
     Introduction to Natural Gas Flaring and Venting..........................................................iii
        Flaring and Venting Definitions................................................................................................. 1

        Flaring and Venting Volume Estimates .. .................................................................................... 6

        Federal Flaring and Venting Regulations.. ................................................................................ 15

     Overview of Federal Policy .. ........................................................................................ 17
        Current and Pending Federal Regulatory Actions on Natural Gas Flaring and Venting. . ........... 17

        Assess Potential Federal Impediments to Oil and Natural Gas Production. . ............................. 19

     Analysis of State Policies and Regulations.................................................................. 20
        Summary of Impacts and Trends.............................................................................................. 20

     Projected Associated Gas Production........................................................................... 49
     Technology Solutions to Reduce Associated Natural Gas Flaring and Venting........... 50
     DOE Initiatives to Accelerate Technology Solutions to Reduce Natural Gas Flaring
     and Venting. . .................................................................................................................. 53
     Conclusions.................................................................................................................... 55
     Appendix A: Analysis of Texas Railroad Commission Flare Data. . ................................ 56

iv   NATURAL GAS FLARING AND VENTING: STATE AND FEDERAL REGULATORY OVERVIEW, TRENDS, AND IMPACTS
Introduction to Natural Gas Flaring
and Venting
                                                                 •   Associated gas produced with crude
Flaring and Venting Definitions                                      oil that has a ready market, but where
Natural gas flaring is defined as the controlled                     construction and installation of a gathering,
combustion of natural gas for operational, safety, or                compression, and sales infrastructure
economic reasons. Venting is the direct release of                   for the gas is not economic, or where the
natural gas into the atmosphere. Categories of natural               required expansion of the existing system is
gas flaring and venting in the upstream oil and                      not economic.
natural gas industry include the following:
                                                           3. Venting for Operational Reasons
1. Flaring for Operational and Safety Reasons
                                                                 •   Venting of natural gas diverted from oil and
     •   Diversion and disposal of gas influx (kick)                 gas compression or processing equipment
         during drilling.                                            due to system upset condition or pressure
     •   Diversion and disposal of produced gas                      release emergency.
         during well testing (Figure 1).                         •   Blow-down of gas from processing
     •   Diversion and disposal of flowback gas                      equipment, pipelines or compressors prior
         during the well completion process.                         to repairs.
     •   Disposal of natural gas diverted from                   •   Bleed-off of gas pressure during routine
         oil and gas compression or processing                       operation of pneumatic devices (e.g.,
         equipment due to maintenance operations,                    motor valve controllers, pressure and level
         system upset condition, or pressure release                 controllers) (Figure 5).
         emergency (Figure 2).                                   •   Routine emissions from natural gas driven
     •   Disposal of relatively small volumes of                     pneumatic pumps.
         waste gas from the routine operation                    •   Venting to avoid pressure buildup in crude
         of equipment utilized at an oil or gas                      oil, condensate (light liquid hydrocarbons
         processing facility.                                        recovered from lease separators or field
2. Flaring for Economic Reasons                                      facilities at associated and non-associated
   (Figure 3 and Figure 4)                                           natural gas wells. Mostly pentanes and
                                                                     heavier hydrocarbons. Normally enters
     •   Associated gas produced with crude oil
                                                                     the crude oil stream after production.), or
         (also called casinghead gas) that has a
                                                                     water storage tanks operating without vapor
         ready market, but where the gathering,
                                                                     recovery systems (Figure 6).
         compression, and sales infrastructure for
         the gas is under construction but not yet               •   Leakage from compressor seals (both
         operable, and where economic factors                        reciprocating and centrifugal compressors).
         require early oil production in advance of
         natural gas capture.

                         NATURAL GAS FLARING AND VENTING: STATE AND FEDERAL REGULATORY OVERVIEW, TRENDS, AND IMPACTS   1
•    Fugitive emissions from equipment leaks                            •    Emissions during oil or condensate loading/
                  (e.g., stuck dump valves, storage tank                                  unloading at tank truck or barge transport
                  hatches left open, cracked flange seals).                               facilities.
             •    Routine emissions from glycol dehydrator                           •    Routine well venting during liquids
                  still columns and flash tanks, and amine                                unloading on low-pressure gas wells.
                  natural gas sweetening units (Figure 7).

                                                                                                 FIGURE 1. Photograph of the gas flare
                                                                                                 from the thermal gas hydrate production
                                                                                                 test in the Mallik 5L-38 Gas Hydrate
                                                                                                 Research Well. Photo with permission
                                                                                                 from S. R. Dallimore, Geological Survey of
                                                                                                 Canada. (Source)1

         FIGURE 2. Natural gas being flared at the Hess Corporation gas plant in Tioga, North Dakota, due to maintenance issues.
         Photo credit Amy Dalrymple / Forum News Service (Source)2

    1
        https://www.researchgate.net/figure/Photograph-of-the-gas-flare-from-the-thermal-gas-hydrate-production-test-in-the-Mallik_fig3_29735752
    2
        https://www.thedickinsonpress.com/business/energy-and-mining/3885727-gas-plant-repairs-will-add-flaring

2   NATURAL GAS FLARING AND VENTING: STATE AND FEDERAL REGULATORY OVERVIEW, TRENDS, AND IMPACTS
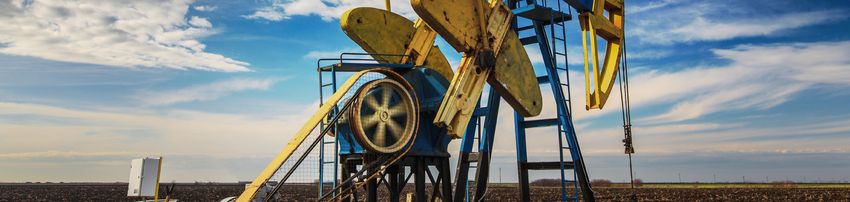
FIGURE 3. Flares burning associated gas
                                                                                    at a well in the Bakken shale oil field,
                                                                                    North Dakota. Photo courtesy of Joshua
                                                                                    Doubek. (Source)3

     FIGURE 4. Permanent casinghead gas flare on a producing stripper oil well in Hopkins County, Kentucky. Photo courtesy of
     Marvin Combs, Kentucky Division of Oil & Gas (Source)4

3
    https://commons.wikimedia.org/wiki/File:Bakken_Flaring_Gas_at_night.JPG
4
    http://thepttc.org/workshops/eastern_091614/eastern_091614_Combs.pdf

                                 NATURAL GAS FLARING AND VENTING: STATE AND FEDERAL REGULATORY OVERVIEW, TRENDS, AND IMPACTS    3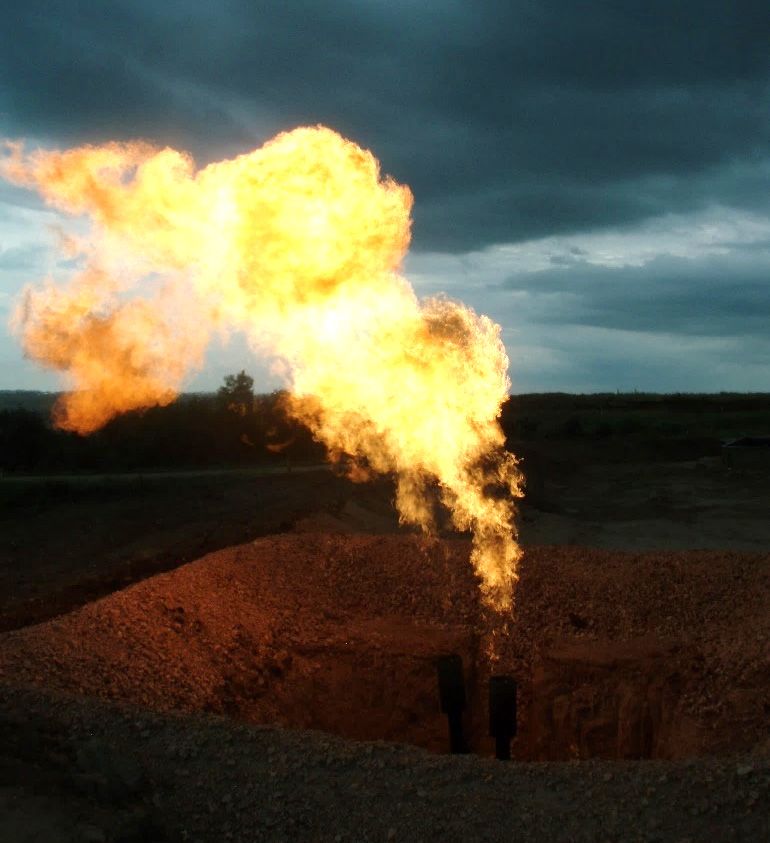
FIGURE 5. Schematic of a typical pneumatic controller actuated valve that operates off of gas pressure and routinely vents
        small volumes of natural gas to the atmosphere. In addition to the venting, poor maintenance can also lead to increased
        leak potential at the various connections that are needed to integrate the control system with the valve actuator.
        Valve image courtesy of Emerson Automation Solutions and Fisher Controls International, LLC. (Sources: 1 and 2) 5, 6

                                                                                              Storage

                                                                                                        VR

        FIGURE 6. Aerial infrared photo showing crude oil tank vent emissions (left) and photo of vapor recovery (VR) unit installed
        on storage tank to prevent emissions (right, with connection line identified). Photo courtesy of HY-BON/EDI (Source)7

    5
        https://www.epa.gov/sites/production/files/2016-04/documents/18boynton.pdf
    6
        https://www.emerson.com/en-au/catalog/fisher-ew-en-au
    7
        https://www.epa.gov/sites/production/files/2016-04/documents/8voorhis.pdf

4   NATURAL GAS FLARING AND VENTING: STATE AND FEDERAL REGULATORY OVERVIEW, TRENDS, AND IMPACTS
FIGURE 7. Photo of a tri-ethylene glycol dehydrator associated with a natural gas compressor station with still column vent
identified. Images with permission from Sean Hiebert. (Source)8
The flaring that occurs for reasons listed in Category not be implemented unless required by regulations or
1 above (i.e., Flaring for Operational and Safety corporate objectives determine them to be otherwise
Reasons) is generally short term and necessary to worthwhile. Category 2, the flaring of relatively
ensure safe operating practices. The venting that large volumes of gas associated with oil production,
occurs in Category 3 (i.e., Venting for Operational either temporarily or long term, is the area that has
Reasons) is generally low volume (or else it would generated the most concern among stakeholders and
be captured and flared under Category 1 as a safety is a primary focus of this report.
hazard) and is often also required for safety reasons.
Flaring of associated gas for extended periods of
Some venting is avoidable and could be reduced
time may be necessary, with permission, if a well
or prevented through the use of technology (e.g.,
is being drilled in a new area that lacks natural gas
by installing low-bleed controllers, vapor recovery
pipelines. Several wells may be drilled and produced
units, improved compressor seals) or the application
for an extended period of time before a company
of better maintenance and best practices programs.
determines from the test data that an investment
In some cases, these options are economic and may
in production facilities and pipelines will meet
result in the increase in gas sales volumes. In other
economic standards. When the wells primarily
cases, the required capital investment makes them
produce oil or condensate, flaring of associated gas
uneconomic or marginally economic, and they will
8
https://www.spartancontrols.com/~/media/library/engine-and-compressor-automation/rem-technology/waste-to-wealth_conocophil-
lips-case-study.pdf?la=en
NATURAL GAS FLARING AND VENTING: STATE AND FEDERAL REGULATORY OVERVIEW, TRENDS, AND IMPACTS 5may continue even after the decision to continue with Through the practice of flaring, methane is oxidized
development and construct oil transport pipelines (through combustion) to carbon dioxide (CO2)
and facilities has been approved. and water. From an environmental standpoint,
flaring is better than venting since CO2 is 25 times
Eventually, when long-term volumes, pressures,
less impactful as a greenhouse gas than methane
and rates of associated gas production prove to be
over a 100-year timespan.9 However, depending
sustainable at levels that can economically justify
on the constituents of the gas being flared (e.g.,
installation of new gas gathering infrastructure
combustion of gas containing hydrogen sulfide
or expansion of existing infrastructure, those
produces sulfur dioxide emissions) and the efficiency
investments will be approved, and the flaring will
of the flare equipment (e.g., some methane may
stop. If the economics cannot justify the investment,
escape unburned), there is no net negative impact
associated gas flaring may continue as long as it is not
from flaring versus sales in terms of environmental
prohibited by state or federal regulations.
impact, assuming the flared gas, if captured, would
The economics of flaring versus capture and sales be sold and then burned elsewhere under the same
of associated gas are not necessarily a simple conditions.
calculation. In addition to the expected volumes of
Thirty-two states produce significant volumes of oil
gas to be recovered and the cost of the gathering
and natural gas and in every one of these states the
lines and compression equipment needed, there are
venting and flaring of natural gas is regulated by
a number of other factors that must be considered.
state law. The state body charged with ensuring that
These can include the following:
state laws in this area are followed is typically a state’s
• Producer’s cost of capital department of natural resources, oil and natural gas
• Competition for investment dollars with other commission, state environmental protection agency
options in the producer’s portfolio or air quality board.
• Proximity of intrastate and interstate pipelines
and their capacities Flaring and Venting Volume
• Natural gas prices and price risk
Estimates
• Additional operating costs associated with
EPA GHG Inventory – The U.S. Environmental
natural gas production
Protection Agency (EPA) develops an annual report,
• Lease terms
called the Inventory of U.S. Greenhouse Gas Emissions
• Gas processing costs, which may be a function
and Sinks (Inventory), that tracks and estimates U.S.
of gas composition
greenhouse gas emissions by source going back to
• Likelihood of right-of-way approvals 1990. The report for 2019 was published in April
• Cost of land acquisition 2019.10 The relevant data for estimated methane
• Likelihood of legal challenges and concerns emissions and CO2 emissions related to upstream oil
regarding “social license to operate” and natural gas operations are gathered in Table 1 and
• Current flaring regulations and the likelihood of Table 2 below (green indicates oil production related
changes in the future. equipment, yellow indicates gas, and light brown
indicates equipment for both oil and gas).
The largest contributors are highlighted in red.
9
EPA, 2019, https://www.epa.gov/ghgemissions/overview-greenhouse-gases
10
EPA, 2019, Inventory of U.S. Greenhouse Gas Emissions and Sinks
6 NATURAL GAS FLARING AND VENTING: STATE AND FEDERAL REGULATORY OVERVIEW, TRENDS, AND IMPACTSTable 1 shows that about 350 billion cubic feet (Bcf) In the case of flare-generated CO2 emissions, it is
of methane is estimated to have been emitted each associated gas flaring and acid gas treatment related
year over the 2015–2017 timeframe. The volumes of flares, followed by oil storage tank vent flares and gas
CO2 estimated to have been generated by combustion processing facility flares. Because the volumes of gas
or venting from oil and gas production and released during most gas venting and flaring activities
transportation processes are shown in Table 2. are not measured, the EPA greenhouse gas inventory
relies on a complicated process of data collection that
EPA’s inventory also identifies the largest
utilizes surrogate indicators (e.g., number of wells
contributors. In the case of methane emissions,
completed, number of compressors) and emissions
it is pneumatic controllers and gas compressors.
factor multipliers to arrive at their estimates.
TABLE 1. EPA Greenhouse Gas Inventory for Methane Emissions from Oil and Gas Operations
% of Total
Source 2013 2015 2016 2017
(2017)
Natural gas compressor stations emissions 1,902 2,163 2,143 2,219 41%
Pneumatic controllers at oil and gas producing locations 1,918 1,862 1,882 1,894 35%
Venting from abandoned oil and gas wells 282 285 289 277 5%
Natural gas engines at gas processing facilities 228 234 250 256 5%
Natural gas transmission pipeline blowdowns 217 216 215 215 4%
Natural gas gathering pipeline leaks 139 137 137 142 3%
Liquids unloading from stripper gas wells 234 161 131 117 2%
Natural gas engines at gas producing facilities 131 125 118 114 2%
Chemical injection pumps 84 86 83 82 1%
Oil storage tank vent emissions 53 68 102 61 1%
Natural gas well workovers 73 13 16 34 1%
Oil well production heaters 23 29 27 28 1%
Natural gas gathering pipeline blowdowns 15 15 15 20 0%
Hydraulically fractured oil well completions 243 74 15 13 0%
Oil well workovers 24 13 6 2 0%
Total (Thousand Tons CH4) 5,566 5,481 5,429 5,474 100%
Total (Billion Cubic Feet CH4) 354.5 349.1 345.8 348.7
Total (Thousand Tons CO2 Equivalent) 139,150 137,025 135,725 136,850
NATURAL GAS FLARING AND VENTING: STATE AND FEDERAL REGULATORY OVERVIEW, TRENDS, AND IMPACTS 7TABLE 2. EPA Greenhouse Gas Inventory for CO2 Emissions from Oil and Gas Operations
% of Total
Source 2013 2015 2016 2017
(2017)
Acid gas removal equipment flares 14,565 14,946 16,481 16,728 38%
Associated gas from oil production flares 10,384 13,955 8,587 10,506 24%
Natural gas processing facility flares 5,902 6,058 5,203 5,683 13%
Oil storage tank vent flares 5,937 7,598 5,894 4,422 10%
Miscellaneous flaring associated with oil production 2,606 3,571 2,201 2,631 6%
Hydraulically fractured oil well completions 2,214 1,913 1,162 1,619 4%
Misc. natural gas production flares 978 1,318 1,187 1,090 2%
Natural gas well storage tank flares 1,173 1,240 1,129 585 1%
Hydraulically fractured well flares 1,265 277 177 474 1%
Natural gas well workover flares 133 77 59 356 1%
Oil well workover flares 136 192 207 258 1%
Total (Thousand Tons) 45,293 51,145 42,287 44,352 100%
A map of EPA methane emissions estimates provides estimates highlight metropolitan areas where natural
a good overview of the areas of the country where gas distribution systems can leak methane. These
methane emissions are more likely (Figure 8). The can be seen to be more of an issue in eastern cities
high emissions areas align with oil and gas producing where older legacy systems are more prone to such
areas as would be expected. Some of the emissions emissions.
8 NATURAL GAS FLARING AND VENTING: STATE AND FEDERAL REGULATORY OVERVIEW, TRENDS, AND IMPACTSFIGURE 8. EPA greenhouse gas inventory distribution of methane emissions from the oil and natural gas sector
(2012 data). (Source)11
Flaring Data Collected by DOE – Some U.S. natural reporting by producers. Not all states collect flaring
flaring and venting data has been collected from and venting data for submission to EIA, and those
producers by state agencies, who then share it with that do report do not necessarily follow the same
DOE’s Energy Information Administration. EIA, reporting standards. The EIA data is available online
in turn, aggregates and publishes the information and shown graphically in Figure 9. (Note: Subsequent
on an annual basis (after a 9-month delay). The sections of this report will provide greater detail on the
EIA-compiled flaring and venting data relies upon EIA data on a state-by-state basis).
summary reports from states, which rely upon self-
11
https://www.epa.gov/sites/production/files/2016-11/gch4-oilgas.png
NATURAL GAS FLARING AND VENTING: STATE AND FEDERAL REGULATORY OVERVIEW, TRENDS, AND IMPACTS 9300,000
250,000
Million Cubic Feet (MMCF)
200,000
150,000
100,000
50,000
1990 1992 1994 1996 1998 2000 2002 2004 2006 2008 2010 2012 2014 2016
Vented or Flared (MMCF)
FIGURE 9. EIA venting and flaring data from 1990 thru 2017 (recent data from only 10 states, in some cases only for
selected years). (Data Source: EIA)12
Satellite Image Estimation of Flared Volumes of from observations of shortwave and near-infrared
Natural Gas – A potentially more accurate option emissions at night is collected, processed, and
for making an assessment of the number of flares archived through a system known as the Visible
and their size is through the use of sophisticated Infrared Imaging Radiometer (VIIR) Suite
satellite systems. Entities such as the National (Figure 10). NOAA researchers have constructed
Oceanic and Atmospheric Administration (NOAA) a data processing algorithm that determines the
operate satellites that incorporate earth surveillance quantity of gas combusted during flaring from point
systems that can offer real-time data collection across sources. Data identified as non-flaring-related (e.g.,
the United States. NOAA began to monitor global forest fires and city lights) are disregarded. NOAA
flaring by satellite a few years ago. The organization assessed the results as accurate to within plus or
applies sophisticated processing systems to observe minus 9.5% of the actual flared gas volume.
and analyze flaring signals. The data generated
12
https://www.eia.gov/dnav/ng/ng_prod_sum_a_EPG0_VGV_mmcf_a.htm
10 NATURAL GAS FLARING AND VENTING: STATE AND FEDERAL REGULATORY OVERVIEW, TRENDS, AND IMPACTSFIGURE 10. Map showing NOAA flare detections over the United States, with close up of North Dakota, highlighting gridded
detection output used to estimate flare volumes. Images courtesy of NOAA. (Source)13
The NOAA assessment estimated the number of Texas ranged from about 1,700 to 2,600, in North
flares and the flared volumes for five individual Dakota from about 900 to 1,500, and in New Mexico
states with relatively high numbers of visible flares from about 200 to 400 (Figure 12). These satellite-
(Texas, North Dakota, New Mexico, Louisiana, identified flare numbers appear to represent only
Arkansas, and Colorado) over a 5-year time period large flares above a given size. For example, the
(2012–2016). This data showed that these five states number of permitted operating flares in Texas appear
accounted for about 10 billion cubic meters of flared to be about 100,000. See Appendix A for a detailed
natural gas per year (357 Bcf per year or about 1 Bcf/ analysis of Texas Railroad Commission (TRRC)
day) on average during the period (Figure 11). The flaring data. S&P Global Market Intelligence retrieved
number of individual flares identified per year in
13
https://www.esrl.noaa.gov/gmd/publications/annual_meetings/2017/slides/5-Zhizhin.pdf
NATURAL GAS FLARING AND VENTING: STATE AND FEDERAL REGULATORY OVERVIEW, TRENDS, AND IMPACTS 117
USA USA
225
6 Year Upstream Upstream
200 (BCM) (BCF)
175 5 2012 9.5 335.5
2013 9.1 321.4
Flared Volume, Bcf
Flared Volume, BCM
150
4
2014 11.3 399.1
125
2015 11.8 416.7
100 3
2016 8.8 310.8
75 2
50
1
25
0 0
TX ND NM LA AK CO
State
2012 2013 2014 2015 2016
FIGURE 11. NOAA flare detection data for flared volumes per year in six states over a 5-year time period. Graphic courtesy of
NOAA. (Source)14
2,500
2,000
Number of Identified Flares
1,500
1,000
500
0
TX ND NM PA CO MT
State
2012 2013 2014 2015 2016
FIGURE 12. NOAA flare detection data for number of identified flares in six states over a 5-year time period. Graphic courtesy
of NOAA. (Source)15
14
https://www.esrl.noaa.gov/gmd/publications/annual_meetings/2017/slides/5-Zhizhin.pdf
15
ibid
12 NATURAL GAS FLARING AND VENTING: STATE AND FEDERAL REGULATORY OVERVIEW, TRENDS, AND IMPACTSseveral years of global flaring information from next aggregated the data to arrive at a composite
NOAA and performed its own spatial aggregation annual flared volume for each state.16 The results,
upon the NOAA-calculated values of flared gas along with the data reported to EIA for the same
volumes for distinct combustion sources in Texas, states, show that an apparent underreporting to EIA,
New Mexico, and North Dakota. The organization most particularly in Texas and New Mexico (Table 3).
TABLE 3. Comparison of Volumes of Natural Gas Flared in Selected States (Bcf)
New Mexico North Dakota Texas
Years
NOAA EIA NOAA EIA NOAA EIA
2012 14 12 142 80 125 48
2013 24 21 111 103 142 76
2014 31 19 136 130 182 90
2015 42 25 125 107 204 114
2016 31 5 80 70 160 88
2017 23 3 114 89 163 101
The analysis by S&P Global Market Intelligence flaring assessment systems could be the inability
identifies a number of findings: of gas infrastructure construction to keep
pace with the significant increase in drilling,
• The NOAA combustion estimates exhibit a
completion, and production in the portion of
level of flaring in Texas roughly two-fold higher
the Permian Basin located in the southeastern
compared to EIA data over the same time
corner of the state. New Mexico crude oil
frame.
production grew in 2017 by 17.1% to 171
• According to figures derived from NOAA
million barrels (MMBbls) from 146 MMBbls in
flaring data, the average annual volume of gas
2016, according to EIA data, while natural gas
flared in Texas over the years 2012–2017 was
production from oil wells reported to the EIA
163 Bcf versus an average of 86 Bcf burned each
increased by 18.7%.
year over the same period according to EIA.
• North Dakota flaring activity, as measured by
That equates to 977 Bcf combusted over 6 years
NOAA and compared with data collected and
by NOAA data or 516 Bcf according to data
reported by the EIA, shows closer agreement
from EIA reports.
between the two data sets, compared with
• Gas flaring activity in 2012 and 2013 in New
observations in Texas and New Mexico. Over
Mexico, as measured by NOAA and aggregated
the years 2012–2017, NOAA-derived flaring
by S&P, was roughly 15% higher in both years
activity has averaged 25% higher than that
compared with the levels published by the EIA.
reported by the EIA. During the years 2013
However, the discrepancy grew considerably
through 2015, the NOAA and EIA flaring levels
in 2014 and 2015, and it widened again in
were only about 10% apart. However, in 2017,
2016 and 2017. A possible explanation for the
NOAA data indicated a level nearly 30% higher
widening gap in New Mexico between the two
than the 88.5 Bcf reported by the EIA.
16
Collins, B., 2018, “Are some shale producers under-reporting gas flaring to keep oil flowing?”
NATURAL GAS FLARING AND VENTING: STATE AND FEDERAL REGULATORY OVERVIEW, TRENDS, AND IMPACTS 13The Environmental Defense Fund (EDF) performed a owned University Lands. This can be useful as part of
similar analysis of the NOAA data, analyzing flaring a broader assessment, but it only gives us part of the
rates and volumes in the Permian during 2017. picture. Getting an accurate measure of flaring rates –
The results indicated that Permian operators alone like any other methane measurement – would require a
burned 104 Bcf of natural gas, which equated to combination of top-down and bottom-up assessments.” 18
4.4% of all gas produced in Texas in 2017.17 However,
Independent Assessments of Methane Emissions
industry only reported 55 Bcf of gas burned to the
from the Natural Gas System – In recent years,
Texas Railroad Commission (TRRC) in that same
hundreds of researchers have published dozens of
year. In the Delaware Basin portion of the Permian,
studies attempting to estimate the percentage of
which accounts for about half of all gas produced
methane emissions from the nation’s oil and natural
in the basin, NOAA satellite data shows operators
gas production and delivery systems. Estimates of
burning almost 8% of produced gas.
methane emissions in some regions have been as
In its report on the analysis, EDF calls for the State of low as 0.1% and as high as 10% or more in others.19
Texas to eliminate permanent flaring permits, require Figure 13 includes all recent studies that examine
new technologies, improve reporting processes and either the full natural gas supply chain or individual
requirements, and eliminate the current exemption oil and gas producing regions where most emissions
for flared gas from the state’s 7.5 % natural gas tax to appear to occur. At the left side of the figure, results
incentivize operators to limit flaring. from three of the most comprehensive studies (each
a meta-analysis in its own right) appear alongside
Officials of the TRCC, testifying at a hearing
two recent EPA estimates, while the right side of
of the Senate Natural Resources and Economic
the figure illustrates the range of estimates from
Development Committee on January 30, 2019,
studies from specific regions. The left side data shows
stated that agency did not believe the EDF study to
the most recent figure of about 1.2% for overall
be accurate, but provided no evidence to refute its
losses across the system according to the EPA 2016
findings.
GHG assessment (25% of total U.S. anthropogenic
Energy in Depth, a research, education and public methane emissions or a 343 Bcf loss from extraction
outreach campaign funded by the Independent to distribution), while the right side of the graph
Producers Association of America, stated that “EDF illustrates how wide a range of emissions are possible
and S&P relied on a top-down approach to isolate across various elements of the overall system.
data from subsets of the Permian basin and state-
17
EDF, 2019, “Satellite data confirms Permian gas flaring is double what companies report”
18
EID, February 2019, “Data Limitations Raise Questions about Environmentalists’ Claims on Permian Flaring”
19
Rami, D. and G. Aldana, 2018, “Understanding a New Study on Oil and Gas Methane Emissions”
14 NATURAL GAS FLARING AND VENTING: STATE AND FEDERAL REGULATORY OVERVIEW, TRENDS, AND IMPACTS18%
16%
Methane Emissions (as % of gas throughput)
14%
12%
10%
8%
6%
4%
2%
0%
Alvarez et al 2018
Brandt et al 2014
Zavala-Ariaza et al 2015
EPA 2015
EPA 2016
Caulton et al 2014
Schneising et al 2014
Schneising et al 2014
Karion et al 2013
Peischl et al 2016
Howarth et al 2011
Jeong et al 2014
Petron et al 2012
Petron et al 2014
Robertson et al 2017
Burnham et al 2012
Robertson et al 2017
Schwietzke et al 2014
Peishcl et al 2015
Heath et al 2014
Karion et al 2015
Lyon et al 2015
Schwietzke et al 2017
Peischl et al 2015
Barkley et al 2017
Robertson et al 2017
Peischl et al 2015
Omara et al 2016
Robertson et al 2017
FIGURE 13. Methane emissions as a percent of gas throughput from recent studies. The five data points at left are either
meta-studies or annual EPA estimates for the whole natural gas system. Data at right represent individual studies targeting
elements of the system. Diamonds represent central estimates. Bars represent confidence intervals or high/low estimates.
Figure based on data from cited studies, courtesy of Daniel Raimi and Gloria Aldana, Resources for the Future. (Source)20
Researchers measure methane emissions from the for Crude Oil and Natural Gas Production,
oil and gas sector using “top-down” and “bottom- Transmission and Distribution for which
up” approaches. The top-down process estimates Construction, Modification or Reconstruction
emissions using methane sensing equipment Commenced After August 23, 2011, and on
attached to tower networks, aircraft, drones, or or before September 18, 2015”) focuses on
satellites. While the bottom-up method measures rules regarding hydrocarbon emissions from
emissions using methane detection and measurement onshore facilities such as storage vessels (tanks),
equipment at or near the source (e.g., near continuous bleed pneumatic controllers,
compressors, at wellheads, within gas processing reciprocating and centrifugal compressors,
facilities) and then extrapolate those measurements hydraulically fractured wells, equipment leak
to produce broader estimates. detection and repair, SO2 sweetening units, and
glycol dehydrators. The final Quad O regulation
Federal Flaring and was issued on August 16, 2012.
• Quad Oa – In August 2016, Quad O was
Venting Regulations amended and finalized to include additional
Federal laws related to oil and natural gas production regulations, called 40 CFR Part 60, Subpart
equipment and flaring include the following: OOOOa, which regulates sources of volatile
organic compounds (VOCs) and GHGs that
• Quad O – 40 CFR Part 60, Subpart OOOO
were left unregulated under Subpart OOOO
(“Quad O” or “Standards of Performance
20
https://www.resourcesmag.org/common-resources/understanding-a-new-study-on-oil-and-gas-methane-emissions/
NATURAL GAS FLARING AND VENTING: STATE AND FEDERAL REGULATORY OVERVIEW, TRENDS, AND IMPACTS 15(e.g., sources such as hydraulically fractured well as mandating that companies prepare plans
oil well completions, pneumatic pumps for minimizing waste before getting drilling
and fugitive emissions from well sites and approvals.
compressor stations). • EPA New Source Performance Standards –
• Waste Prevention Rule – The Bureau of Land On September 11, 2018, the EPA proposed
Management’s (BLM’s) “Waste Prevention, changes to the 2016 New Source Performance
Production Subject to Royalties, and Resource Standards for the oil and gas industry. The
Conservation, Final Rule” also known as the proposal included changes to the frequency
“Waste Prevention Rule” (81 Federal Register for monitoring fugitive emissions at well sites
83008, November 18, 2016) was promulgated and compressor stations, requirements for
under the authority of the Mineral Leasing pneumatic pumps at well sites, requirements
Act (MLA) of 1920. Section 225 of the MLA that a professional engineer certify certain
requires BLM to ensure that lessees “use all technical actions, and clarification of the
reasonable precautions to prevent waste of oil or acceptable location of separators used during
gas developed in the land.” BLM’s rule targeted well completions.
natural gas emissions as a potential waste of Individual states also have their own standards for
public resources and loss of royalty revenue. controlling air quality as it relates to oil and gas
BLM’s rule required operators of crude oil and production, including flaring regulations that may
natural gas facilities on federal and Indian lands involve permitting and reporting requirements. These
to take various actions to reduce the waste of regulations vary considerably from state to state. A
gas, established criteria for when flared gas will number of state agencies also collect data on flaring
qualify as waste and therefore be subject to and venting activity. However, in many cases, the data
royalties, and clarified which on-site uses of gas is submitted voluntarily, and there are no uniform
are exempt from royalties. In September 2018, reporting requirements.
the current Administration finalized a rollback
It should be recognized that flaring of associated
of the previous Administration’s limits (the
natural gas is driven by a number of factors that
2016 Waste Prevention Rule, also known as the
can be impacted by federal, state, and local laws
Venting and Flaring Rule) on methane that is
and regulations beyond those directly related to
leaked, vented, or flared from oil and gas wells
flaring or air quality. These include, for example,
on federal lands when BLM issued a final rule
efforts to restrict or encourage natural gas pipeline
scrapping a requirement that energy companies
construction (lack of pipeline infrastructure or its
seek out and repair leaks and requirements
timely construction increases the need for flaring)
for reducing emissions from well completion,
and local laws focused on noise and light pollution
storage vessels, and pneumatic controllers, as
(large flares are both noisy and bright).
16 NATURAL GAS FLARING AND VENTING: STATE AND FEDERAL REGULATORY OVERVIEW, TRENDS, AND IMPACTSOverview of Federal Policy
Current and Pending Federal that the rule could lead to the premature plugging
of wells before the end of their productive life. The
Regulatory Actions on Natural rule was to be applied not only to future wells on
Gas Flaring and Venting federal lands, but also to previously drilled wells,
requiring the retrofitting of equipment on marginal
The federal role in regulating oil and natural gas
wells. For producers who had leases with landowners
production focuses primarily on environmental
that might revert to federal mineral ownership at
protection, which, in the case of flaring and venting,
some point in the future, those wells would have
is focused on air quality. The EPA sets standards on
become subject to the venting and flaring rule at the
air quality under the authority of the Clean Air Act
time of reversion back to federal ownership. BLM
(CAA). In most cases, the EPA allows states to develop
justified the rollback in part by saying the rules
and implement the regulations necessary to meet
were redundant because the EPA also has methane
federal standards. In a few areas, the EPA’s regulatory
regulations. Now, the rollback of the venting and
role is more direct, as mentioned previously. Also,
flaring rule is being challenged in court by California,
BLM has the authority to regulate oil and natural gas
New Mexico, and environmental groups.22
production activities taking place on federal lands.
Current actions in these areas are listed below. EPA New Source Performance Standards – The EPA
announced plans to change course on the regulation
BLM Venting and Flaring Rule – The most impactful
of methane and other emissions from the oil and
recent change in federal regulations related to natural
gas industry. The CAA New Source Performance
gas flaring and venting was the Administration’s
Standards promulgated toward the end of the
2018 rollback of the previous Administration’s limits
previous Administration aimed to limit emissions of
on methane leaked, vented, or flared from oil and
methane and volatile organic compounds from oil
gas wells on federal lands. BLM issued a final rule
and gas facilities through leak detection and repair
removing the requirement that companies seek
requirements (81 Fed. Reg. 35824 - June 3, 2016). The
out and repair leaks, requirements for reducing
EPA has proposed revisions to respond to previous
emissions from a variety or equipment elements,
public comments and to streamline implementation
and requirements that companies prepare plans for
of the rule. Key changes would reduce the frequency
minimizing waste before getting drilling permits.
of required leak monitoring, extend the amount of
What had been known as the Venting and Flaring time operators have to repair detected leaks, and
Rule was tied up in the courts (Montana, Wyoming, carve out exemptions to certain detection and repair
and industry lobby groups challenged the rule),21 but, requirements. The EPA accepted public comments
if implemented, it would have required producers to through December 17, 2018, and has not issued a final
install emissions control equipment on wells where rule, but it seems likely that a final rule will be issued
it was not economic to do so. The producers argued during 2019.23
21
BLM, 2018, “Current Status of Waste Prevention Rule – Partially In Effect”
22
EDF, 2018, “EDF, Allies File Lawsuit Challenging Trump Administration Attack on Methane Waste Standards”
23
Wilmer Hale 2019, “Climate Change Revisions Lead to an Uncertain Regulatory Environment”
NATURAL GAS FLARING AND VENTING: STATE AND FEDERAL REGULATORY OVERVIEW, TRENDS, AND IMPACTS 17U.S. District Court for DC Ruling With Regard to In 2017, the D.C. Circuit Court held that FERC
BLM Wyoming Leases – A decision by the United must consider and analyze downstream emissions in
States District Court for the District of Columbia conducting its review of the National Environmental
(Wildearth Guardians vs. Zinke, et al.) on March 19, Policy Act (NEPA). In May 2018, however, a majority
2019 found that the previous Administration violated of FERC commissioners denied a rehearing request
federal law by failing to adequately take into account and indicated that FERC’s previous practice of
the climate change impact of leasing public land for analyzing upstream and downstream GHG emissions
oil gas drilling in Wyoming.24 The decision, which and the potential climate impacts was generic
applied specifically to a 2015 to 2016 plan by the and speculative. That denial, and FERC’s refusal
Interior Department’s Bureau of Land Management to analyze GHG emissions in its review, has been
to lease several thousand acres of land for drilling challenged in the D.C. Circuit Court and is currently
in Wyoming, concluded that the agency was legally being briefed.26
required to consider the climate impact of all such
Council on Environmental Quality (CEQ)
lease sales for fossil fuel development. The ruling
(Executive Office of the President) – On March
found that under the National Environmental Policy
28, 2017, The President signed Executive Order
Act of 1970, federal agencies are required to consider
13783, Promoting Energy Independence and Economic
and quantify the effect of the possible planet-
Growth, which, among other things: (1) directed
warming emissions associated with the fossil fuels to
CEQ to rescind its Final Guidance on Consideration
be extracted from the sales of such leases, and that
of Greenhouse Gas Emissions and the Effects of
BLM did not adequately quantify the climate change
Climate Change in NEPA Reviews, 81 Fed. Reg.
impacts of oil and gas leasing. If the ruling holds up
51866 (August 5, 2016); and (2) withdrew the Social
under appeal, it would require the quantification
Cost of Carbon tool for climate change impact
of any flaring and venting activities associated with
analysis. On April 5, 2017, CEQ published a notice in
the exploration, drilling, producing, processing,
the Federal Register announcing the withdrawal of its
transportation, distribution and use of the natural gas
GHG guidance. However, some courts are continuing
developed on BLM leases, and the resulting impact
to require an analysis of GHG impacts of proposed
on global warming. The Western Energy Alliance, a
actions, which creates continuing uncertainty.27
coalition of fossil fuel companies that joined with the
Interior Department in the case, called the decision Congressional Action – On February 12, 2019,
“ripe for successful appeal.”25 the U.S. Senate passed the Natural Resources
Management Act, a bipartisan bill that designates
Federal Energy Regulatory Commission (FERC)
about 1.3 million acres of wilderness areas, creates six
– FERC has shifted its policy for analyzing upstream
new National Park Service units, and permanently
and downstream GHG emissions associated with its
reauthorizes the Land and Water Conservation Fund
review of natural gas projects. Since 2016, FERC’s
(LWCF), but includes no new regulations regarding
practice had been to include in its pipeline orders
venting or flaring of natural gas. The President is
estimates of upstream and downstream emissions.
expected to sign the bill if it passes the House.
24
https://ecf.dcd.uscourts.gov/cgi-bin/show_public_doc?2016cv1724-99
25
https://www.nytimes.com/2019/03/20/climate/wyoming-climate-change-drilling-interior.html
26
Ibid
27
Ibid
18 NATURAL GAS FLARING AND VENTING: STATE AND FEDERAL REGULATORY OVERVIEW, TRENDS, AND IMPACTSAssess Potential Federal
Impediments to Oil and Natural
Gas Production
Currently, assuming that the legal challenges to the
venting and flaring rule rollbacks are unsuccessful,
there are no significant impediments to oil and
natural gas production derived from federal
regulations on natural gas flaring and venting.
Impediments are more likely to arise at the state and
local levels and will likely take the form of:
• Legal challenges to the construction of oil and
natural gas pipelines by citizen, tribal, and
environmental groups, or
• Passage of state regulations or local ordinances
that restrict the flexibility of operators in
developing leases (e.g., setback rules, zoning
laws, conditional use permits).
Such legal challenges or regulatory efforts can face
significant legal obstacles depending on the state.
Given that the largest and most active tight oil plays
(where significant volumes of associated gas are being
flared) are in states where such local regulations have
not proven to be successful in the past, it is unlikely
that any of these challenges will have a significant
impact on the restriction of flaring in the near future.
NATURAL GAS FLARING AND VENTING: STATE AND FEDERAL REGULATORY OVERVIEW, TRENDS, AND IMPACTS 19Analysis of State Policies and
Regulations
North Dakota, both with significant oil and gas
Summary of Impacts and drilling and production activity and gas flaring.
Trends The factors listed in Table 4 (and similar tables for the
The 32 oil- and gas-producing states are grouped into other two categories) are chosen as indicators of the
three categories for purposes of discussion.28 The likelihood of potential near term or future methane
first category (Category I) includes the two states emissions from the oil and gas sector. The first
with relatively high levels of natural gas flaring, where column (Gas Flaring) is indicative of the degree to
there is a likely chance that these levels will increase which natural gas flaring is currently being practiced.
before infrastructure can be put in place to curtail The second column is an indication of the potential
it. Category II includes states where relatively minor for future development of oil plays with associated
amounts of flaring take place but where the chances gas, based on our understanding of undeveloped
of that increasing are also relatively small. Category resources. The third column is an estimate of
III includes states where there are very minor the relative degree of current methane emissions
instances of flaring and venting and with few known based on a simple visual inspection of Figure 8, the
opportunities for any significant development of oil distribution of oil and gas sector methane emissions
plays with associated gas that would require flaring. (2012 data). EPA does not publish state-by-state
estimates of methane emissions from the oil and gas
Category 1 States (States with Significant Ongoing sector. Columns 4, 5 and 6 are 2017 data from the
and Increasing Flaring Activity) EIA website for flared and vented gas, associated gas
As shown in Table 4, this group includes Texas and production and oil production, respectively.
TABLE 4. Category 1 States Relative Flaring and Venting Indicators
EIA 2017
Undeveloped EPA GHG EIA 2017 Flared EIA 2017 Oil
Associated Gas
State Gas Flaring Associated Gas Emissions and Vented Production
Production
Potential Estimate (2012) (MMcf) (MMBbls)
(MMcf)
Texas Significant Yes Very High 101,001 1,856,908 1,273
North
Significant Yes High 88,504 9,590 392
Dakota
MMcf – Million cubic feet MMBbls: Million barrels
28
As an addendum to this report, thirty-two individual fact sheets for oil- and gas-producing states were prepared. These fact sheets summarize the
individual state natural gas flaring and venting regulations, provide links to information sources, and list relevant state contacts. They also provide
annual statistics for oil and gas production, flaring and venting and producing wells for the period 2013-2018. Most of these data are obtained from
EIA and referenced as such. Data obtained from individual states are also referenced. Flaring and venting and production data provided in the state-
by-state discussions in the following sections of this report rely heavily on data from the EIA website and this source is referenced specifically, unless
otherwise as noted.
20 NATURAL GAS FLARING AND VENTING: STATE AND FEDERAL REGULATORY OVERVIEW, TRENDS, AND IMPACTSTEXAS
The TRRC has jurisdiction over the permitting in Texas in 2017. The other 19 counties across the
of flaring operations in Texas. The Commission’s state having more than 1,000 flares, accounted for a
Statewide Rule 32 (16 Texas Administrative Code total of 47,553 flares and nearly 40% of the gas flared
§3.32) allows an operator to flare gas while drilling in Texas in 2017. (See Appendix A for a more detailed
a well and for up to 10 days after a well’s completion discussion of TRRC flaring data.)
to conduct well potential testing. The majority of
Flaring has increased significantly in Texas since
flaring permit requests the TRRC receives are to
2010, primarily due to the development of tight oil
permit flaring of casinghead gas from oil wells.
plays in the Permian Basin and the Eagle Ford play in
Flaring of casinghead gas for extended periods of
south central Texas (Figure 15). From 2016 through
time may be necessary if the well is drilled in areas
May 2018, the TRCC issued more than 6,300 permits,
new to exploration where pipeline connections are
allowing companies to flare across the Permian Basin
not available until after a well is completed and a
alone. By comparison, between 2008 and 2010, the
determination is made about the well’s productive
TRCC issued fewer than 600 flaring permits for all
capability. Other acceptable reasons for flaring
of Texas.30 The EIA data shown in Figure 14 indicates
include processing plant shutdowns, downstream
that flaring of gas in Texas has fluctuated between 1%
repairs or maintenance, or existing gas pipelines
and 1.3% of total gas produced during 2013-2017.
reaching their capacity.
But in the Permian Basin, the share is 3%, with some
The analysis of TRRC flaring permits and reported individual companies flaring considerably more (e.g.,
flare volumes indicate that, of the 254 counties in WPX Energy Inc. flared 10% of the Permian gas it
Texas, 200 have permitted flares operating. In 2017, produced in the first quarter).31 Some companies
there were roughly 97,000 flares in Texas. Within are making efforts to reduce flaring by restricting
the 22 counties that make up the Permian Basin, production or building the infrastructure needed
there were about 6,000 flares, which accounted for to gather the gas. Royal Dutch Shell PLC flared
about 12% of the gas flared in 2017 in the state. The at among the highest rates of large Permian gas
26 counties that encompass the Eagle Ford play had producers in the first half of 2018, between 7% and
15,423 flares and accounted for 35% of the gas flared 9%, but reduced to 2.5% in July 2018.32
29
Note: In the case of North Dakota, the question that arises when viewing the data in this table is: How can the volume of gas vented and flared be
so much greater than the volume of associated gas being produced? The EIA uses a gas/oil ratio (GOR) of 6,000 cubic feet per barrel to define the
boundary between “gas from gas wells” and “gas from oil wells.” A GOR of 6,000 means that the gas is from a gas well. This cut off is defined in order for EIA to make valid compar-
isons among the states. In addition to gas production from both oil and gas wells, EIA also compiles “shale gas” and coalbed methane production
data. According to EIA’s definition, gas from “shale wells” may also be considered associated gas if the “shale” play is actually a tight oil play. Most
associated gas in ND is produced from the Bakken “Shale” which is primarily a tight oil play. In this case, reported venting and flaring of natural gas
in ND is higher than associated gas as only EIA’s definition of gas from oil wells is being used and “gas from shale wells” should be added to it. For
further detail on how gross withdrawals from oil wells, gas wells, coalbed methane, and shale are classified refer to page 187 of EIA methodology at:
https://www.eia.gov/naturalgas/annual/pdf/appendix_a.pdf
30
Texas Tribune, February 2019, “Railroad commissioners voice doubts that Permian Basin flaring is more prevalent than reported”
31
WSJ, 2018, “In America’s Hottest Drilling Spot, Gas Is Going Up in Smoke”
32
Ibid.
NATURAL GAS FLARING AND VENTING: STATE AND FEDERAL REGULATORY OVERVIEW, TRENDS, AND IMPACTS 21You can also read