Programme for Sustainable Urban Mobility South Africa - Tsamaya NAMA: Mitigation action seeking for support for the implementation - TRANSfer
←
→
Page content transcription
If your browser does not render page correctly, please read the page content below

Tsamaya NAMA

Programme for Sustainable
Urban Mobility South Africa

Tsamaya NAMA:
Mitigation action seeking for support for the implementation
As a federally owned enterprise, GIZ supports the German Government in achieving its objectives in the field of international
cooperation for sustainable development.

Published by:
Deutsche Gesellschaft für
Internationale Zusammenarbeit (GIZ) GmbH
Registered offices
Bonn and Eschborn

Deutsche Gesellschaft für
Internationale Zusammenarbeit (GIZ) GmbH
Postbox 5018
65760 Eschborn
Germany

T + 49 6196 79-0
E info@giz.de
I www.giz.de

T +49 61 96 79-0
F +49 61 96 79-11 15
E info@giz.de
I www.giz.de

Project:
TRANSfer Project – Towards Climate-Friendly Transport Technologies and Measures

Authors:
Andrea Henkel (GIZ, Eschborn)
Hanna Hüging (Wuppertal Institute, Wuppertal)

Supervision:
André Eckermann (GIZ, Eschborn)

Photo credits:
Cover: Durban, South Africa (Manfred Breithaupt)
Back: Pretoria South Africa (Andrea Henkel, GIZ)

URL links:
This publication contains links to external websites. Responsibility for the content of the listed external sites always lies with their
respective publishers. When the links to these sites were first posted, GIZ checked the third-party content to establish whether it
could give rise to civil or criminal liability. However, the constant review of the links to external sites cannot reasonably be
expected without concrete indication of a violation of rights. If GIZ itself becomes aware or is notified by a third party that an external
site it has provided a link to gives rise to civil or criminal liability, it will remove the link to this site immediately. GIZ expressly
dissociates itself from such content.

GIZ is responsible for the content of this publication.
Location and year of publication: Eschborn, 2017
DOT, GIZ (2017): Programme for Sustainable Urban Mobility South Africa (Tsamaya NAMA),
www.transport-namas.org/

Contact details of the DOT representative
Themba Tenza
Chief Director: Research & Innovation
Department of Transport
TenzaT@dot.gov.za

Department of Transport
P Bag X193,
Pretoria, 0001, South Africa

Disclaimer:
The South African Department of Transport (DOT) and the Department for Environmental Affairs (DEA) thank the Deutsche
Gesellschaft für Internationale Zusammenarbeit (GIZ) GmbH (German Development Cooperation) for collaboration and technical
assistance in the preparation of this document. The collaboration with GIZ was conducted in the framework of the International
Climate Change Initiative within the project TRANSfer (Towards Climate Friendly Transport Technologies and Measures), which has
been commissioned to GIZ by the German Federal Ministry for the Environment, Nature Conservation, Building and Nuclear Safety
(BMUB). The opinions expressed in this document do not necessarily reflect the views of GIZ and/or BMUB.

Acknowledgements:
We would especially like to express our sincere gratitude to the following government officials and experts for their active
collaboration during the joint design phase of Tsamaya NAMA and their contributions to this document: Thema Tenza, Pulane
Manale and Bopang Khutsoa, Neels Basson (National Department of Transport), Reitumetse Molotsoane and Mashudu Mundalamo
(National Department of Environmental Affairs), Alex Bhiman (City of Johannesburg, Transport Authority), Louis Naudé (WWF),
Carel Snyman (SANEDI), Sebulefe Dyodo (SALGA) and Mathetha Mokonyama (CSIR).
Furthermore, we would like to thank Linda Phalatse and Christian Mettke (GIZ) for their valuable support to the concept design,
Kirsten Biemann and Christoph Heidt (Ifeu - Institut für Energie- und Umweltforschung) for their expertise in emission calculation and
Robin Kaenzig (Integrated Transport Planning Ltd) for his assistance in estimating financing needs.

© Partial or total reproduction of this document is authorized for non-profit purposes, provided the source is acknowledged.

ii
Table of contents
Executive Summary ............................................................................................................ 1
1    Introduction ................................................................................................................... 9
2    Overview of the urban mobility in South Africa ........................................................ 12
     2.1 The relevance of the urban mobility sector ............................................................ 12
     2.2 Urban mobility market players and their linkages .................................................. 15
     2.3 Finance for urban mobility in South Africa ............................................................. 18
     2.4 South African urban mobility policy in the context of climate change ..................... 20
     2.5 South African initiatives in the urban mobility sector .............................................. 24
     2.6 International cooperation with South Africa in urban mobility ................................. 26
3    Barriers to a low carbon urban mobility in South Africa .......................................... 28
4    The NAMA: Objectives, measures and impacts ........................................................ 32
     4.1 The NAMA in a nutshell ......................................................................................... 32
     4.2 Objective of the NAMA .......................................................................................... 33
     4.3 Scope / coverage of the NAMA ............................................................................. 34
     4.4 Mitigation measures under the NAMA ................................................................... 35
     4.5 Supportive and organizational measures............................................................... 40
     4.6 NAMA Coordination and management .................................................................. 43
     4.7 Way forward .......................................................................................................... 44
     4.8 Expected impacts .................................................................................................. 47
5    The MRV approach: Monitoring, Reporting and Verification ................................... 48
     5.1 Introduction ........................................................................................................... 48
     5.2 Qualitative analysis of GHG impacts ..................................................................... 48
     5.3 Qualitative analysis of sustainable development impacts ...................................... 50
     5.4 Monitoring ............................................................................................................. 58
     5.5 MRV set-up and process ....................................................................................... 60
6    Financing the NAMA ................................................................................................... 62
     6.1 Overview of costs .................................................................................................. 62
     6.2 Economic viability .................................................................................................. 66
     6.3 Secured funding and gaps..................................................................................... 68
     6.4 Need for financial support...................................................................................... 71
7    Bibliography ................................................................................................................. ix
8    Annexes ....................................................................................................................... xii
     8.1 Annex I. Assessment of availability and quality of transport planning data ............ xii
     8.2 Annex II. References on costs and revenues of urban transport in South Africa ... xiv

                                                                                                                                           iii
Programme for Sustainable Urban Mobility (Tsamaya NAMA)

                                                      List of tables
Table 1. Definition of BAU and mitigation scenarios ........................................................... 5
Table 2: Tsamaya NAMA at a glance ................................................................................. 7
Table 3: Key Data of South Africa ...................................................................................... 9
Table 4. Stakeholder overview on urban mobility in South Africa ...................................... 16
Table 5: National Expenditure programmes and subsidies in the transport sector ............ 18
Table 6: Implementation of integrated public transport networks supported by the PTNG 37
Table 7. Selected mitigation actions planned in Johannesburg......................................... 38
Table 8: Overview of supportive and administrative measures ......................................... 40
Table 9. Components and main stakeholders relevant for implementation ....................... 45
Table 10. On-going activities and measures in the pipeline by different stakeholders ....... 46
Table 11. Analysis of sustainable development impacts ................................................... 50
Table 12: Overview of the focus cities .............................................................................. 52
Table 13: Population in the pilot cities (metropolitan area) ................................................ 53
Table 14: Transport demand and modal split 2015 and 2030 (BAU) in the pilot cities ...... 54
Table 15: Modal split – share in total Pass-km- (2030) in the different scenarios .............. 55
Table 16: Efficiency of the different transport modes (in g CO2/ Pass-km) ........................ 56
Table 17: Estimated CO2 savings of Tsamaya NAMA compared to BAU.......................... 57
Table 18. Indicators on GHG Impact at national level ....................................................... 58
Table 19. Indicators on GHG Impact at local level ............................................................ 59
Table 20: Overview of organisational and supportive measures ....................................... 62
Table 21: Estimated costs for organisational and supportive measures ............................ 62
Table 22: Organisational and supportive measures and allocation of costs ...................... 62
Table 23. Assumptions on network infrastructure for different investment scenarios ........ 64
Table 24. Cost estimations per unit for investment costs .................................................. 64
Table 25. Investment costs for network infrastructure and vehicles per scenario per city . 65
Table 26. Investment costs for network infrastructure and vehicles (over 10 years) ......... 66
Table 27. Overview on secured funding for Tsamaya NAMA ............................................ 68
Table 28: Expenditure estimates of the PTNG .................................................................. 70
Table 29. Estimated costs per year national level and per city.......................................... 71

iv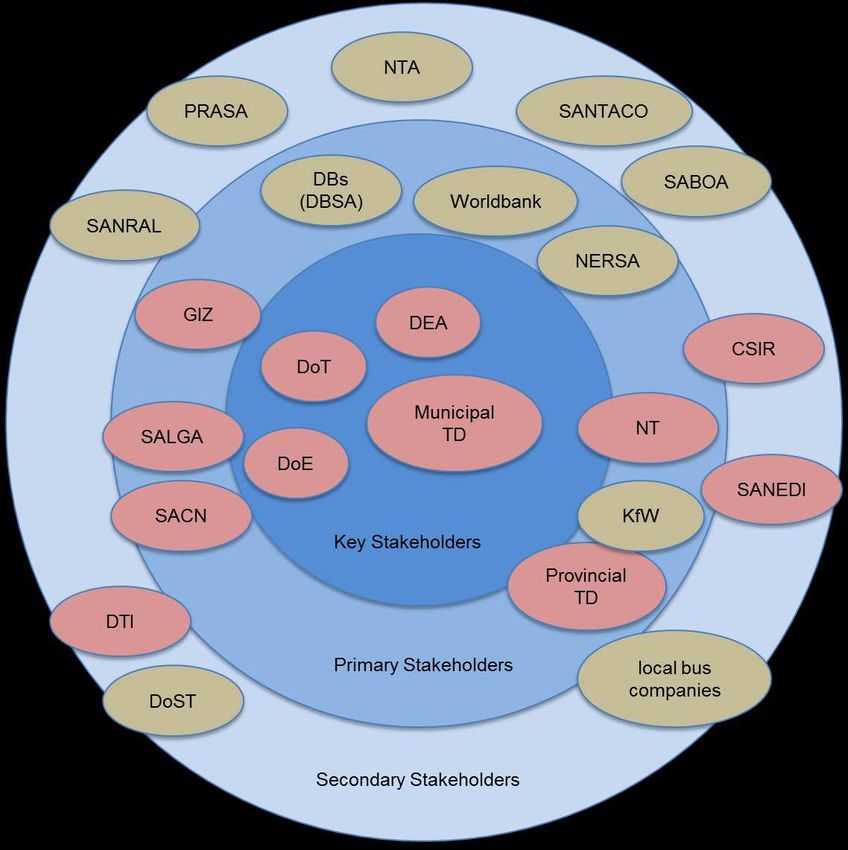
List of figures
Figure 1. NAMA Approach of Tsamaya NAMA ................................................................... 2
Figure 2: Components and Measures of the Tsamaya NAMA ............................................ 3
Figure 3. Building blocks of a sustainable urban mobility programme ................................. 6
Figure 4. Upscaling approach of the programm for sustainable urban mobility ................. 11
Figure 5: South Africa vehicle and human population growth trends................................. 13
Figure 6: GHG emissions from the Transport sector BAU South Africa, 2000–2050 ......... 13
Figure 7: Modal split in South Africa for work trips ............................................................ 14
Figure 8: Stakeholder landscape on urban mobility in South Africa .................................. 15
Figure 9. Minimum Contents of a Comprehensive ITP...................................................... 23
Figure 10: Overview of barriers and selected support measures of Tsamaya NAMA ........ 31
Figure 11. Overview of supportive and mitigation measures of Tsamaya NAMA .............. 33
Figure 12. Standardised process of supporting focus cities under Tsamaya NAMA ......... 42
Figure 13. Gant chart for the pilot phase of Tsamaya NAMA ............................................ 45
Figure 14. Monitoring and reporting approach of Tsamaya NAMA ................................... 48
Figure 15. Cause-Impact-Chain Tsamaya NAMA ............................................................. 49
Figure 16: GHG emissions calculation scheme for transport activities .............................. 52
Figure 17: Passenger transport CO2 emissions of the pilot cites in 2015 and 2030 (BAU) 55
Figure 18: Passenger transport CO2 emissions and mitigation potentials in 2030 ............ 57
Figure 19. Institutional setup for MRV of Tsamaya NAMA ................................................ 61
Figure 20: Number of buses in the cities in the different scenarios ................................... 65
Figure 21: Average cost recovery across different public transport modes in urban areas xiv

                                                                                                                       v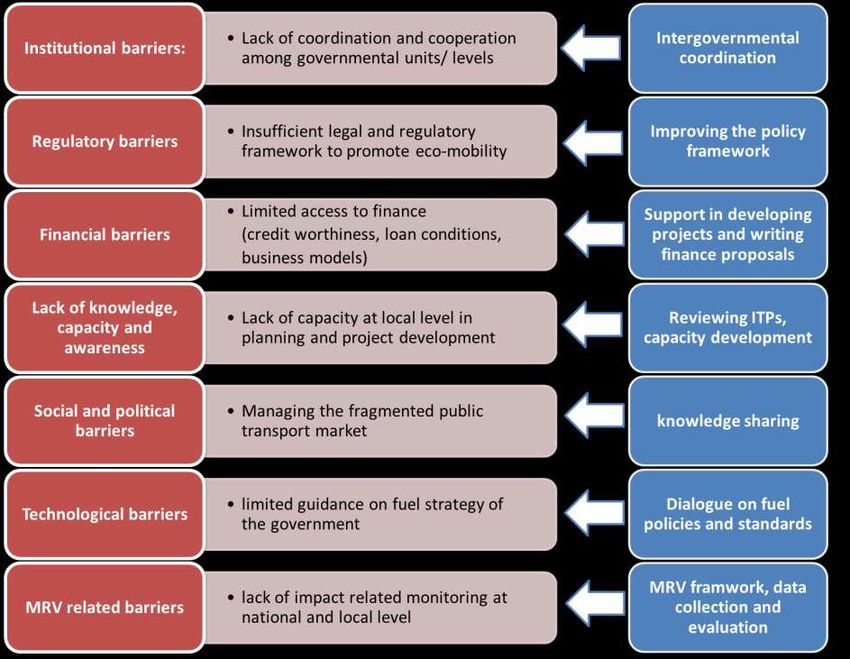
Programme for Sustainable Urban Mobility (Tsamaya NAMA)

                             List of acronyms and abbreviations
 AfD                African Development Bank
 AFOLU              Agriculture, Forestry and Other Land-use
 BAU                Business-As-Usual
 BCR                Benefit to Cost Ratio
 BMUB               Bundesministerium für Umwelt, Naturschutz, Bau und Reaktorsicherheit
                    (Federal Ministry for the Environment, Nature Conservation, Building and
                    Nuclear Safety of Germany)
 BRT                Bus-Rapid-Transit
 CBA                Cost-Benefit-Analysis
 CDM                Clean Development Mechanism
 CNG                Compressed Natural Gas
 CoGTA              South African Ministry of Cooperative Governance and Traditional Affaires
 CSIR               Council for Scientific and Industrial Research
 CTL                Carbon-To-Liquid
 DBSA               Development Bank of South Africa
 DEA                Department of Environmental Affaires
 DOE                Department of Energy
 DOT                Department of Transport
 DTI                Department of Trade and Industry
 EVs                Electric Vehicles
 GEF                Global Environmental Facility
 GHG                Greenhouse gas
 GIZ                Gesellschaft für Internationale Zusammenarbeit GmbH
 GTL                Gas-to-Liquid
 GTS                Green Transport Strategy
 HCV                Heavy Commercial Vehicles
 IIPSA              Infrastructure Investment Programme
 IPTN               Integrated Public Transport Network
 ITP                Integrated Transport Plan
 KfW                Kreditanstalt für Wiederaufbau (German development bank)
 LCV                Light Commercial Vehicles
 LULUCF             Land-Use, Land-Use Change and Forestry
 MBT                Mini-Bus Taxi
 MCV                Medium Commercial Vehicles

vi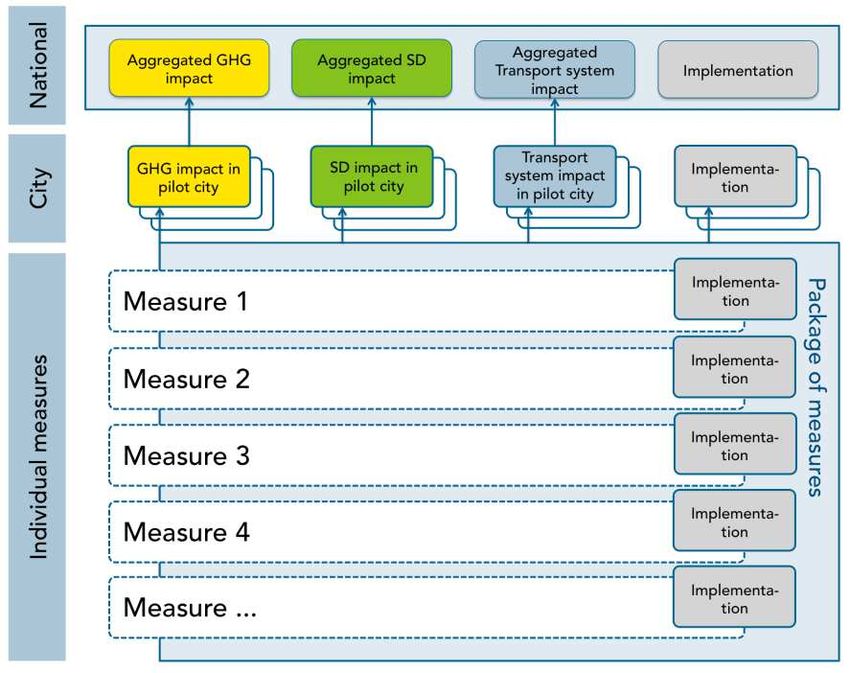
MoU       Memorandum of Understanding
MRV       Measuring, Reporting and Verification
NAMA      Nationally Appropriate Mitigation Action
NATAWO    National Transport and Allied Workers Union
NCCRP     National Climate Change Response Policy
NCOP      National Council of Provinces
NCSD      Committee on Sustainable Development
NDC       Nationally Determined Contribution
NERSA     National Energy Regulator SA
NFSD      National Framework for Sustainable Development
NLTA      National Land Transport Act
NMT       Non-Motorised Transport
NSSD      National Strategy for Sustainable Development
NTA       National Taxi Alliance
pkm       Passenger kilometres
PRASA     Passenger Rail Agency of South Africa
PT        Public Transport
PTNG      Public Transport Network Grant
SA        South Africa
SABS      South African Bureau for Standards
SACN      South African Cities Network
SALGA     South Africa Local Government Association
SANEDI    South African National Energy Development Institute
SANRAL    South African National Roads Agency limited
SANTACO   South African National Taxi Association
SATAWU    South African Transport and Allied Workers Union
SUM       Sustainable Urban Mobility
SUV       Sport Utility Vehicle
TIA       Technology Innovation Agency
ToD       Transit oriented Development
UNFCCC    United Nations Framework Convention on Climate Change
UNIDO     United Nations Industrial Development Organisation
USD       US-Dollar
vkm       Vehicle kilometres
ZAR       South African Rand

                                                                  vii
Programme for Sustainable Urban Mobility (Tsamaya NAMA)

                                           Exchange rates

                    Original     EUR                   USD           Date
                    Currency

                    1 ZAR        0.05765 EUR           0.06501 USD   16.06.2016

viii
Executive Summary
Motivation
The South African government aims to reduce the country’s Greenhouse Gas Emissions by 34%
below the Business-As-Usual (BAU) emission level until 2020 and by 42% until 2025. In its
nationally determined contribution (NDC) South Africa takes a peak, plateau and decline GHG
emission trajectory range. Between 2025 and 2035 emissions are projected to plateau followed
by a decline till 2050.
The transport sector is responsible for about 8.75 % of the country’s total GHG emissions (2010)
and has a share of 28% in the total energy consumption (2014) in South Africa. Emissions from
the transport sector rose continuously since 2000 and are projected to increase significantly till
2050 without additional GHG mitigation measures. Consequently, the National Department of
Environmental Affairs (DEA) identified the transport sector as key sector for a transition to a low
carbon economy in the 2014 Greenhouse Gas Mitigation Potential Analysis.
Urban mobility plays a particular role to achieve these targets as about 65% of the population lives
in urban areas. Emissions from urban transport are growing significantly due to strong motorization
growth and a modal shift from public transport towards private cars. Main drivers for this
development are increasing household income on the one hand and worsening infrastructure
quality and public transport services on the other. Inhabitants suffer from increasing congestion
as a consequence of rapidly rising motorisation rates in cities. At the same time, road safety is
worsening and currently, South Africa has the worldwide second highest traffic fatality rate per
person (negative impacts).
The South African government has already introduced several strategies and initiatives towards
sustainable urban mobility, partly with international assistance. With the Public Transport Network
Grant (PTNG), for example, the national government supports the implementation of integrated
rapid transit systems in 13 larger cities. However, many local governments are facing serious
challenges such as limited capacity and finance to identify and develop sustainable mobility
solutions, a lack of strategic guidance on fuel and technology options which are urgently needed
for public transport investments as well as social barriers towards modernising and reforming the
mini-bus taxi industry, (see as well barriers in figure below).
The current quantity and quality of sustainable transport projects and measures in cities and at
national is insufficient to achieve a transformation towards low-carbon mobility in South African
cities (Core Problem).
Objective
In 2015, the government has decided to develop a Nationally Appropriate Mitigation Action
(NAMA) to coordinate and unlock the potential of the different initiatives for sustainable urban
mobility. This will be done through a programmatic approach covering supportive measures at
national level and for municipalities as well as direct mitigation measures in 10 focus cities.
Tsamaya is the title of the National Urban Mobility Programme and means “go!” in the local
language Setwana and can be understood as “go for sustainable urban mobility”.

                                                                                                  1
Programme for Sustainable Urban Mobility (Tsamaya NAMA)
Tsamaya NAMA aims to reduce GHG emissions from urban transport through a national
programme approach which acts an incubator for projects and mitigation measures on
sustainable mobility in South African cities (Outcome).
NAMA approach
Tsamaya NAMA will systematically address the current barriers, which are considered to prevent
a transformational change towards sustainable urban mobility. The following graph illustrates key
barriers and the corresponding supportive measures of the programme. The national programme
will create a pipeline of well-prepared high-quality measures ready-for-implementation combined
with a solid financing concept. This will be achieved through technical assistance to selected
metropolitan cities, improved access to finance and capacity development. At the same time the
programme addresses challenges with regard to the national policy and regulatory framework and
to coordination and cooperation. In this way, Tsamaya NAMA will systematically improve the
conditions and create instruments to promote sustainable urban mobility.
Figure 1. NAMA Approach of Tsamaya NAMA
Tsamaya NAMA is building up on current initiatives and aims to increase their impact through
providing enabling conditions at national level and providing technical assistance to municipalities.
At the same time the programme will support municipalities in accessing different means of finance
associated with the cost of sustainable mobility measures.
The supporting and mitigation measures of the national programme cover the following aspects:
Component 1 – National policy and regulatory framework: National fuel and vehicle
policy and guidance (incl. light electric mobility), non-motorised-transport standards,
transport demand management;
2 Component 2 – Technical Assistance to pilot cities: Review of Integrated Transport
Plans, Pre-feasibility studies, Support in developing financing proposals;
Component 3 – Capacity development: Knowledge sharing platform, Tailor-made peer-
to-peer learning (trainings, on-the-job technical assistance, study tours);
Component 4 – Access to finance: Procurement benefit negotiations with the industry,
Low-carbon bus fund to promote clean technology, Upscaling of existing support
programmes (e.g. Cities Support Programme), guidance and transparency on financing
options.
Component 5 – Implementation of Mitigation Actions in 10 Focus Cities: Integrated
Rapid Public Transport, low carbon buses, last-mile-connectivity, transport demand,
management
Component 6 – Coordination and MRV: Political Steering Committee, inter-ministerial
coordination and “Tsamaya Dialogues” to foster stakeholder exchange, impact monitoring;
Figure 2: Components and Measures of the Tsamaya NAMA
Alignment with national policies
The added value of the Tsamaya NAMA includes improved coordination with different government
spheres, the creation of synergies of already existing initiatives and additional elements to create
a supportive environment for cities to promote sustainable mobility. Tsayama NAMA helps to
3Programme for Sustainable Urban Mobility (Tsamaya NAMA)
streamline ongoing efforts and to increase their visibility nationally and internationally. It brings
together the individual elements of a national urban mobility programme, which contribute to
reducing greenhouse gas emissions and achieving the Nationally Determined Contributions. In
this way, Tsamaya NAMA may help to increase outreach and to attract further support from
international donors. The key elements of already existing programmes and institutions in the
framework of Tsamaya NAMA are as follows:
1. The Public Transport Network Grant is a conditional grant of the National Department of
Transport which provides infrastructure funding to 13 municipalities. The estimated budget
expenses for the financial years 2015/16 to 2018/19 sum up to about 24.7 bn ZAR1 (USD
1.6 bn). The purpose of the PTNG is to provide funding for accelerated construction,
improvement of public and Non-Motorised Transport (NMT) infrastructure that form part of
a municipal integrated public transport network and to support the planning, regulation,
control, management and operations of financially sustainable municipal public transport
network services.
2. The City Support Programme (CSP) is an initiative of the National Treasury aimed at
providing implementation support to South African cities, specifically around human
settlements, public transport, economic development, and climate resilience and
sustainability. As of now the Worldbank, GIZ and SECO are providing technical assistance
to the programme in order to upscale the impact of the programme. CSP is considered as
an effective instrument to improve planning and to develop projects from a technical and
financial perspective.
3. The South Africa Local Government Association (SALGA) and the South African Cities
Network (SACN) are active in advocating the needs and demands of local governments
towards the national governments and in sharing knowledge and best practices among
their members. So far the outreach is limited in terms of topics due to capacity and budget
constraints. The organisations however have a strong connection and well established
communication channels to their members.
Figure 3 shows the main institutions, policies and programmes of the national government, para-
state organisations and international partners, which have a key role in supporting cities to develop
urban mobility. The illustration shows that there are already today several building blocks of a
sustainable urban mobility programme. The Tsamaya NAMA will help to unlock the potential of
the different efforts and create synergies that will lead to an increased impact, e.g. by coordinating
efforts on training and capacity development, by developing strategic guidance for procurement
decisions and by adjusting conditions to access of national funding by environmental standards.
Co-Benefits
The NAMA will contribute to the sustainable development goals of the National Development Plan
by improving human settlements through improved walking conditions and better public transport
1
National Treasury: Estimates of National Expenditure 2016
4which both contribute to the life quality in cities. Better transport services lead to improved access
to markets and infrastructure.
Tsamaya NAMA will also contribute to better Road Safety and thereby it is in line with the Decade
of Action for Road Safety Resolution of 2010. A comparison of the fuel consumption in different
scenarios shows that in 2030 between the Tsamaya plus scenario (see Table 1) and the BAU
scenario about 2.2 billion liters of fuel can be saved (including rebound effects from addition public
transport services). This translates into USD 1.1 billion per year for gasoline and USD 940 million
per year for diesel savings2.
Table 1. Definition of BAU and mitigation scenarios
See 5.3.1.2 for assumptions and further details
Scenario Definition
BASE (2015) Calculation of CO2 emissions based on the number of vehicles, Vehicle
kilometers travelled (VKT) per vehicle and year (city specific), vehicle
load, specific fuel consumption and GHG emissions factors (national
average data).
BAU (2030) Population growth in urban areas and overall improvements in specific
fuel consumption,
Tsamaya unilateral Implementation of the national urban mobility programme without
(2030) international support
Tsamaya plus (2030) Implementation of the national urban mobility programme with
international
Mitigation potential and MRV
The GHG mitigation impact of Tsamaya NAMA during the period of 2020 - 2030 is estimated to
reach between 13.5 and 30.4 MtCO2 cumulated, and 1.4 and 3.0 MtCO2 on average per year
between the Tsamaya unilateral and the Tsamaya plus scenario compared to the BAU scenario.
At the end of the period the annual mitigation impact between the mitigation scenarios and the
BAU scenario ranges between 2.5 and 5.5 MtCO2 per year in 2030.
Costs and Financing
The supportive and organisational measures sum up to about ZAR 50 million (USD 3.4 million)
for the pilot phase (2017 - 2019) with direct assistance to two cities and about ZAR 200 million
(USD 12.8 million) for the roll-out phase (2020 - 2026) with direct assistance to 8 more cities
receiving technical assistance three years each.
In total, the approximate investment costs for direct mitigation measures were estimated according
to the additionally required public transport capacity to accommodate the future passenger
2
Price for 1 liter gasoline: USD 0.92, 1 liter diesel USD 0.90, Nov 2016
5Programme for Sustainable Urban Mobility (Tsamaya NAMA)
kilometres. Comparing international examples of BRT and bus-based public transport investment
costs, it is expected that the required investment sums up to about ZAR 30 bn (USD 2 bn) for the
unilateral scenario and ZAR 92 bn. (USD 6 bn.) for the Tsamaya plus scenario. The required
funding for investment in network infrastructure of the Tsamaya plus scenario is about double the
amount of the unilateral scenario. The expenses for additional buses in the Tsamaya plus scenario
are estimated at nearly four times the amount of the unilateral scenario.
The direct mitigation actions will be financed through domestic sources of national and local
governments and private sector funding. The supportive measures will party be financed by the
Department of Transport and international donors through technical assistance projects. In
addition, the Department of Transport and the municipalities are seeking for international support
to finance project investment, for technical assistance to upscale the supportive measures at
national and local level.
Figure 3. Building blocks of a sustainable urban mobility programme
6Table 2: Tsamaya NAMA at a glance
National Institution: Department of Transport
Implementing Name of contact person: Mr. Themba Tenza (Chief Director: Research & Innovation)
Entity and Involved national partners: Department of Environment, Department of Energy,
involved South Africa Local Governments Association, South African Cities Network, City of
stakeholders Johannesburg; South African National Energy Development Institute (SANEDI),
Council for Scientific and Industrial Research (CSIR)
Involved supporting organisations: GIZ
Type of
National Programme
action
Type of - Public spending/ investments
policy - Regulations
instruments
Scope Geographical:
National level; 10 cities out of: Johannesburg, Cape Town, Ekurhuleni Metropolitan
Municipality (East Rand), Tshwane (Pretoria), Buffalo City, Polokwane, eThekwini
(Durban), Mbombela, Nelson Mandela Metropolitan Municipality (Port Elizabeth),
Mangaung Municipality (Bloemfontein), George, Rustenburg
Type of approach: Shift-Improve
Subsector: urban passenger transport
Transport modes: public transport; walking, cycling and light e-mobility
Main - Public transport network infrastructure
mitigation - Low Carbon Buses
measures - Improving Last Mile Connectivity
- Transport Demand Management measures
Timeframe Phase 1: Pilot phase (2017-2019)
Phase 2: Roll-out phase (2020-2026)
Expected - GHG mitigation: between 13.5 and 30.4 MtCO2 cumulated, and 1.4 and 3.0 MtCO2
GHG on average per year between 2020 and 2030 (unilateral scenario and Tsamaya
mitigation plus compared to BAU)
and further - Further benefits: improved air quality, public health, improved human settlement,
benefits better access to jobs and infrastructure, road safety
- Fuel savings: 2.2 bn liters per year. This translates into USD 1.1bn per year for
gasoline and USD 940 million per year for diesel savings3.
Costs Supportive measures:
- pilot phase: ZAR 50 million (USD 3.4 million) with direct assistance to 2 cities
- roll-out phase: ZAR 200 million (USD 12.8 million) with direct assistance to 8 cities
Direct mitigation actions
- ZAR 30 bn (USD 2bn) for the unilateral scenario (10 cities)
- ZAR 92 bn (USD 6bn) for the Tsamaya plus scenario (10 cities)
3
Price for 1 liter gasoline: USD 0.92, 1 liter diesel USD 0.90, Nov 2016
7Programme for Sustainable Urban Mobility South Africa
Financing The supportive measures will party be financed by the Department of Transport.
Further support is needed for the successful implementation of all components in 10
cities.
The direct mitigation actions will be financed from domestic sources of national and
local governments. In addition, the Department of Transport and the municipalities are
seeking for international financial support.
Type of Supported NAMA with unilateral elements
NAMA
Type of - Technical support for technical assistance to pilot cities
support - Capacity building support for individuals in government, planning and
requested management on sustainable urban mobility.
- Financial support for the implementation of direct mitigation actions in pilot
cities (project pipeline under development, financing instruments to channel
international support will be developed during the pilot phase)
81 Introduction
The South African government aims to reduce the country’s Greenhouse Gas Emissions by 34%
below the Business-As-Usual (BAU) emission level till 2020 and by 42% till 2025. In its intended
nationally determined contribution (INDC) South Africa takes a peak, plateau and decline GHG
emission trajectory range. Between 2025 and 2035 emissions are projected to plateau followed
by a decline till 2050.
The transport sector is responsible for about 9% of the country`s total GHG emissions and for
about 12 % of the CO2 emissions from energy combustion (52.7 Mt CO2 in 2014). More than 90%
of the transport GHG emissions are caused by road transport. Even though the share of transport
emissions within the country`s GHG profile is comparably low, South Africa represents almost
20% of the transport related CO2 emissions of whole Africa. Emissions from the transport sector
are growing continuously (by 32.2% between 2000 and 2010), and are projected to increase
significantly until 2050 without additional GHG mitigation measures. Consequently, the national
Department of Environmental Affairs (DEA) identified the transport sector as key sector for a
transition to a low carbon economy.
Urban mobility plays a particular role to achieve these targets as about 65% of the population lives
in urban areas. Emissions from urban transport are growing significantly due to strong motorization
growth and a modal shift from public transport towards private cars. Cities suffer from increasing
car dependency and congestions as a consequence of rapidly rising motorisation rates in South
Africa. Car ownership in South Africa stands at 124 cars/1000 population, for all vehicles at 190
vehicles/1000 population in 2014 (In the same year the rate referring to all vehicles was about 569
in the EU28, 102 in China and 289 in Mexico4).
Table 3: Key Data of South Africa
Population 54.956.920 (2015)
Urban population 65%
Population growth 0.99% (2016)
GHG emissions 544 Mt CO2e/year (2010)
GHG emissions from transport activities 47.61 Mt CO2e (2010)
Share of transport vs total GHG emissions 8.75 % (2010)
GHG per capita 8.86t CO2/year (2013)
Economic growth 1.5% (2014)
52.7 Mt CO2 (2014)
CO2 emissions from transport activities
(all African countries: 286.3 Mt CO2)
CO2 emissions from fuel combustion 437.4 MtCO2 (2014)
Share of transport CO2 emissions vs. total fuel
12.05%
combustion
Growth of transport emissions (2000-2010) 32.2%
Share of road transport emissions vs. total
91,56%
transport emissions (2000-2010)
4
http://www.oica.net/category/vehicles-in-use/
9Programme for Sustainable Urban Mobility South Africa
The South African government has already introduced several strategies and initiatives to support
sustainable urban mobility such as the Public Transport Strategy and Action Plan (2007), the Non-
Motorised-Transport Policy and the National Land Transport Act (2009). With the Public Transport
Network Grant (PTNG) the national governments supports the implementation of integrated rapid
transit systems in 13 larger cities5.
However, the current level of investments in sustainable transport infrastructure is not sufficient.
The majority of cities in South Africa face major challenges in identifying and developing
infrastructure projects that are investment ready and attractive for public and private financiers.
One of the reasons for the insufficient number of well thought out projects are missing or badly
prepared sustainable mobility plans and, respectively, a lack of coherent infrastructure project
ideas and supporting policy frameworks.
The current situation in most South African cities is characterised by the following:
Insufficient coverage and availability of public transport infrastructure and services;
Lack of integration between the different public transport modes;
Last mile connectivity is a barrier in using public transport;
Lack of infrastructure for pedestrians or poor quality of sidewalks and safe crosswalks;
Sustainable mobility projects (e.g. for cycling or light electric mobility such as e-bikes or
pedelecs) are often implemented standalone without long-term perspective.
This leads to a series of negative impacts such as:
Increasing levels of congestions,
increasing time for commuting,
Number of road fatalities,
Car dependency is worsening the mobility of the poor population;
Air pollution in urban areas is increasing.
Tsamaya6 NAMA aims to reduce GHG emissions from urban transport through a national
programme approach which acts an incubator for projects and mitigation measures on sustainable
mobility in South African cities (Outcome).
The core element of the NAMA is the Public Transport Network Grant of the Department of
Transport which supports 13 cities through infrastructure investments. The Tsamaya NAMA will
increase the impact of this programme through establishing a national urban mobility programme
which integrates on-going initiatives and adds puzzle pieces that are missing to overcome the
existing barriers.
5
City of Johannesburg, City of Cape Town, Ekurhuleni Metropolitan Municipality (East Rand), City of Tshwane (Pretoria), Buffalo
City, Polokwane, City of eThekwini (Durban), Mbombela, Nelson Mandela Metropolitan Municipality (Port Elizabeth), Mangaung
Municipality (Bloemfontein), George, Rustenburg
6
“Tsamaya” means “Go!” in Setwana (local language in South Africa)
10Figure 4. Upscaling approach of the programm for sustainable urban mobility
The NAMA follows an Avoid-Shift-Improve approach, while focusing on the ‘shift’ (shifting trips to
less carbon intense modes) and ‘improve’ (improving the energy efficiency of vehicles) element
(see Dalkmann and Brannigan 2007).
The NAMA concept was developed by the Department of Transport with technical assistance from
the GIZ TRANSfer project on behalf of the German Federal Ministry for the Environment (BMUB).
Further implementation partners are national government institutions such as the Department of
Energy (Fuel policies), National Treasury (Financing instruments) and the Department of
Environmental Affairs (Climate Change Policy Coordination and MRV) and financing institutions
South African Development Bank. Local governments and the respective provinces of the pilot
cities (Johannesburg) have the leading role in implementation of mitigation actions) as well as
transport operators and non-governmental organisations representing transport groups. National
and international organisations which are already supporting sustainable urban mobility in South
Africa are SANEDI, CSIR and SALGA / SACN as well as the KfW, the Worldbank and SECO.
It is foreseen by DOT to officially register the Tsamaya NAMA under the UNFCCC registry as
NAMA seeking international support. During the pilot phase (2017-2019), the concept of the SUM
programme will be refined and tested in cooperation with pilot cities, before it reaches out to a
larger set of cities in the second phase (2019-2025).
11Programme for Sustainable Urban Mobility South Africa 2 Overview of the urban mobility in South Africa 2.1 The relevance of the urban mobility sector During the last couple of years, greenhouse gas (GHG) emissions from the transport sector in South Africa have been rising significantly. Between 2000 and 2010, emissions rose by 32% (DEA 2014a). In the South African Greenhouse Gas Mitigation Potential analysis, the Department of Environmental Affairs forecasts a doubling of emissions by 2025 (and a threefold increase by 2050) compared to the level of 2000 under a business as usual scenario (see Figure 6) (DEA 2014b). In 2010, the total GHG emissions in South Africa were estimated at 544 Mt CO 2e/year (excluding forestry and land-use) (DEA 2014a). The contribution of the transport sector was estimated by Posada (2015) at 84.5 Mt CO2/year on a well-to-wheel basis7. According to the GHG inventory of the DEA (2014) GHG emission from transport activities were estimated at 47.6 Mt CO2e in 2010. The CO2 emissions from all modes contributed the most to the GHG emissions, while the CH4 and N2O emission contributions were relatively small (2.1% in 2010). From 2000 to 2010 transport had a share of about 10.8% of the energy-related CO2 emissions. In road transport the increase was mainly caused by the rising number of motor vehicle sales which grew from 4.2% in 2000 to 15.7% in 2010 (DEA 2014a). Upstream emissions from fuel production are high due to blending with carbon-to-liquid (CTL) and gas-to-liquid (GTL) fuels. Road transport is responsible for about 92% of the transport related GHG emissions in South Africa during 2000- 2010 (DEA 2014a). Private vehicles (cars and SUVs) and light commercial vehicles (LCV) are the largest source of GHG emissions, followed by medium and heavy commercial vehicles (MCV/HCV). Mini-Bus Taxis (MBT) are the largest source of GHG emissions in land-based public transport. In 2010 the transport sector employed about 392,000 people. Even though specific emission data is not available for the subsector, urban transport can be seen as major contributor to transport emissions. The eight metropolitan cities in South Africa are responsible for more than half of all petrol and diesel consumption in the country. As of 2015, about 65% of the total South African population lives in urban areas, and private motorised transport dominates for commuting trips in metropolitan and urban areas, followed by MBT (see Figure 7). South Africa is experiencing rising motorisation rates. About seven million passenger cars were in operation in 2016, representing about 60% of the total vehicle fleet. As of 2013, about 29% of the households had access to a car. On average, vehicles are older than 10 years. Petrol vehicles dominate in the passenger car and mini bus sector. 7 Well-to-wheel emissions include all emissions from feedstock or fuel production to vehicle operation including fuel processing and delivery. 12
Figure 5: South Africa vehicle and human population growth trends

                Sources: CSIR (2003), eNaTIS (2014), StatsSA (2013)

Figure 6: GHG emissions from the Transport sector BAU South Africa, 2000–2050

                                Source: DEA 2014b

                                                                                13
Programme for Sustainable Urban Mobility South Africa
Figure 7: Modal split in South Africa for work trips
100% 3 3 1 1.3 0.8 2.1 1.4
4 5 5
10.4
90% 21 21.1
23 23 26.2
24 27 23 9.2
80% 40.7
4 5 6.3
5 6 0.8
70% 6 6 7.6
6 5 5.7
7
12 9 9
60% 11 29.6 Other
0.5
28
26.5
24.1 Walk
50% 26 13.8
21
Train
25
24 24
40% Bus
Taxi
21.9
30% Car
43.6 41.1
20% 38 39 38.4
35
31 30 32
10% 21.7
0%
1996 1997 2001 2003 2009 2011 2013 Metropolitan Urban Rural
(2013) (2013) (2013)
Source: Own compilation based on Statistics South Africa - National Household Travel Surveys
The minibus taxi industry is a critical pillar of the South African public transport sector. Currently,
the taxi industry is the most available mode of transport to the largest number of transport users
across a variety of income and need segments. About 67% of the population uses mini bus taxis
as their prime mode of transport, and they are the second most important way of commuting after
private cars (DOT 2016). MBT industry is mostly informal, and it is estimated that up to 160,000
MBT in operation are non-registered (Martha, 2012), compared to the 120,000 officially registered
MBT (Walters, 2013). The number of buses or minibuses is about 30,000.
The sector is highly fragmented with about two vehicles per owner. The minibus taxis, while the
most prevalent mode of transport, are priced relatively high compared to other modes, partly
because they are not operationally subsidised like other public transport modes (CSIR, 2016).
Apart from dissatisfaction over prices, service quality and safety call for improvements.
Employment relations tend to be precarious and, for most workers, no formal contract of
employment exists. There are no national minimum labour standards and no standard formula for
wage payment. Workers comprise drivers, queue marshals, vehicle washers and, in some areas,
fare collectors. Responsibility for the employment of the different categories of worker is divided
between the taxi owners, their associations and drivers (ILO, 2003).
In most parts of the country, rail services are less developed. Metrorail commuter services are
available in Cape Town, Eastern Cape Province, Durban, greater Johannesburg, and Pretoria.
The Gautrain, South Africa’s only high-speed train, was inaugurated in 2010 and runs between
Johannesburg and Pretoria. The overall rail network in South Africa comprises about 20,247 km.
About 15,000 people are employed in passenger rail services.
14Non-motorised transport (mostly walking) is mainly limited to low-income households and rural
areas. South Africa is facing serious problems of traffic safety, and suffers from the worldwide
second highest traffic fatality rate per person (DoT, 2015). Every year, more than 10,000 fatalities
occur, mostly all caused by road-transport (Das and Burger, 2015). Pedestrians are especially
threatened by traffic accidents. Most fatalities are caused by motorised vehicles on the road, inter
alia, due to a lack of appropriate infrastructure for pedestrians.
2.2 Urban mobility market players and their linkages
Several stakeholders are relevant for urban mobility in South Africa including national and local
level stakeholders and public as well as private bodies. The stakeholders are clustered according
to their importance for the successful implementation of a national SUM Programme.
Figure 8: Stakeholder landscape on urban mobility in South Africa
(Stakeholders directly involved in the SUM Programme are marked red)
15Programme for Sustainable Urban Mobility South Africa
Table 4. Stakeholder overview on urban mobility in South Africa
Key stakeholders:
Department of Transport (DOT) is the main decision maker responsible for regulation of transportation.
Through the DOT, the government channels its regulations and sets transport policies, which are further
implemented by provinces, metropolitan and district municipalities. This includes the definition of roles for
the provision and management of public transport. The National Land Transport Act (NLTA) requires
municipalities to prepare Integrated Transport Plans (ITPs) for their area. However, this instrument is not
used to its full potential yet (see section 3). According to NLTA, the national government is responsible for
capacitating and monitoring provinces and municipalities that lack capacity or resources to perform their
land transport functions. The DOT is responsible for implementing the Transport Flagship Programme
under the National Climate Change Response Policy (NCCRP) and has to set emission reduction targets
for the transport sector (see 2.4).
Even though, DOT has a strong mandate to regulate the transport sector the enforcement of new policies
is often limited and therefore several programmes and programmes are lacking behind their targets.
Department of Environmental Affairs (DEA) is in charge for the coordination of all sectors with regard to
GHG emission mitigation in and the formulation of related strategies and programmes. DEA is responsible
for the National Climate Change Response Flagship programme (see 2.4) and supports the DOT in
implementing the Flagship on transport. DEA acts as link to international funding sources for infrastructure
and capacity building with an environmental focus. Furthermore, DEA has the mandate to manage air
pollution: the 2007 National Framework serves as DEA’s Air Quality Management Plan. All provinces are
obliged to develop AQMPs to reduce and monitor local emissions.
Department of Energy (DOE) is responsible for defining the national policy on fuels and energy use in the
transport sector. National Energy Regulator SA (NERSA) regulates fuels and prices in line with DOE.
Municipal transport departments are mainly concerned with the development of land transport policies
and strategies within their area. The largest metropolitan areas are governed by metropolitan
municipalities, while the remaining urban areas are divided into district municipalities, each of which
consists of several local municipalities. According to the NLTA they have to develop integrated transport
plans for the area and ensure that the plans are implemented and monitored. They have to provide
municipal public transport services. Municipalities and metropolitan authorities are responsible for the
construction of non-motorised transport (NMT) infrastructure on the roads assigned to them (is about 40%
of the national road infrastructure).
Primary Stakeholders:
Provincial transport departments supervise the development of operational plans by local governments
and their compliance with provincial plans. Where capacity is lacking, provincial departments are to assist
with the development of detailed plans in the short-term, but make efforts to develop the capacity of Local
Government in the long-term. Provincial departments have to ensure that national level policies are put
into action at local level. They provide provincial public transport services.
National Treasury manages the national finances including several transport related grants and
programmes. In consultation with the DOT the National Treasury sets funding guidelines, fuel levies and
taxes for the transport sector. It transfers national tax revenues to provinces and municipalities.
Development banks such as DBSA (Development bank of South Africa), KfW (German development
bank and others provide funding for the implementation of sustainable transport projects.
16South Africa Local Government Association (SALGA) is an autonomous association of municipalities.
Its task is to provide advice and support to municipalities in form of policy analysis, research and
monitoring and knowledge exchange. SALGA supports the interests of local government at the national
level and interfaced with parliament the National Council of Provinces (NCOP), cabinet as well as
provincial legislatures. Mandated by the Constitution of South Africa, SALGA acts as representative of
local governments.
SACN (South African cities network) is a subsidiary body of SALGA focusing on the eight metropolitan
municipalities in South Africa (i.e. Johannesburg, Buffalo city, eThekwini, Ekurhuleni, Mangaung,
Tshwane, Nelson Mandela Metropole, Msunduzi). SACN plays an important role in knowledge
management and capacity building. It provides learning platforms for instance on public transport, however
their outreach an capacity is limited and further support is required to achieve a systematic learning among
members. The network is financed by the participating cities, grant funding by the national Department of
Cooperative Governance and Traditional Affaires (CoGTA) and project based funding by other
departments.
International Implementation partners: GIZ has been supporting the DoT in developing this NAMA
concept and will provide technical assistance during the pilot phase, both on behalf of the BMUB (German
Ministry of Environment, Nature Conservation, Building and Nuclear Safety).
Worldbank, UNIDO (see section 2.5)
Secondary stakeholders:
Research institutions such as SANEDI (South African National Energy Development Institute), CSIR
(Council for Scientific and Industrial Research) and universities support the DOT in data collection,
analysis and in research on transport and provide advice on transport matters.
South African National Taxi Council (SANTACO) was established and is financed by the DOT as body
of the MBT industry. The organisation is divided in Provincial and Regional or District Taxi Councils, which
are powerful and do not always act inline with the national representation. SANTACO has only limited
influence on the taxi owners and drivers. The National Taxi Alliance (NTA) is the second strongest
association of the MBT industry, leading to competing interests of SANTACO and NTA.
Passenger Rail Agency of South Africa (PRASA) manages the national rail network as well as metrorail
in urban areas.
Local bus companies can be either operated by private actors or are set up by state authorities such as
the provincial departments of transport or municipal entities.
Department of Trade and Industry (DTI) is responsible to support the development of alternative fuelled
vehicles and approve vehicle standards through the South African Bureau for standards (SABS)
South African National Roads Agency limited (SANRAL) is responsible for the national road network
including NMT infrastructure along national roads.
17Programme for Sustainable Urban Mobility South Africa
2.3 Finance for urban mobility in South Africa
In the fiscal year 2015/2016, the national government allocated ZAR 53.6 billion (USD 3.5 billion)
to the transport sector. Thereof ZAR 20.7 billion (USD 1.3 billion) is transferred to provinces and
municipalities as equitable shares or conditional grants and ZAR 13 billion (USD 0.9 billion) to
departmental agencies such as the Passenger Rail Agency (Table 5). Public corporations and
private enterprises in the transport sector receive ZAR 18.2 billion (USD 1.2 billion). From a sector
specific perspective, road transport receives the largest share of the national budget in the
transport sector (ZAR 23.0 billion – USD 1.5 billion) followed by rail transport (ZAR 18.3 billion -
USD 1.2 billion) and public transport (ZAR 11.5 billion – USD 0.7 billion) (National Treasury 2016).
Table 5: National Expenditure programmes and subsidies in the transport sector
Fund/Programmes Expenditure 2015/2016
[Purpose] (in million)
ZAR USD
Public transport network grant (PTNG) (to provinces and 5,953 387
municipalities)
[Funding for accelerated construction and improvement of public and
non-motorised transport (NMT) infrastructure (capital costs). The
grant is transferred to 13 cities for technical design and construction
of their integrated public transport networks such as BRT systems.
The fund can be used for Public transport infrastructure including
planning and construction, maintenance and upgrading of dedicated
lanes, routes, stations, depots, control centres and related information
technology, fare systems and vehicles (in exception). And NMT
infrastructure that supports network integration (e.g. sidewalks,
cycleways and cycle storage at stations)
Public transport operations grant PTOG (to provinces) 4,399 286
[Subsidies for public transport operations such as vehicle operating
costs. The PTOG is usually administered by the provinces, which can
transfer budget to subsidise municipal bus services]
Provincial road maintenance grant 9,807 638
[Maintenance of provincial road infrastructure (roads maintenance,
disaster relief, roads in support of electricity generation)]
South African National Roads Agency 8,591 559
[Development and upkeep of national road network (infrastructure
investment)]
Passenger Rail Agency of South Africa 11,595 754
18[Maintenance and rehabilitation of passenger rail infrastructure; half of
the budget is dedicated to metro rail services, the other half is for long-
distance rail]
Passenger Rail Agency of SA: Rolling Stock 2,561 167
[Provision of new rolling stock]
South African National Taxi Council (SANTACO) 19 1
Taxi Recapitalisation Programme 331 22
Source: National Treasury (2016)
Domestic sources of finance
In addition to general tax revenues, several sector specific financing streams are available in
South Africa. The fees from the toll road network generate about ZAR 4 billion (USD 300 million).
These non-tax revenues remain with the South Africa Roads Agency and make up about 60% of
their budget. Non-tax revenues such as ticket sale revenues cover about 42% of the expenses in
passenger rail, which amount to about ZAR 11.2 billion (USD 700 million). Taxes on petrol and
diesel make up between 30 to 40% of the pump price and consist of general fuel levy, road
accident fund levy and customs, and excise levy. The general fuel levy generates about ZAR 56.7
billion (USD 3.6 billion) of revenues. About 18% thereof (ZAR 10.3 billion – USD 0.6 billion) is
directly transferred to municipalities. Additional revenues are generated by the CO2 emission
based motor vehicle emission tax.
The expenditures in municipalities are funded through three main income sources: revenues
from municipal services (e.g. revenues from water, electricity and waste removal, property rates),
the “equitable share” budget from nationally collected tax revenues (e.g. the fuel levy) and
“conditional grants” such as the public transport network grant. About 70% to 85% of the overall
municipal budget is generated from local sources. Similarly, provinces receive conditional and
unconditional budgets from the national level, while own revenues of provinces make up only 5%
of the budget in provinces. The Public Transport Network Grant (PTNG), managed by the DOT,
is the main national instrument to support the improvement of local public transport networks. The
eight metropolitan municipalities and five additional cities (i.e. Mbombela, Polokwane, George and
Rustenburg) receive funding under the PTNG. The grant supports the implementation of high
quality bus services. 80% of the grant is allocated to the cities on a fixed basis according to specific
criteria like city size. The remaining 20% are distributed by the DOT based on individual proposals
from the municipality. The budget of the PTNG has been increased continuously by 4.3% per year
between 11/12-14/15.
Most public transport services such as Metrorail, Gautrain, provincial bus services and Bus-Rapid-
Transit (BRT) systems in South Africa are subsidised. The subsidy either stems from national
streams such as the Public Transport Network Grant or the Public Transport Operations Grant, or
directly from provinces and municipalities if they own and operate the service. The MBT industry
does not receive any direct operational subsidies, but financial support for vehicle scrappage from
the taxi recapitalisation program.
19You can also read