Africa Insurance Barometer 2018 - Market Survey African Insurance Organisation
←
→
Page content transcription
If your browser does not render page correctly, please read the page content below

African Insurance Organisation

        Africa Insurance
        Barometer 2018
        Market Survey

FULL_SPREAD.indd 1                                       04.04.18 16:06
Africa Insurance Barometer 2018
                     No. 3 / May 2018

                     For more information about the report, please contact:
                     African Insurance Organisation
                     30, Avenue de Gaulle
                     P. O. Box 5860
                     Douala, Cameroon
                     Telephone:     (237) 233 42 01 63
                                    (237) 233 42 47 58
                     Telefax:       (237) 233 43 20 08
                     E-mail:        info@africaninsurance.net
                     Website:       www.african-insurance.org

                     To download a soft copy of the report, please visit:
                     www.african-insurance.org

                     Prepared by

                     © 2018 African Insurance Organisation
                     All rights reserved. No part of this publication may be reproduced, republished,
                     uploaded, posted, framed, modified, sold, transmitted or otherwise distributed in
                     any way, without the prior written permission of the publisher.

FULL_SPREAD.indd 2                                                                                      04.04.18 16:06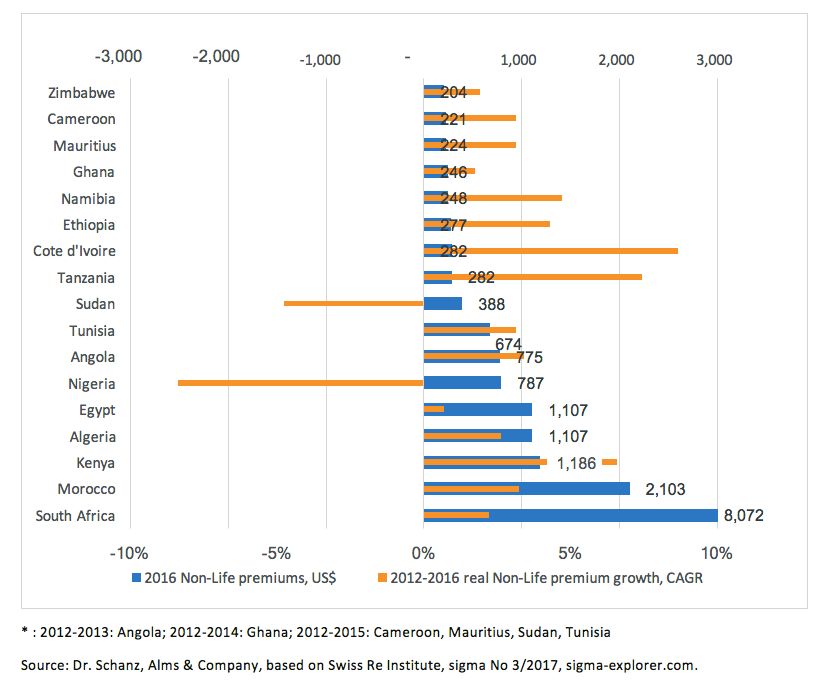
CONTENTS

                     Foreword                                                            5

                     Methodology                                                         6

                     Summary of Key Findings                                             7

                     Key Barometer Readings                                              9

                     Market Overview                                                    10

                     Survey Results                                                     26
                     1. The overall perspective: Strengths, weaknesses, opportunities   27
                        and threats of African insurance markets
                     2. General insurance market outlook                                32
                     3. Lines of business prospects                                     37
                     4. Key African insurance market challenges                         41
                     5. Measures to advance the insurance sector                        48
                     6. Overall African insurance business sentiment                    49

FULL_SPREAD.indd 3                                                                           04.04.18 16:06
FULL_SPREAD.indd 4 04.04.18 16:06
Foreword

                     It is with great pleasure that we present the        of our industry to create and deliver tailored
                     third edition of the Africa Insurance Barometer.     products to clients, our relevance as a key sector
                     Overall this year’s survey demonstrates that         for the prosperity and progress of Africa’s econo-
                     confidence is returning to Africa’s insurance         mies has never been greater.
                     markets. Insurance now plays a more prominent             For this report, independent research
                     role on our continent. Both policymakers and         consultancy Dr. Schanz, Alms & Company AG,
                     regulators pay greater attention to our sector       based in Zurich, interviewed 28 senior executives
                     while consumers have started to realise the bene-    of regional and international insurance compa-
                     fits insurance offers in protecting their assets.     nies and intermediaries operating in Africa
                     However, insurance penetration still remains low     and collated a broad yet nuanced picture of our
                     in Africa.                                           market place.
                           The Africa Insurance Barometer is one of            The Africa Insurance Barometer is made
                     our many efforts to help strengthen the insurance    possible thanks to the support of our AIO
                     markets in Africa. It aims to inform and provide     members, who volunteered to share their knowl-
                     transparency on current trends and developments      edge and expertise. We would like to thank each
                     of our industry, in particular for decision makers   and every one of you for your contribution.
                     from within the insurance sector and among                We hope that you will enjoy reading the
                     important stakeholders such as policymakers,         third edition of the Africa Insurance Barometer
                     regulators and clients.                              and will benefit from its findings.
                           Our industry currently accounts for insur-
                     ance premiums of US$ 60.7 billion, which in
                     US$ terms represents a decline over the previous         Prisca Soares
                     year. However, in local currency premium                 Secretary General
                     volume has not declined since 2011. In fact, with        African Insurance Organisation (AIO)
                     the advent of new technologies and the ambition

                                                                                                                                5

FULL_SPREAD.indd 5                                                                                                             04.04.18 16:06
Methodology
The findings of this report draw on in-depth and business development consultancy, conducted the
structured telephone interviews with 28 senior interviews between December 2017 and February
executives representing regional and interna- 2018.
tional (re)insurance companies and interme- The interviewees that participated in the
diaries. Dr. Schanz, Alms & Company AG, a survey were from the following companies and
Zurich-based research, communications and organisations based in the respective countries:
— Le Groupe Activa, Cameroon
— Africa Re, Nigeria
— AIICO Insurance, Nigeria
— Allianz SE, South Africa
— Blue Cross Insurance, Liberia
— CAAT (Compagnie Algérienne des Assurances), Algeria
— CCR (Compagnie Centrale de Réassurance), Algeria
— CIC Insurance, Kenya
— CKRe, United Kingdom
— Custodian and Allied Insurance, Nigeria
— Donewell Insurance, Ghana
— ENSA Seguros de Angola, Angola
— Ethiopian Re, Ethiopia
— First Mutual Life, Zimbabwe
— Ghana Union Assurance, Ghana
— International Insurance, Sierra Leone
— Kenindia Assurance, Kenya
— Leadway Assurance, Nigeria
— Lloyd’s, United Kingdom
— Misr Life Insurance, Egypt
— Munich Re, Africa
— Namib Re, Namibia
— NICO General Insurance, Malawi
— Reinsurance Solutions, Mauritius
— SCG Re, Gabon
— Swiss Re, Switzerland
— Tunis Re, Tunisia
— Willis Re, South Africa
6
FULL_SPREAD.indd 6 04.04.18 16:06Summary of Key Findings
— The continent’s strong underlying fundamentals continue to prove attractive for Africa’s
insurance markets. While the insurance markets benefit from Africa’s abundance of natural
resources, its young and growing societies, the expanding middle class and the advent of new
technologies, the recent economic recovery – though still fragile in some countries – adds further
momentum to the continent’s insurance outlook.
— As elsewhere, Africa’s insurance markets suffer from excess capacity and cut-throat competition.
As rates decline – more so in commercial lines than in the less volatile personal lines –
regulators start to shelter domestic insurers from foreign players with higher barriers of entry.
However, protectionism might prove a double-edged sword, weakening the market’s ability to
diversify risks and retain access to international expertise. Africa’s insurers often highlight the
lack of local talent, in particular in staffing key actuarial functions, where such skills are needed
to expand the existing product suite and reach out to broader customer segments.
— The continent’s low insurance penetration still presents one of the market’s largest opportunities.
As the economy rebounds, insurers have increased their efforts to broaden their product offering
and widen distribution. Technology provides new avenues for innovation, both in commercial
and personal lines. In addition, it helps to bridge geographical distances, increases scale and thus
improves efficiency.
— According to many of the executives interviewed for this year’s Africa Insurance Barometer,
regulatory frameworks have broadly improved and strengthened insurance markets. However,
the executives interviewed also note that rules are sometimes incoherent or inconsistent, and that
a tendency to overregulate now threatens to impact market initiatives. Competition is not just
excessive, and many executives regard current market conduct as unethical or irresponsible with
too many players «chasing the same cake».
— Nevertheless, Africa’s commercial insurance rates appear to have levelled-out at the bottom of
the pricing cycle. Although still low, there is a growing number of executives who expect rate
increases in the next 12 months, driven by stronger economic growth and the argument that
current rates have deteriorated to a point where the regulator will intervene to maintain market
safety. As in past surveys, the profitability of commercial lines masks the problem with rates –
historically, rates for African risks were harder, which still benefits today’s results. In addition,
recent claims experience has been low – at least in some markets.
— Personal lines are considered to be more stable. Competitive pressure is not as pronounced and
consumers’ brand loyalty is higher than among commercial clients. In addition, price differences
are less obvious to consumers, which is also due to a lower penetration of brokers in the personal
lines segment. In motor there is some pricing pressure due to higher claims, but it is unlikely to
move rates broadly. Profitability in personal lines has improved slightly in the past 12 months and
is expected to benefit from economic growth and the potential intervention of regulators.
— Continued and fierce competition is taking its toll on insurance growth. Only a third of the
interviewees expect premiums to outgrow GDP while another third predict that the two will
move in tandem. Price pressure still weighs heavily on top line volume while key markets like
South Africa struggle to accelerate growth.
— For the first time since the launch of this survey, the majority of interviewees said Africa’s
insurance regulation overall is adequate. However, interviewees would like to see more support
from regulators to increase insurance penetration, for instance by introducing compulsory
insurance in health, motor or commercial property. Over-regulation is a concern as insurers 7
FULL_SPREAD.indd 7 04.04.18 16:06fear that it reduces market liberties and limits business development. In addition, international
insurers are concerned about protectionism and although the intention is to protect domestic
businesses against excessive capacity, these markets run the risk of isolating themselves.
— Protection against natural catastrophe is perceived as even more inadequate in this year’s survey.
In light of record natural catastrophes losses experienced worldwide in 2017 and despite recurrent
floods and severe droughts, awareness for these risks is low in Africa. The actual exposures
that governments, enterprises or individuals bear are currently underestimated. In addition, risk
modelling is weak and rates are often either unaffordable or product coverage is inadequate.
— Despite a string of national elections across Africa in 2017, political risk protection is sparsely
purchased. Risk awareness and understanding of the product are low and willingness to pay
for cover is limited. Supply is also deemed insufficient. Those who seek protection, mostly
multinational corporations, turn to international insurers or the London market.
— The adequacy of local technical skills has improved slightly to 35 %, up from 30 % in prior
editions. However, with the exception of South Africa, talent for highly specialised functions
or experienced positions is difficult to recruit. Actuarial skills are particularly sought after in
product development and risk management to broaden the product offering and access market
segments which are less competitive but require more specialist know-how.
— Africa’s insurance markets are expected to become more concentrated. With the introduction
of tighter capital requirements, such as Risk Based Capital (RBC), larger players are better
positioned than smaller players, which have less access to capital and are expected to be acquired
or exit the market over time. However, interviewees no longer assume that non-African insurers
will outgrow their African counterparts. Protectionism makes it costlier for non-African
insurers to grow their footprint in Africa. As a result of declining rates and rising costs, Africa’s
insurance markets have become less attractive for foreign players. Several global insurers have
reallocated their capacity elsewhere, but regional players have been eager to fill the gap.
— To increase insurance penetration, African insurers invest heavily in marketing to build
awareness and overcome a lack of product understanding or low consumer confidence. In
addition, insurers are keen to strengthen their talent and skill base to take advantage of new
product and distribution opportunities. They broaden their offering to tap into demand that
emerges with the increase of disposable income and the deeper integration of the African
economy into the global production chain. Wider distribution channels will provide access to
remote client segments that had previously been too costly or inefficient to approach. As new
technology becomes available, barriers to market entry have come down. Finally, insurers aim
to work closely with regulators and policy makers to assure the implementation of directives and
laws that will strengthen the industry and possibly enforce the mandatory coverage of certain
risks.
— Business sentiment has slowly been recovering from the commodity crisis. In fact, 2016 could
mark the bottom of the cycle. For the current three years under review – the past, the present
and the coming year – executives are consecutively more bullish. However, the economic crisis
caused by the slump in commodity prices once again highlighted Africa’s dependence on
external developments beyond its control. Although the continent’s insurance markets benefit
from a young and growing population, Africa’s richness in natural resources, and its low
insurance penetration, business sentiment will still need time to return to the level of confidence
last seen around 2014 and 2015, when Africa included some of the fastest growing economies in
8 the world, such as Angola, Mozambique and Nigeria.
FULL_SPREAD.indd 8 04.04.18 16:06Key Barometer Readings
The Barometer measures current perceptions of
the African insurance market, tracking them over
time to monitor changes in attitudes.
Key readings (in % of respondents agreeing) May 2018 May 2017 May 2016
Insurance prices are currently low**
Commercial lines 69 % 87 % 70 %
Personal lines 36 % 40 % 74 %
Outlook: Insurance prices to remain stable or increase*
Commercial lines 69 % 50 % 62 %
Personal lines 76 % 75 % 60 %
Insurance profitability is currently low**
Commercial lines 46 % 57 % 57 %
Personal lines 20 % 30 % 45 %
Outlook: Insurance profitability to remain stable or increase*
Commercial lines 73 % 69 % 60 %
Personal lines 88 % 79 % 63 %
State of local skills inadequate 64 % 71 % 69 %
Protection against political risk exposures inadequate 71 % 70 % 64 %
Protection against natural catastrophes inadequate 71 % 67 % 65 %
Insurance premium to grow faster than GDP 37 % 52 % 48 %
Market structure to further concentrate*
Stable market structure 50 % 42 % 46 %
Market share of non-African owned insurance
companies to further increase* 26 % 43 % 50 %
State of insurance regulation inadequate 43 % 54 % 65 %
* Over the next 12 months
** Compared with a 3-year average
9
FULL_SPREAD.indd 9 04.04.18 16:06Market
Overview
10
FULL_SPREAD.indd 10 04.04.18 16:06Clear signs of an economic recovery
With an estimated GDP of US$ 2.25 trillion, of major regional currencies against the US$,
Africa represented approximately 2.8 % of the Africa’s annual compound average growth rate
world economy in 2017. In 2007, Africa’s share dropped to just 0.06 % for the past five years,
stood at only 2.6 %, indicating that the continent 0.5 percentage points below the global average.
outgrew the global economy during that period. Economic growth is expected to pick-up again.
However, in line with global economic weakness, While African GDP grew by 1.4 % in 2015 and
but also due to some domestic shocks such as the 2.7 % in 2016, the IMF expects growth rates of
decline in commodity prices and the devaluation 3.3 % in 2017 and 3.5 % in 2018.
Chart 1: Real GDP growth, largest African economies* (2012 – 2021f, compound annual
growth rates, in %)
10 %
9%
8%
7%
6%
5%
4%
3%
2%
1%
0%
World
Emerging Markets
Ethiopia
Côte d’Ivoire
DR Congo
Tanzania
Mozambique
Burkina Faso
Kenya
Cameroon
Mali
Senegal
Ghana
Namibia
Botswana
Uganda
Zambia
Gabon
Egypt
Angola
Sudan
Mauritius
Algeria
Madagascar
Morocco
Nigeria
Zimbabwe
Tunisia
South Africa
2012 – 2016
2017 – 2021 (estimates / forecasts)
Source: IMF, World Economic Outlook October 2017
*Chad, Equatorial Guinea and Libya were among the 30 largest African economies in 2016, but are not shown
here as the size of their economies decreased significantly from 2012 – 2016. 11
FULL_SPREAD.indd 11 04.04.18 16:06MARKET OVERVIEW
Although this trend indicates a steady improve- Africans. To capture the full potential of this
ment, these figures are still slightly lower than geographic dividend it is important that the
the forecasted global average growth, which is private sector creates sufficient employment.
projected to reach 3.7 % in 2017 and 3.9 % in Urgently needed productivity growth could be
2018. With an estimated growth of 5.6 % in 2017, partly achieved by shifting the labour force
up from 4.9 % in 2016, East Africa remains the from traditional, low-productivity sectors, such
fastest-growing sub-region. The outlook for two as subsistence farming, to high-productivity
of Africa’s largest economies is mixed: Nigeria sectors, such as modern agriculture, industry
may recover faster than previously expected, but and services. Higher productivity, investment in
prospects for South Africa are more subdued due human capital and the implementation of reforms
to an increased political uncertainty weighing on to attract investments in industries with a strong
investors’ confidence. competitive potential are factors that could
Africa will soon become the youngest and reduce poverty and achieve higher economic
second most populous continent. The UN esti- growth.
mates that of the 2.4 billon additional people
on the planet by 2050, more than 50 % will be
12
FULL_SPREAD.indd 12 04.04.18 16:06Economic transformation: Labour intensive growth strategies needed
On average, the agricultural sector contributes GDP. This is similar in Africa, although a much
3.8 % to global GDP and employs 26.5 % of the smaller share of its total workforce is currently
global workforce. In developing Africa, 53.1 % employed in the service sector (about 30 % of the
of the workforce are employed in agriculture, workforce contributing approximately 50 % to
contributing 15.3 % to GDP. The African GDP). The key future challenge for Africa will
agriculture sector is still largely characterised by be to create more employment in the secondary
small-scale subsistence production. and tertiary sectors, since the poor economic
Globally, the services sector generates performance of the agriculture sector poses a
the highest contribution to GDP per employee. major impediment to Africa’s development and
While employing about 50 % of the total global structural transformation.
workforce, the sector contributes nearly 70 % to
Table 1: 2017 employment distribution by economic sector
Region Agriculture Industry Services
World 26.5 % 23.9 % 49.6 %
Africa 53.1 % 15.0 % 31.9 %
North Africa 28.4 % 30.5 % 41.1 %
Sub-Saharan Africa 57.5 % 12.3 % 30.2 %
Central Africa 71.6 % 10.8 % 17.6 %
Eastern Africa 66.7 % 9.9 % 23.4 %
Southern Africa 8.5 % 27.0 % 64.5 %
Western Africa 44.5 % 14.3 % 41.2 %
Source: ILO modelled estimates
Table 2: 2015 GDP composition by economic sector
Region Agriculture Industry Services
World 3.8 % 27.2 % 69.1 %
Developing Africa 15.3 % 32.5 % 52.3 %
Developing Northern Africa 12.4 % 38.6 % 49.0 %
Developing Middle Africa 11.0 % 47.4 % 41.6 %
Developing Eastern Africa 26.3 % 22.8 % 50.8 %
Developing Southern Africa 2.6 % 30.3 % 67.0 %
Developing Western Africa 21.8 % 24.9 % 53.3 %
Source: UNCTAD STAT
13
FULL_SPREAD.indd 13 04.04.18 16:06MARKET OVERVIEW
Africa needs higher investments to achieve sustainable growth
Low investment levels in Africa are seen by most investments, while infrastructure investments
researchers as a symptom of underlying factors are crucial to attract private investment.
rather than the cause of low growth. A suitably Currently, it is estimated that the African deficit
skilled workforce, a better business environment in physical infrastructure reduces growth
and deeper financial markets are recognised by about two percentage points each year.1
as the most crucial factors to attract more According to the African Development Bank,
international and domestic private investment. In annual infrastructure investment requirements
addition, improving domestic revenue mobilisa- amount to US$ 130-170 billion.
tion should boost available resources for public
14 1
African Development Bank: Integrating Africa – Creating the next global market (2016)
FULL_SPREAD.indd 14 04.04.18 16:06Table 3: 2016 GDP, GDP per capita, population and investments, 30 largest African economies
Country 2016 GDP, 2016 GDP per 2016 2016 total 2016 foreign direct
US$ billion capita, US$ population, investment investment,
million (percent net inflows
of GDP)* (percent of GDP)**
Nigeria 405 2 208 184 12.6 1.1
Egypt 332 3 685 90 15.0 2.4
South Africa 295 5 302 56 19.4 0.8
Algeria 159 3 902 41 53.8 1.0
Morocco 104 3 004 34 32.6 2.3
Angola 95 3 485 27 8.4 4.6
Sudan 91 2 304 40 17.1 1.1
Ethiopia 73 795 91 38.5 4.4
Kenya 71 1 552 45 20.7 0.6
Tanzania 48 980 49 24.6 2.9
Ghana 43 1 551 28 14.5 8.2
Tunisia 42 3 749 11 22.5 1.7
DR Congo 39 467 84 11.8 3.4
Côte d’Ivoire 36 1 466 24 19.6 1.3
Cameroon 29 1 238 24 20.2 0.5
Uganda 25 692 37 24.4 2.0
Zambia 21 1 257 17 41.7 8.1
Libya 20 3 205 6 62.4 n.a.
Botswana 16 7 227 2 23.8 2.6
Zimbabwe 16 1 112 15 15.5 2.0
Senegal 15 943 16 26.9 2.7
Gabon 14 7 453 2 34.2 4.9
Mali 14 768 18 17.4 0.9
Mauritius 12 9 613 1 20.4 2.9
Burkina Faso 12 658 18 14.5 2.5
Namibia 11 4 709 2 25.7 2.9
Mozambique 11 392 29 42.7 28.4
Madagascar 10 401 25 15.2 5.4
Equatorial Guinea 10 12 399 1 10.4 0.5
Chad 10 852 12 16.7 5.8
Sub-Saharan Africa 1 413 1 450 1 033 18.6 2.6
Emerging markets 29 138 n.a. 6 363 32.3 2.1***
Emerging Asia 16 130 n.a. 3 617 39.7 1.6****
Sources: IMF, World Economic Outlook October 2017 (GDP, GDP per capita, population and total investment), and World
Bank Open Data (foreign direct investment, net inflows)
* Gross capital formation at market prices. Includes investments in research and development.
** The value of inward direct investment made by non-resident investors in the reporting economy, including reinvested
earnings and intra-company loans, net of repatriation of capital and repayment of loans.
*** Low- and middle-income countries
**** East Asia and Pacific, excluding high-income countries
15
FULL_SPREAD.indd 15 04.04.18 16:06MARKET OVERVIEW
In 2016, total investments in Sub-Saharan Africa achieve investment-to-GDP ratios of more than
amounted to less than 19 % of GDP, much lower 25 % over a longer period to achieve sustainable
than in emerging Asia (40 %) or the global and inclusive growth. 2 From a macroeconomic
emerging markets average (32 %). Variations perspective, during the last decade growth in
among African countries are significant: While Africa was mainly driven by consumption,
in Algeria, Ethiopia and Morocco, investment without a sufficient impact on job creation. As
ratios were well above 30 % in 2016, total can be seen from table 3, the ratio of foreign
investments accounted for less than 15 % of GDP direct investments to GDP in Sub-Saharan
in Angola, Ghana and Nigeria. The World Bank Africa is already slightly higher than the global
estimates that African countries would need to emerging market average, demonstrating the
need to particularly increase domestic private
and public investments.
16 2
World Bank: The Growth Report: Strategies for Sustained Growth and Inclusive Development (2008)
FULL_SPREAD.indd 16 04.04.18 16:06African real premium growth has been positive since 2011
In 2016, total African insurance premiums But in 2015 and 2016, African real premium
accounted for US$ 60.7 billion or 1.3 % of global growth of 1.7 % and 0.8 % respectively was
insurance premiums. This premium volume slower than real GDP growth (1.8 % and 3.2 %
represented an insurance penetration rate of respectively). Insurance growth patterns in
2.8 %, still lower than the average emerging Africa are diverse: In Morocco, Ethiopia, Kenya,
market rate of 3.2 % or the global rate of 6.1 %. Tanzania and Zimbabwe insurance premium
Total real premium growth in Africa has not volume increased by more than 5 % in 2016. By
been negative since 2011, although in US dollar contrast, Algeria (-3.5 %), Libya (-6 %), Malawi
terms, African insurance premium volume (-14 %), Mozambique (-5.8 %), Namibia (-0.5 %)
dropped by more than 15 % from 2012 to 2016. and Nigeria (-11.4 %) experienced declining real
The depreciation of major African currencies premiums.
against the US$ is the main cause for declining
volumes in US$ terms.
Chart 2: African insurance premiums
by type 2012-2016, life versus non-life,
in US$ billion
80
70
49.2
47.7
47.6
60
43.0
40.6
50
40
30
20
22.6
22.7
22.7
21.0
20.1
10
Africa Life
0 Africa Non-Life
2016
2013
2012
2015
2014
Source: Dr. Schanz, Alms & Company, based on Swiss Re
Institute, sigma No 3/2017, sigma-explorer.com.
17
FULL_SPREAD.indd 17 04.04.18 16:06MARKET OVERVIEW
North and East Africa outgrowing the rest of the market
South Africa is by far the largest African period is outstanding, achieving a market share
insurance market, generating US$ 44bn of of 3.2 % in 2016, up from 1.5 % in 2011. Nigeria,
total premiums. But the share of South African Angola, Namibia and Mauritius complete the top
premiums is shrinking as North and East Africa 10 African insurance markets, which together
gain in relevance. From 2011 to 2016 the share of accounted for US$ 55.1bn or 91 % of total
South African premiums fell from 76 % to 69 %, African insurance premiums in 2016.
while the combined market share of Algeria,
Egypt, Morocco and Tunisia increased from
10 % to 13 %. Kenya’s growth over the same
Chart 3: Geographical split of total African insurance premiums in 2016 (excluding
South Africa)
Others
Morocco
18 %
19 %
Tanzania
2%
Botswana
2%
Ghana
3% Egypt
Côte d’Ivoire
3% 11 %
Zimbabwe
3%
Mauritius
4%
Tunisia Kenya
4% 10 %
Namibia
4 % Angola Algeria
Nigeria 7%
4% 6%
Source: Swiss Re Institute, sigma No 3/2017, sigma-explorer.com.
18
FULL_SPREAD.indd 18 04.04.18 16:06Average top 10 life insurance market growth well above 5 %
In 2016, African life insurance premiums Remarkably, even Africa’s largest life insurance
amounted to US$ 40.6bn, representing a share market, South Africa, still grew at more than
of approximately 8 % of global emerging 5 % over the same period, although over the past
market life premiums. At a growth rate of just two years growth was rather flat, reflecting the
1.2 %, real life premium growth in Africa was economic slowdown in the country. Out of the
much lower in 2016 than in previous years. But top 15 life markets, only Namibia, Nigeria, Côte
growth patterns varied across the continent: d’Ivoire and Ethiopia experienced compound
From 2012 to 2016, life insurance premiums in annual growth rates of less than 5 % over the last
Morocco, Kenya, Zimbabwe and Ghana grew at a five years.
compound annual growth rate of more than 10 %.
Chart 4: Life premiums (US$ million), 2016 and life real premiums (adjusted for inflation)
compound annual growth rate (%), 2012-2016*
–500 0 500 1000 1500 2000 2500 3000 3500 4000
Ethiopia
Cameroon
Algeria
Tunisia
Côte d’Ivoire
Ghana
Botswana
Zimbabwe
Nigeria
Mauritius
Namibia
Kenya
Egypt
Morocco
South Africa 37 526
0% 5% 10 % 15 % 20 %
2016 Life premiums, US$
2012 – 2016 Real life premium growth, CAGR
* 2012-2016: Algeria, Côte d’Ivoire, Egypt, Ethiopia, Kenya, Morocco, Namibia, Nigeria and Zimbabwe; 2012-2015:
Botswana, Cameroon, Mauritius and Tunisia; 2012-2014: Ghana and South Africa
Source: Dr. Schanz, Alms & Company, based on Swiss Re Institute, sigma No 3/2017, sigma-explorer.com.
19
FULL_SPREAD.indd 19 04.04.18 16:06MARKET OVERVIEW
Africa’s top 10 life insurance markets accounted relatively strong in Egypt, Namibia and South
for 97 % of total African life insurance premiums Africa. A recent study found that demographic
in 2016, with South Africa taking the lion’s share factors, such as education, dependency ratio and
(84 %). Compared to the overall insurance market health expenditure, better explain life insurance
size, life insurance development is particularly consumption in Africa than financial factors,
weak in Algeria, Tunisia and Angola and such as financial sector development 3.
Chart 5: Geographical split of African life insurance premiums in 2016
(excluding South Africa)
Cameroon Others
1% 7%
Ethiopia
1%
Tunisia Algeria
2% 2% Morocco
22 %
Côte d’Ivoire
3%
Ghana
3%
Botswana
5%
Nigeria
6%
Egypt
15 %
Zimbabwe
6%
Namibia
Kenya
8%
Mauritius 11 %
8%
Source: Dr. Schanz, Alms & Company, based on Swiss Re Institute, sigma No 3/2017,
sigma-explorer.com.
3
Alhassan, Abdul Latif and Biekpe, Nicholas: Determinants of Life Insurance Consumption in Africa. Research in
20 International Business and Finance, October 2015.
FULL_SPREAD.indd 20 04.04.18 16:06Life insurance outpacing than non-life, but from a very low base
In 2016, the average emerging market life insur- But life insurance is growing very fast in many
ance penetration rate was 1.7 %, slightly below markets: As shown in chart 6, in Zimbabwe,
the African average of 1.8 %. However, excluding Kenya, Morocco, Mauritius and South Africa life
South Africa, where life insurance premiums insurance premiums grew faster than GDP from
accounted for 11.5 % of GDP, the rate would 2012 to 2016. Over the same period, Namibia and
drop below 1 %. In 2016, only six other African Côte d’Ivoire were the only African countries
markets (Botswana, Kenya, Mauritius, Morocco, where GDP increased faster than life insurance.
Namibia and Zimbabwe) achieved a life insur-
ance penetration rate higher than 1 %.
Chart 6: Life insurance penetration 2016 and life insurance penetration compound annual
growth rates 2012 – 2016
14 %
13 %
12 %
11 %
2016 life insurance penetration
10 %
South Africa
9%
US$ 33.9 bn
8%
7%
6% Namibia Mauritius
US$ 0.5 bn US$ 0.5 bn
5%
4% Zimbabwe
Botswana US$ 0.4 bn
3% Ghana US$ 0.3 bn
Kenya
2% US$ 0.2 bn
US$ 0.7 bn
1%
Morocco
0% Côte d’Ivoire Egypt US$ 1.5 bn
US$ 0.2 bn Nigeria US$ 1.0 bn
US$ 0.4 bn
– 10 % –5% 0% 5% 10 % 15 % 20 % 25 %
Size of the bubble represents life insurance market size. A value of 0 % on the x-axis represents life
insurance growth in line with GDP growth.
Source: Dr. Schanz, Alms & Company, based on Swiss Re Institute, sigma No 3/2017, sigma-explorer.com.
21
FULL_SPREAD.indd 21 04.04.18 16:06MARKET OVERVIEW
East African non-life insurance markets growing fast
While Africa’s real (adjusted for inflation) life Algeria, Libya, Malawi, Mozambique, Namibia,
insurance premiums expanded by 1.2 % in 2016, Nigeria, Uganda and Zimbabwe all experienced
non-life insurance growth was rather flat (-0.2 %). declining premium volumes. On a five-year basis,
On a global basis, emerging market real non-life compound annual growth rates for Côte d’Ivoire,
premium grew by 9.6 %, with Asia (17.9 %) and Kenya and Tanzania clearly outperformed most
Europe (5.4 %) outperforming the Middle East other African markets. On the other hand,
and Central Asia (2.9 %), Latin America (-3.7 %) affected by low oil prices and currency depreci-
and Africa. ation that led to the worst recession in decades,
Of Africa’s top 10 non-life markets, Kenya, in Nigeria non-life premiums decreased from
Morocco and Tanzania witnessed the highest US$ 1,229 million in 2012 to US$ 787 million in
growth rates in 2016. For many other African 2016.
non-life markets, 2016 was a very difficult year:
Chart 7: Non-life premiums (US$ million), 2016 and non-life real premium
(adjusted for inflation) compound annual growth rate (%), 2012-2016*
–3000 –2000 –1000 - 1000 2000 3000
204
Zimbabwe
221
Cameroon
224
Mauritius
246
Ghana
248
Namibia
277
Ethiopia
282
Côte d’Ivoire
282
Tanzania
388
Sudan
674
Tunisia
775
Angola
787
Nigeria
1 107
Egypt
1 107
Algeria
1 186
Kenya
2 103
Morocco
8 072
South Africa
-10 % -5 % 0% 5% 10 %
2016 Non-Life premiums, US$
2012 – 2016 real Non-Life premium growth, CAGR
* 2012-2013: Angola; 2012-2014: Ghana; 2012-2015: Cameroon, Mauritius, Sudan, Tunisia
22 Source: Dr. Schanz, Alms & Company, based on Swiss Re Institute, sigma No 3/2017, sigma-explorer.com.
FULL_SPREAD.indd 22 04.04.18 16:06Africa’s two largest non-life insurance markets, earlier in 2012, both markets accounted for 62 %,
South Africa and Morocco, accounted for 50 % indicating that smaller markets are catching up
of total premiums in 2016. Only four years fast.
Chart 8: Geographical split of African non-life insurance premiums in 2016
Cameroon
Others
1% Zimbabwe 10 %
Mauritius 1 % 1%
Ghana 1 %
Namibia 1 %
Ethiopia 1 %
Côte d’Ivoire 1 %
Tanzania 1 %
Sudan 2 %
Tunisia 3 %
South Africa
Angola 40 %
4%
Nigeria
4%
Egypt
5%
Algeria
5% Morocco
Kenya
10 %
6%
Source: Dr. Schanz, Alms & Company, based on Swiss Re Institute, sigma No 3/2017,
sigma-explorer.com.
23
FULL_SPREAD.indd 23 04.04.18 16:06MARKET OVERVIEW
Three North-African non-life markets growing faster than GDP
Despite the overall lacklustre growth perfor- 1.5 %, African premiums accounted for only
mance of the African non-life insurance sector 0.9 % of GDP. Given the strong link between
in 2016, premiums in the three North-African GDP per capita levels and non-life insurance
markets Algeria, Morocco and Tunisia grew penetration, poverty is probably the most relevant
faster than GDP over the past five years. In other determinant to explain this difference. This is
major markets, such as South Africa, Kenya and also reflected in the much lower non-life insur-
Angola, insurance premiums grew in line with ance density (ratio of total premiums to total
the economy. Most markets where premium population) of US$ 17 per capita in Africa, which
growth lagged behind economic growth, such as compares to a global emerging markets average
Nigeria, Sudan or Egypt, were affected either by of US$ 69.
political or economic instability. Nevertheless, the impact of supportive
Compared to the average global emerging policies to create an enabling environment
market non-life insurance penetration rate of for insurance should not be underestimated.
24
FULL_SPREAD.indd 24 04.04.18 16:06A recent empirical study 4 recommended that Furthermore, compulsory insurance schemes for
financial reforms, recapitalisation and consoli- private and government workers as well as for
dation policies that can sustain and deepen the all vehicle owners can play an important role to
insurance market should be pursued by African raise insurance penetration levels.
governments and the respective insurance
regulatory authorities. This was found to be of
critical importance for countries that are char-
acterised by government ownership of insurance
companies and opposed to liberalisation reforms.
Chart 9: Non-life insurance penetration 2016 and non-life insurance penetration compound
annual growth rates 2012 – 2016
3%
South Africa
US$ 8.1 bn
2016 non-life insurance penetration
Namibia
US$ 0.2 bn Morocco
2% US$ 2.1 bn
Mauritius
US$ 0.2 bn
Tunisia
Kenya US$ 0.7 bn
US$ 1.2 bn
Cameroon
US$ 0.3 bn Côte d’Ivoire Angola
1% US$ 0.3 bn US$ 0.8 bn
Ghana
US$ 0.2 bn
Algeria
Sudan US$ 1.1 bn
US$ 0.4 bn
Tanzania
US$ 0.3 bn
Nigeria
Ethiopia
US$ 0.8 bn
Egypt US$ 1.1 bn
0% US$ 1.1 bn
-15 % -10 % -5 % 0% 5% 10 % 15 %
Size of the bubble represents non-life insurance market size. A value of 0 % on the x-axis represents
non-life insurance growth in line with GDP growth.
Source: Dr. Schanz, Alms & Company, based on Swiss Re Institute, sigma No 3/2017, sigma-explorer.com.
4
Olayungbo, D. O., & Akinlo, A. E. (2016). Insurance penetration and economic growth in Africa: Dynamic effects
analysis using Bayesian TVP-VAR approach. Cogent Economics & Finance, 4(1), 1150390.
https://doi.org/10.1080/23322039.2016.1150390 25
FULL_SPREAD.indd 25 04.04.18 16:06Survey
Results
26
FULL_SPREAD.indd 26 04.04.18 16:061. The overall perspective: Strengths,
weaknesses, opportunities and threats
of African insurance markets
Strong fundamentals continue to characterise Nevertheless, a wider distribution and a larger
Africa’s insurance markets. Rich resources, a section of the population with access to insur-
recovery of commodity prices and improved ance products improves scale and efficiency of
economic conditions, higher available income insurers. Many interviewees point out that the
coupled with the emergence and a broadening sheer size of Africa’s population – currently
of the middle class in some markets, as well as 1.27 billion people – and its young median age
a young and growing population, are the under- of 19.4 years are part of the attraction of the
lying strengths of the markets. market, which thanks to digital technology has
Although still fragile, insurance executives become more accessible and beyond national
polled emphasise that the overall soft factors boundaries.
that coin the market conditions have improved
too. Policymakers and regulators have come to
recognise the value of insurance for the progress «We are fairly optimistic for the near-term
and prosperity of the economy and for society at future of Ghana’s insurance industry. Along
large. New schemes, such as risk-based capital with the other sectors of the fi nancial industry,
aim to strengthen the market and improve insurance enjoys strong attention from Ghana’s
its conditions. However, many interviewees policymakers and regulators, who recognise
remark that while regulatory «intentions» have its relevance for the country’s development.
improved, the actual enforcement or execution Adequate capital requirements and tighter
of these regulations remains wanting. The exec- controls on under-pricing will benefi t the sector
utives polled also emphasised that the awareness too. In addition, increased investments in
for the benefits of insurance products is on the infrastructure and rising disposable incomes
rise among consumers, not only because they will drive premium growth both in commercial
have more assets to protect, but also because and personal lines.»
mobile phones and micro insurance products
Aretha Duku, Managing Director, Ghana Union
have appealed to Africa’s large, but still remote Assurance Company Limited
rural sections of its population.
Chart 10: Market strengths (number of mentions)
Strong underlying growth 23
Strong / improved regulatory regimes 8
Demographic dividend 6
27
FULL_SPREAD.indd 27 04.04.18 16:06SURVEY RESULTS — THE OVERALL PERSPECTIVE: STRENGTHS, WEAKNESSES,
OPPORTUNITIES AND THREATS OF AFRICAN INSURANCE MARKETS
Although underlying fundamentals and also Africa had long been unaffected by excess
recent developments might be promising, there capacity and falling rates. With this changed,
are still many «glass half-empty» interviewees. insurers have turned to the regulator to intervene
Consistent with last year’s Africa Insurance where pricing turns ruinous. In fact, if insurers
Barometer, regulation, while improving, remains were to fail, that might threaten still fragile
wanting. To some interviewees new direc- consumer confidence.
tives demonstrate all the right intentions, but Fierce competition is also seen as a result of
enforcement is either insufficient or inconsistent. a lack of skills and market expertise. Depending
To others, regulatory regimes (or specifically on the market size and its sophistication, the
regulators) now run the risk of swinging from dedicated talent pool versed in insurance is still
one extreme to the other. While in the past regu- very thin. According to some pundits, actuarial
lation suffered from leniency, it now threatens to skills are particularly scarce. This undermines
overwhelm its subjects by asking them too much insurers’ ability to develop suitable and profitable
in too little time. Regulation is seen as a burden, insurance products. By contrast, the more generic
strangling market opportunities. sales and marketing talents dominate the corpo-
However, many executives are calling for rate agenda and thus competition on the basis
the regulator to intervene, in particular because of price rather than quality defines the market
of cut-throat competition in some markets. environment.
«Healthy competition is essential to the
operation of effi cient insurance markets as it
fosters innovation, productivity and growth».
Edwin F. Igbiti, Group Managing Director, AIICO
Insurance Plc., Nigeria
Chart 11: Market weaknesses (number of mentions)
Regulatory environment 11
Lack of talent and skills 10
Fierce competition 10
28
FULL_SPREAD.indd 28 04.04.18 16:06Consistent with last year’s survey the execu- also been unavailable. Thus, insurers’ under-
tives polled still see Africa’s low insurance standing of their target groups and their actual
penetration as the market’s largest opportunity. size becomes transparent – also beyond national
Businesses and consumers are largely uninsured. borders – which in fact enables an intra-African
In key African economies with large populations expansion of insurers into neighbouring or
like Nigeria, Angola or Egypt insurance penetra- adjacent territories.
tion is still below 1 % as compared to the world’s New technologies also facilitate the
average of 6.1 %. introduction of micro-insurance solutions.
The upside potential is thus enormous, Parametric triggers, lower cost of collecting and
which is also reflected in the other two oppor- analysing weather data and improved means of
tunities mentioned most frequently: Product claims management enhance the efficiency of
development (particularly in specialty lines) and agricultural insurance and thus also help to build
technological advancements. Africa is becoming awareness for the benefits of insurance protection
more integrated into the global production chain. among policymakers as well.
New technologies, modern facilities or digiti- Finally in some sections of Africa’s society,
sation expose Africa to new and more complex disposable income – although frequently still
risks that extend well beyond the standard mentioned as one of the key weaknesses of the
property coverage. As the continent’s economy continent – might have reached a level where
continues on its road to recovery these oppor- insurance uptake becomes attractive enough
tunities become even more virulent. However, a to develop matching products and to respond
greater focus on specialisation is also a reflection to growing demand with solutions tailored to a
of the mounting pricing pressure which erodes more insurance savvy population.
profitability in more generic lines of business and
forces insurers to broaden their offering to more
remote lines of business.
Technological advancements create business «Domestication requirements can lead to the
opportunities not only in commercial but also isolation of African insurance markets. The
in personal lines. Mobile phones and online sharing of international best practices, the
information greatly enhance access to customers, introduction of new products and technological
broaden and facilitate insurance distribution advancements already introduced and tested in
to Africa’s large rural population, which had other markets are of crucial importance for the
been virtually beyond reach. In addition, digital rapid advancement of regional markets.»
technology provides insurers with data regarding
Belhassen Tonat, Head of Non-Life, Munich Reinsurance
their consumers’ habits and preferences that had Company of Africa Ltd.
Chart 12: Market opportunities (number of mentions)
Low penetration 13
Speciality risks an new product development 10
Technological advancements 8
29
FULL_SPREAD.indd 29 04.04.18 16:06SURVEY RESULTS — THE OVERALL PERSPECTIVE: STRENGTHS, WEAKNESSES,
OPPORTUNITIES AND THREATS OF AFRICAN INSURANCE MARKETS
As already discussed, an improved regulatory Over the last 12 months, Africa has seen key
environment creates opportunities for insurers elections and political transitions that caused
and contributes to strengthen the market, some unrest and uncertainty. In many of these
shelters it from unfair competition, provides a cases instability spreads into neighbouring
framework to protect policyholders’ interest and countries and destabilises wider regions. Since
thus helps to preserve market trust. However, many African markets are in need for more
regulation is equally perceived as a threat if investments, these uncertainties – besides their
it fails to deliver on its responsibilities or – as societal implications – are poisonous for the
frequently mentioned in this year’s survey – gets concerned economies and threaten to derail their
carried away with its task to steer the market. progress.
Complaints come from both national and interna-
tional insurers, with the former complaining that
regulation now stifles market initiatives and the
latter concerned that the rise of protectionism in
some African countries actually undermines the «Ghana’s insurance business suffers from
markets’ strengths, as insurers have less access to commoditisation. It is not sold based on service
international know-how and risk diversification. or quality but largely on price with a top – line
Many African insurers complain that the and short – term focus. Risks are inadequately
current competitive environment is not just priced, and players are continuously
excessive, but actually unethical and irrespon- undercutting each other. As a result, rates have
sible. In fact, a large number of executives been tumbling for quite some time and it is
interpret current competitive practices as imperative that we work to reverse the trend
testament of a low level of professionalism in immediately otherwise we imperil the industry in
the market. Since actuarial skills are scarce in the near future.»
Africa – also among regulators – pricing can be
Seth Aklasi, Chief Executive Offi cer, Donewell Insurance
ruinous and threaten the market’s stability. There Company Ltd.
is not enough expertise to be found to advance
product development. Too many players fight for
the same cake, unable to diversify into different
risks, lines or client segments.
Chart 13: Market threats (number of mentions)
Regulatory environment 10
Excessive competition and unstainable pricing 10
Political instability 8
30
FULL_SPREAD.indd 30 04.04.18 16:06Key differences between Northern Africa, CIMA countries,
Eastern and Southern Africa
Most of the insurance executives polled focus Unchanged to last year’s survey, East Africa
on single African markets or a few neighbouring is praised for its economic growth and better
markets. Apart from reinsurers, which by defini- developed financial markets, which also benefit
tion look beyond borders, the African continent the insurance sector. Regulation is well advanced
as an insurance market remains a rather abstract with Kenya’s introduction of a risk-based capital
concept, disparate by historically different regu- regime, but with some protectionist tendencies.
latory concepts and significant cultural as well as Political instability is still a threat to East Africa,
economic differences. with warfare in South-Sudan and Islamist
According to interviewees, North Africa, terrorism crossing across the border into Kenya.
with the exception of Morocco and Algeria, Given the more advanced state of the sector,
still suffers from the aftermath of Arab Spring. product awareness and insurance penetration
Economic recovery is slow and political stability are significantly higher than in West Africa.
is seen as fragile. However, North Africa’s insur- However, domestic competition is seen as fierce
ance markets have access to a larger skill base with heated merger and acquisition activities as
than many of their Sub-Saharan counterparts well as regional expansions from South African
and can rely on fairly developed and diversi- players into the East African market.
fied economies, often producing their own oil. Southern Africa is dominated by South
Regulation is well advanced, though different Africa with its very mature insurance sector
from the CIMA region further south, but also that sports an insurance penetration rate of
partly leaning more towards either Anglo-Saxon 14.2 %, well ahead of many of the industrialised
or francophone standards. European markets. Consumer awareness as well
In West Africa, the francophone markets of as technical skills and insurance regulation are
the CIMA region show a strong internal cohesion well advanced. However, the market is perceived
with a regulatory approach that is perceived from as saturated and highly competitive. Profitability
outside the region as protectionist. Technical is low and also growth perspectives are limited
skills are less accessible and economic growth is, given the maturity of the market. Neighbouring
apart from Senegal, fragile. However, insurance markets like Namibia or Zimbabwe benefit
profitability is still perceived to be better than to some degree from their large neighbour,
in North or Southern Africa. According to some accessing its knowledge base and adopting
interviewees the Anglo-Saxon countries of West product solutions where suitable.
Africa share more in common with their East
African counterparts, with stronger economic
progress in markets like Ghana and better access
to insurance expertise, also due to large (Nigeria)
or dense (Ghana) populations. «We expect that Africa will soon be seen as
one trading block. Regional cooperation
and integration is an important strategy for
development and intra-regional trade and
will produce considerable economic gains for
Africa.»
Peter King, Managing Director, CKRe, United Kingdom
31
FULL_SPREAD.indd 31 04.04.18 16:06SURVEY RESULTS
2. General insurance market outlook
Commercial lines insurance rates
Africa’s commercial insurance markets seem Improvements are due to a slightly rosier
to have reached the bottom of the pricing cycle. economic outlook which should positively impact
Although 69 % of interviewees perceive rates premium growth and thus stabilise rates. In
as below the average of the past three years, addition, interviewees remark that the market’s
this number has come down from almost 90 % decline has deteriorated to a level that threatens
in 2017. By contrast, the share of those who see stability and they thus expect or already witness
rates as average has improved from close to 10 % regulatory action against dangerous pricing
in 2017 to 27 % now. levels.
Still, the executives polled remark that
competition is fierce, often characterised as
«unethical». The low rates are not just an
outcome of excess capacity, but also a reflection «As traditional lines are impacted by a
of a lack of innovation and diversification, downward trend in rates, insurers need to
as insurers seem to be «all chasing the same revise their strategy. They have to broaden their
clients». Markets are not yet deep enough to market approach to include SME companies
allow for a broad segmentation. Often insurers and individuals too and to expand into further
also lack expertise to develop new products and lines of business like agricultural insurance as
expand into new types of risks. well. Insurers need to align their offering closer
The outlook for the next 12 months is even to their clients’ needs and provide innovative
more positive than current pricing. Last year’s products and services that come with new
survey found that half of interviewees feared technologies. Furthermore, they have to diversify
a further decline, but that share has now come and intensify their distribution to enhance their
down to a third. Furthermore, while in 2017 only proximity with clients.»
5 % expected rising rates, that number has risen
Youcef Benmicia, Président Directeur Général,
to 27 % in 2018. Compagnie Algérienne des Assurances – CAAT
Chart 14: Commercial lines insurance Chart 15: Commercial lines insurance
rates. Current level: Compared to the past rates. Outlook: Next 12 months
three years
High
4%
Higher
Lower 27 %
31 %
Low
69 %
Average Stable
27 % 42 %
32
FULL_SPREAD.indd 32 04.04.18 16:06Current profitability is still better than the Going forward, executives expect profitability
pricing. That is partially due to a more comfort- to improve as almost 75 % see either stable
able pricing of African risks in the past, but or even higher profits. This finding is almost
also a low claims experience in recent months. unchanged to last year. However, it reflects the
Similar to the findings on rates, current profita- assumption that with the steady improvement of
bility is seen as better than in the 2017 survey, the economy, premiums will expand, although
when 57 % of interviewees felt that profits were margins might remain flat.
low as compared to 46 % now.
«Although rates are declining due to unethical
business practices and the undercutting of
prices, the industry’s overall profi tability is
still high in Sierra Leone. Insurance continues
to outpace GDP growth as penetration is low.
Going forward, charging low rates and rising
claims will eat into margins and erode profi ts.
However, we expect that the efforts being made
to deepen insurance penetration will yield the
desired result and reverse the trend.»
Dr. Nduka O. Anyaso, Group Managing Director and
CEO, International Insurance Company (SL) Limited
Chart 16: Commercial lines profitability. Chart 17: Commercial lines profitability.
Current level: Compared to the past five Outlook: Next 12 months
years
High
12 % Higher
19 %
Lower
27 %
Low
46 %
Average
42 % Stable
54 %
33
FULL_SPREAD.indd 33 04.04.18 16:06SURVEY RESULTS — GENERAL INSURANCE MARKET OUTLOOK
Personal lines insurance rates
Current rates in personal lines are almost Going forward, interviewees predominately
unchanged from prior year. Overall, rates expect rates to remain unchanged. There is
are more adequate in personal lines than in some upwards pressure for rate adjustments in
commercial lines, as competitive pressure is motor as claims are inflated due to currency
not as intense. Typically, consumers are a more depreciations. Since most African currencies
loyal customer segment than commercial clients. have declined against the Euro or the US dollar,
Furthermore, from a policyholder’s perspective, the cost for vehicles and spare parts, which are
rate differences in personal lines are less obvious produced outside Africa, have gone up in local
to consumers than in the commercial market currencies and thus put pressure on claims.
where brokers have detailed market knowledge However, the executives interviewed are not
and exert substantial pressure on insurers. convinced that the pricing pressure is sufficient
Finally, commercial clients are usually more to move rates upwards.
insurance savvy than personal lines consumers.
Chart 18: Personal lines insurance rates. Chart 19: Personal lines insurance rates.
Current level: Compared to the past five Outlook: Next 12 months
years
High
Higher
4%
8%
Lower
24 %
Low
36 %
Average Stable
60 % 68 %
34
FULL_SPREAD.indd 34 04.04.18 16:06Personal lines insurance profitability
The profitability of personal lines has also «Profi tability is low in group life business
improved slightly compared to the prior year. in Egypt due to increasing expenses and
According to 12 % of interviewees current profit- uncertainty involved with the non-availability
ability is high, up from 5 % in 2017. Conversely, of an Egyptian mortality table. Current pricing
20 % think that profitability in personal lines models use mortality tables that tested to be
is low, down from 30 % a year ago. Again, the similar to Egyptian mortality more than 25
improvements in profitability are driven by years ago and should be retested. This leads to
similar reasons as for commercial lines: overall inaccurate pricing especially of group credit
economic growth and regulatory concerns or business which requires closer attention from
even pressure on insurers to assure that policy- regulators in Egypt.»
holders’ interests are protected.
Ahmed Fouad Selim, Technical insurance and districts
Going forward the executives polled predict affairs, Board Member, Misr Life Insurance
profitability to steadily edge upwards. In 2017,
11 % expected profitability to improve in the next
12 months. That share increases to 20 % in 2018.
Chart 20: Personal lines profitability. Chart 21: Personal lines profitability.
Current level: Compared to the past five Outlook: Next 12 months
years
High Lower
12 % 12 % Higher
Low
20 % 20 %
Average
Stable
68 %
68 %
35
FULL_SPREAD.indd 35 04.04.18 16:06You can also read