The Transatlantic Cocaine Market - Research Paper - April 2011 - Refworld
←
→
Page content transcription
If your browser does not render page correctly, please read the page content below
The Transatlantic
 Cocaine Market
       Research Paper

               April 2011
ACKNOWLEDGEMENTS
This report was prepared by the Studies and Threat Analysis Section in collaboration with the
Regional Office in Senegal and the Integrated Programme and Oversight Branch of UNODC.
The following staff members contributed to this document:
Studies and Threat Analysis Section:              Thibault Le Pichon, Thomas Pietschmann,
                                                  Ted Leggett, Raggie Johansen
Regional Office in Senegal:                       Alexandre Schmidt, David Izadifar
Integrated Programme and Oversight Branch:        Aisser Al-Hafedh, Olivier Inizan
Strategic Planning Unit:                          Gautam Babbar

DISCLAIMER
This report has not been formally edited.
The designations employed and the presentation of material in this report do not imply the
expression of any opinion whatsoever on the part of UNODC concerning the legal status of
any country, territory or city or its authorities, or concerning the delimitation of its frontiers
and boundaries. The contents of this report do not necessarily reflect the views of the Member
States.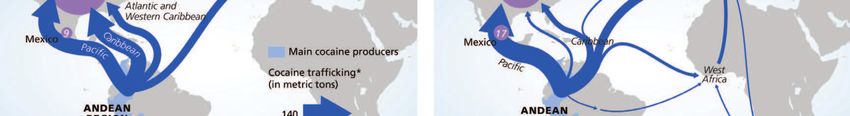
The Transatlantic Cocaine Market

Key findings....................................................................................................................... 2
Key data / estimates .......................................................................................................... 3
Introduction....................................................................................................................... 6
1.      The evolution of the global cocaine market ............................................................ 7
     a) Shifts in supply and demand........................................................................................7
     b) Evolution of trafficking routes ..................................................................................11
     c) Current value and money flows.................................................................................13

2.      Current transatlantic trafficking routes ............................................................... 16
     a) Overview ...................................................................................................................16
     b) Seizures in Europe.....................................................................................................18
     c) Commercial air couriers to Europe............................................................................24
     d) Maritime trafficking ..................................................................................................25
     e) Maritime trafficking routes through the Caribbean ...................................................25
     f) Maritime routes to West Africa..................................................................................26
     g) Air routes to West Africa ..........................................................................................30

3.      Trafficking from West Africa to Europe .............................................................. 33
     a) Maritime routes from West Africa to Europe............................................................33
     b) Air routes from West Africa to Europe .....................................................................34
     c) Land routes from West Africa to Europe ..................................................................36

4.      Distribution within Europe .................................................................................... 38
5.      The impact of cocaine trafficking to Europe ........................................................ 42
     a) In the Andean production countries...........................................................................42
     b) In transit countries in the Americas...........................................................................49
     c) In West Africa ...........................................................................................................54
     d) In Europe ...................................................................................................................56

6.      Implications for policy ............................................................................................ 58
     Initiatives supported by UNODC ..................................................................................59

                                                                                                                                    1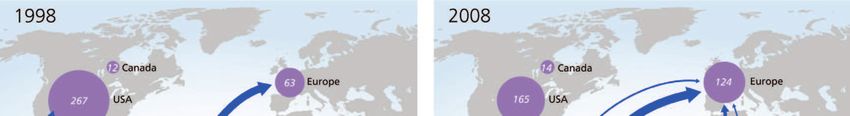
Key findings
!   Global demand for cocaine has shifted. Demand in the United States was more than four times
    as high as in Europe in 1998, but just over a decade later, the volume and value of the West
    and Central European cocaine market (US$33 billion) is approaching parity with that of the
    US (US$37 billion). Two thirds of European cocaine users live in just three countries: the
    United Kingdom, Spain and Italy. With Germany and France, these countries represent 80%
    of European cocaine consumption.
!   European cocaine seizures increased rapidly between 1998 and 2006, peaking at some 121
    tons. They have dropped off sharply since then, to some 53 tons in 2009, while at most,
    European demand has stabilized. There have been increases in seizures in South America, but
    the price of pure cocaine has not increased greatly in Europe, suggesting that traffickers have
    found new ways of evading law enforcement.
!   In the last decade, most (about 60%) of the cocaine seized was taken at sea or in ports. The
    Bolivarian Republic of Venezuela was the most prominent country of origin for direct cocaine
    shipments to Europe, with the cocaine coming mainly from Colombia.
!   It appears that most of Europe’s cocaine enters by sea, primarily via Spain. Nearly half the
    cocaine seized in Europe was taken by Spanish authorities, two-thirds of which was detected
    in international waters and 11% in containers.
!   Excluding what is imported for local consumption, it is estimated that about 21 tons of
    cocaine were trafficked from West Africa to Europe in 2009. This is down sharply from two
    years before, when the total could have been as high as 47 tons.
!   Much of the trafficking to West Africa used to be carried out by large ‘mother ships’ that
    unloaded the drugs on to smaller, local vessels off the West African coasts. Today, large
    maritime shipments have virtually disappeared, suggesting that traffickers have changed their
    tactics. There is evidence of shipments in large commercial aircraft purchased second-hand by
    traffickers for this purpose. There are also indications that containerized shipping is being
    utilized, but very few of these shipments have been detected.
!   Most of the recently reported seizures of cocaine from container consignments from South
    America to West Africa had Nigeria or Ghana as their destination. Most of these containers
    originated in Peru or the Plurinational State of Bolivia.
!   Commercial air flights used to be the most common vector for trafficking cocaine from West
    Africa to West and Central Europe (97% of seizure cases over the last decade, or 58% of all
    cocaine seized). But the number of detections have declined drastically in recent years,
    suggesting again that traffickers have changed their tactics.
!   There appears to be some trafficking of cocaine from West Africa to Europe across the Sahara
    to countries in northern Africa, although very few seizures have been made. There is some
    evidence of use of the traditional cannabis resin trafficking routes from Morocco to Spain.
!   Although it appears that Colombian organized crime groups still dominate trafficking of
    cocaine to Europe, domestic markets are often in the hands of traffickers of other nationalities.
!   In addition to the health consequences of cocaine use, the impact of cocaine trafficking
    includes drug-funded violence, political instability and corruption in many areas.
!   In line with the principle of shared responsibility and a balanced approach to the drug
    problem, the expansion of the cocaine market across the Atlantic and, more recently, in South
    America, highlights the importance of developing strategies on the scale of the cocaine threat.
    Efforts must be increasingly coordinated and integrated into an international approach that
    adapts to new developments as quickly as the traffickers. There are many reasons to be
    optimistic about the capacity of the international community to achieve a significant reduction
    of the global cocaine market during the present decade.

2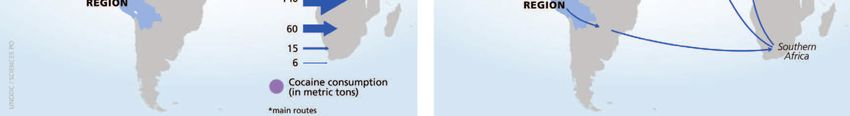
The Transatlantic Cocaine Market

Key data / estimates
Table 1: Flows of cocaine, purity-adjusted*, to major consumer markets
         (tons), 2009

 Production                                                                                  1,111
 Less seizures in Andean countries                                                            -254
 Less domestic consumption in the Andean region                                                 -13
 Amounts available for export out of the Andean countries                                     844
 Less seizures in other South American countries, Caribbean                                   -203
 and Central America
 Less domestic consumption in other South American                                              -83
 countries, Caribbean and Central America
 Amounts available for export out of South America,                                           558
 Caribbean and Central America
                                                                            West and     North America
                                                                          Central Europe
 Amounts of cocaine leaving the Andean countries for West                         217                       378
 and Central Europe and North America
 Less amounts seized in other South American countries,                            -59                      -98
 Caribbean and Central America linked to trafficking flows
 to West and Central Europe and North America
                                                                                   158
 Amounts leaving South America, Caribbean and Central                                                       280
                                                                           (incl. 21 tons via
 America to West and Central Europe and North America
                                                                             West Africa)
 Less amounts seized by consumer countries of West and                             -35                      -101
 Central Europe and North America
 Less amounts seized in West and Central Africa                                   -0.4
                                                                                                             179
 Amounts of cocaine consumed in West and Central Europe                           123
                                                                                                       (incl. 157 tons
 and in North America
                                                                                                          in USA)
* Purity levels tend to decline along the trafficking chain. All numbers in this table have been adjusted to pure cocaine
equivalents. Seizure data were adjusted based on reported wholesale purity data.
  Source: UNODC estimates based on Annual Reports Questionnaire (ARQ) data reported to UNODC by Member States and
                                       other government or scientific sources.

Table 2: Flows of cocaine, purity-adjusted, to West and Central Africa (tons),
         2009

 Amounts leaving South America for West and Central Africa                                       35
     of which
     for domestic consumption                                                                    13
     for transit to West and Central Europe                                                      21
     amounts seized in West and Central Africa                                                   0.4
                 Source: UNODC estimates based on ARQ data and other government or scientific sources.

                                                                                                                         3
Table 3: Distribution of cocaine seizures by region (tons), 2009
Seizures as reported Seizures adjusted for purity*
in tons in % in tons in %
Americas 694 93% 576 94%
of which
South America 463 62% 386 63%
Central America 91 12% 81 13%
Caribbean 8 1% 7 1%
North America 132 18% 101 16%
Europe 55 7% 36 6%
of which
West and Central 53 7.1% 35 5.7%
Europe
East and South-East 2 0.3% 1 0.2%
Europe
Africa 1.0 0.1% 0.7 0.1%
of which
West and Central 0.5 0.4
Africa
Southern Africa 0.3 0.3
North Africa 0.08 0.06
East Africa 0.02 0.01
Asia 0.7 0.1% 0.6 0.1%
Oceania 0.3 0.04% 0.2 0.03%
Total 750 100% 613 100%
* adjusted by wholesale purity
Source: ARQ data
Table 4: Estimates of the distribution of the cocaine consumer markets by
region, adjusted for purity (tons), 2009
Consumption in tons In %
Americas 275 63%
of which
South America 85 19%
Central America 10 2%
Caribbean 6 1%
North America 179 41%
(USA: 157 tons) (USA: 36%)
Europe 129 29%
of which
West and Central Europe 123 28%
East and South-East Europe 6 1%
Africa 21 5%
of which
West and Central Africa 13 3%
Southern Africa 4 1%
North Africa 1 0.2%
East Africa 3 0.7%
Asia 14 3%
Oceania 2 0.5%
Total 440 100%
Sources: UNODC estimates based on ARQ data and other government or scientific sources.
4The Transatlantic Cocaine Market
Table 5: Estimates of the value of the cocaine consumed at retail level, by
region in billion US$, 2009
Value in billion US$ In %
Americas 44 51%
of which
South America 3.4 4%
Central America 0.2 0.2%
Caribbean 0.2 0.2%
North America 40 47%
(USA: 37) (USA: 44%)
Europe 36 42%
of which
West and Central Europe 33.4 39%
East and South-East Europe 2.3 3%
Africa 1.8 2%
of which
West and Central Africa 0.8 0.9%
Southern Africa 0.5 0.6%
North Africa 0.1 0.1%
East Africa 0.5 0.6%
Asia 2.4 2%
Oceania 1.7 2%
Total 85 100%
Sources: UNODC estimates based on Annual Reports Questionnaire data and other government or scientific sources.
Table 6: Estimates of gross profits in billion US$, made by cocaine traffickers,
by region, 2009
in billion US$ In % of GDP
South America, Central America, Caribbean 18 0.6%
of which
local market 3 0.1%
export to North America* 6 0.2%
export to Europe** 9 0.3%
North America (USA, Mexico, Canada) 34 0.2%
West and Central Europe (EU-25 and EFTA) 23 0.1%
West and Central Africa (local demand and export to 0.8 0.2%
Europe)
Other 8 0.04%
Total trafficking profits 84*** 0.1%
* trafficking from producing areas in the Andean region to Mexico.
** all trafficking to transit countries (US$4.9 bn) and from transit countries to Europe (US$6.1 bn) of
which 70% (US$4.3bn) is assumed to be generated by trafficking groups from South America and the
Caribbean; gross profits for trafficking to Europe are higher as prices in Spain (main entry point into
Europe) are much higher than prices in Mexico (main entry point into North America).
*** The difference between the total size of the global cocaine market (US$85 bn) and gross
trafficking profits (US$84 bn) is income of farmers; farmers are estimated to gain less than US$1 bn.
Sources: UNODC estimates based on ARQ data and other government or scientific sources.
5Introduction Transnational cocaine trafficking has been affecting the Americas for the last 40 years. Although the value of the global market has declined greatly since the mid-1980s, the flow of cocaine in that region continues to have an impact on public health and to generate large revenues that fuel violence and corruption in many countries. While the size of the United States market was shrinking, new destination markets have appeared, affecting a new set of nations caught in the transit flow. This report is about the biggest of these new flows: the trafficking of cocaine to meet growing European demand. The volume of cocaine consumed in Europe has doubled in the last decade. While European law enforcement agencies have hardened their defences, traffickers continue to innovate, seeking novel ways of getting their product to the consumer. Around 2004, South American traffickers began to experiment with a way- station that had rarely seen large volume shipments of cocaine: West Africa. In a few years, they had managed to undermine security and sow high-level corruption in a number of West African states. Recognizing the threat, the international community quickly undertook a variety of interventions to address this flow. The novelty aspect was lost, the political instability proved self-defeating, and some very large seizures were made. By 2008, there was a remarkable decline in the number of both large maritime seizures and the number of cocaine couriers detected flying from West Africa to Europe. But there were indications that the flow still continued, raising the possibility that traffickers had simply modified their technique, finding new methods for bringing cocaine to Europe, including through West Africa, without detection. There are statistical data to support this scenario: European cocaine seizures decreased from 121 tons in 2006 to 53 tons in 2009. Demand, in contrast, has not dropped by half during this period. Despite growing seizures in South America, prices have actually declined in much of Europe. Purity has also declined in a number of countries, such as the United Kingdom, resulting in some increase in real prices. But overall, it does not appear that supply has been drastically constrained, suggesting that the traffickers have found new ways of getting their product to market. The expansion of the cocaine market across the Atlantic and, more recently, in South America, highlights the importance of treating cocaine as a global problem, and of developing strategies on the scale of the threat. Efforts must be increasingly coordinated and integrated into an international approach that adapts to new developments as quickly as the traffickers. There are many reasons to be optimistic about the capacity of the international community to achieve a significant reduction of the global cocaine market during the present decade. As clever, well-resourced and adaptable as traffickers may be, they are no match for the world’s nations working together. 6
The Transatlantic Cocaine Market

1. The evolution of the global cocaine market
a) Shifts in supply and demand
The nature and extent of cocaine trafficking is dependent on both the supply of cocaine
and the demand for it. While almost all of the cocaine produced globally comes from the
Andean region (Colombia, Peru and the Plurinational State of Bolivia), the location of
demand has shifted drastically in the last decade. The following section discusses these
dynamics.

Production
From the end of World War II until the late 1990s, almost all the world’s coca bush (the
raw material for the manufacture of cocaine) was grown in Peru and the Plurinational
State of Bolivia. Most of this output had been refined into cocaine in clandestine
laboratories, located in Colombia, since the 1970s. In the first half of the 1990s, the large
Colombian drug cartels were dismantled and international efforts to stem the trafficking
of coca paste from Peru to Colombia proved successful. As a consequence of low
demand, coca prices declined strongly in Peru, resulting in strong declines of coca leaf
production there. An unintended side-effect of this was, however, increased cultivation of
coca in Colombia. By 1997, coca cultivation in Colombia exceeded that of the traditional
growers for the first time, and by the year 2000, almost three quarters of the total area
under coca cultivation was in Colombia.
In the twenty-first century, the pendulum has swung back again. Coca cultivation in
Colombia decreased by 58% between 2000 and 2009, mainly due to large-scale
eradication. At the same time, it increased by 38% in Peru and more than doubled in the
Plurinational State of Bolivia. In addition, traffickers in both of these countries are now
able to produce their own refined cocaine. Despite the increases in Peru and the
Plurinational State of Bolivia, the global area under coca cultivation fell by 28% between
2000 and 2009, due to the strong declines in Colombia.

Figure 1: Global coca bush cultivation (ha), 1990-2009

      Total              250,000                                                                    221,300
      Colombia                      211,700
      Peru
                         200,000
      Bolivia
                                                                                                   163,300
              Hectares

                         150,000                                                                                                                                           158,800
                                   121,300
                         100,000

                                    50,300                                                                                                                                      68,000
                                                                                                      43,400                                                                    59,900
                          50,000
                                                                                                                                                                                30,900
                                    40,100
                                                                                                      14,600
                              0
                                    1990
                                           1991
                                                  1992
                                                         1993
                                                                1994

                                                                                     1997
                                                                                            1998
                                                                                                   1999
                                                                                                          2000
                                                                                                                 2001

                                                                                                                                      2004
                                                                                                                                             2005
                                                                                                                                                    2006
                                                                                                                                                           2007
                                                                                                                                                                  2008
                                                                                                                                                                         2009
                                                                       1995
                                                                              1996

                                                                                                                        2002
                                                                                                                               2003

                                                                   Source: UNODC.

In 2008, Colombia was responsible for about half of global production, with Peru
contributing over one third and the Plurinational State of Bolivia making up the balance.
The trend of falling coca leaf production in Colombia and rising levels in Peru and

                                                                                                                                                                                     7
Bolivia continued in 2009 (also in 2010, according to early indications). Today, it is
possible that Colombia and Peru have similar output levels.
Once purity is accounted for and seizures deducted, it is estimated that the amount of
cocaine available for consumption fell from over 700 tons in the mid-1990s to less than
500 tons in 2009.
Origin of cocaine in main markets
According to US authorities, some 90% of the cocaine consumed in North America
comes from Colombia.1 In 2009, the US Cocaine Signature Program chemically analysed
approximately 3,000 cocaine samples and found that 95.5% had originated in Colombia2
(down from 99% in 20023), with less than 2% coming from Peru, and the rest of
indeterminate origin.
No similar profiling program exists in Europe, but seizures indicate a more heterogeneous
profile. Between 2008 and 2010, about 25% of the volume of cocaine seized in Europe
could be traced back to Colombia, with 6% traceable to Peru and 2% to the Plurinational
State of Bolivia. 4 In the rest of the cases, only the transit countries could be identified. If
cocaine that could be traced back to the Bolivarian Republic of Venezuela, Ecuador and
Panama were added to the cocaine from Colombia, the ‘Colombia-linked’ cocaine
seizures in Europe would rise to 69% of the total (2008-2010 period).5
Cocaine produced in Colombia is mainly destined for consumption in overseas markets.
Cocaine produced in Peru and the Plurinational State of Bolivia, in contrast, are used
more within South America, notably in countries of the Southern Cone. Even though
cocaine produced in Peru seems to be playing a growing role in Europe, the criminal
groups organizing the trafficking of cocaine from South America to Europe are still
primarily Colombian. Unlike in the United States, the Mexican cartels seem to have
limited involvement in the European market.
Consumption
Although coca cultivation has been reduced, it does not appear that cocaine use has
similarly declined. Based on the data available, the share of the global population that
uses cocaine seems to have stabilised, but the global population has grown, resulting in a
larger number of consumers. In 2009, between 14 million and 21 million people used
cocaine at least once in the previous year.
1
US Department of State, 2011 International Narcotics Control Strategy Report, Washington D.C., 2011.
2
US Department of Justice, Drug Enforcement Administration, Special Testing and Research Laboratory, Cocaine Signature
Program Report, January 2010, quoted in Inter-American Drug Abuse Control Commission (CICAD), DEA Special Testing and
Research Laboratory and DEA Intelligence Division Briefing, OEA/Ser.L/XIV.2.47, CICAD/doc.1802/10, 3 May 2010.
3
US Drug Enforcement Administration, Selected Intelligence Brief, ‘Cocaine Signature Program Report,’ January 2003, in
Microgram Bulletin, Vol. XXXVI., February 2003.
4
Based on information from 13 European countries: Austria, Belgium, Bulgaria, France, Germany, Ireland, Poland, Portugal,
Romania, Spain, Switzerland, Turkey and the United Kingdom.
5
UNODC, Individual Drug Seizures database.
8The Transatlantic Cocaine Market
Figure 2: Global cocaine use (annual prevalence) from the late 1990s
to 2009/2010
25 0.6%
0.5%
in % of population age 15-64
20
16.0 16.2 15.9 15.6 0.4% 0.4%0.4% 0.4%
0.3% 0.4%
Million users
15 14.0 13.3 13.7 13.4 14.3 0.3%
0.3%
0.3% 0.4%
0.3%
10
0.2%
5
0.1%
0 0.0%
late 1990s
2001/02
2003/04
2004/05
2006/06
2006/07
2007/08
2008/09
2009/10
late 1990
2001/02
2003/04
2004/05
2006/06
2006/07
2007/08
2008/09
2009/10
Number in % of population age 15-64
Source: UNODC, 2010 World Drug Report and preliminary updates for 2009/2010.
There are at least two possible ways of explaining the simultaneous decrease in coca
cultivation and the increase in the number of cocaine users over the last decade:
! Due to improvements in both cultivation and processing technology, it seems
cocaine producers are squeezing more drugs out of every hectare they sow.
! The cocaine users of today are not using as much cocaine as those in the past.
This second point needs some explaining. Global cocaine consumption peaked during the
crack epidemic in the United States during the 1980s and early 1990s. In 1988, it is
estimated that there were 3.6 million cocaine addicts and 6 million casual users in the US,
consuming nearly 400 tons of cocaine at a cost of over US$60 billion.6 In contrast, there
is very little crack in the European market. Many of the emerging cocaine markets are in
relatively poor countries, where users are unable to afford much of the drug.
The drastic reduction in the size of the US cocaine market has had global repercussions.
Cocaine use in the United States has been in long-term decline since the late 1980s, with a
dramatic downward shift since 2006, related to disruption of the supply chain from
Mexico. A combination of factors - including increased law enforcement efforts in
Mexico and the transit zones, decreased cocaine production in Colombia, high levels of
cartel violence, and cocaine flows to non-US markets - appear to have contributed to the
reduced cocaine availability in the United States.7 As a consequence, purity-adjusted
cocaine prices in the United States rose by more than 80% between 2006 and 2009. The
impact this has had on cocaine use is clear from the national employee drug testing
results. Cocaine-positive urine tests (reflecting use in the past few days) showed a decline
of 68% between 2006 and the first two quarters of 2010. Similarly, positive hair tests
(reflecting cocaine use over the past three months) fell from 5.3% in 2007 to 2.3% over
the first two quarters of 2010 (-57%).
6
United States Office of National Drug Control Policy, What America’s Users Spend on Illegal Drugs, 1988-1995. Washinton,
D.C: ONDCP, 1997.
7
US Department of Justice, National Drug Intelligence Center, National Drug Threat Assessment 2010, February 2010.
9Figure 3: Positive urine tests for cocaine use among the US workforce,
2004-2010*
0.8
0.72 0.7 0.72
in percent of workforce 0.7
0.6 0.58
0.57 0.58
0.6
-68%
0.5 0.44
0.41
0.4
0.32
0.29
0.3 0.24
0.23
0.21
0.2
0.1
0
2004 2005 2006 2007 2008 2009 2010*
General US workforce Federally mandated, safety-sensitive workforce
*Positive tests for cocaine use among the general US workforce (4.2 million tests in 2009) and among the
federally mandated, safety-sensitive workforce (1.3 million tests in 2009). Data for 2010 refer to the first two
quarters.
Source: Quest Diagnostics, Drug Testing Index.
The opposite trend has been observed in West and Central Europe (EU-25 and EFTA
countries) over the last decade. The volumes of cocaine used in Europe have doubled
during this period, even though consumption stabilized from 2006 to 2009. Despite the
increase in Europe and the decline in North America, overall cocaine use levels in the
EU/EFTA region (annual prevalence of 1.2% among the population aged 15-64 in 2009)
are still only half as high in the USA (2.4% of the population aged 15-64 in 2009).
Figure 4: Annual prevalence of cocaine use among EU and EFTA countries
1.4%
1.2% 1.2% 1.2%
1.2%
in % of popuation age 15-64
1.2% 1.1%
1.1%
Annual prevalence
1.0%
1.0% 0.9%
0.9%
0.8%
0.8%
0.7%
0.6%
0.6%
0.4%
0.2%
0.0%
1998 1999 2000 2001 2002 2003 2004 2005 2006 2007 2008 2009
Sources: Annual Reports Questionnaire data; Government reports; UNODC, World Drug Report 2009; EMCDDA, Statistical
Bulletin 2009.
In Europe, most of the cocaine is consumed in the United Kingdom, Spain and Italy,
which between them contain some 60% of the cocaine users on the continent.
10The Transatlantic Cocaine Market
Figure 5: National shares of the cocaine-using population in Europe, 2008
Other E uropean
countries , 8%
E F T A countries ,
2% UK, 23%
Other E U countries ,
13%
F rance, 5%
Germany, 9% S pain, 21%
Italy, 19%
Sources: Annual Reports Questionnaire data; EMCDDA, Statistical Bulletin.
In addition, there has been a large, but largely uncharted, growth in demand for cocaine
base products in the Southern Cone of South America.
b) Evolution of trafficking routes
The shifts in demand have clearly informed transnational cocaine trafficking. In the late
1990s, the bulk of the world’s cocaine was still shipped to the United States. Over time,
this route came to be dominated by Mexican groups. The Caribbean, which was the
preferred transit zone when the Colombian cartels dominated the market, saw decreased
trafficking as a growing share was moved via the Pacific through Mexico into the United
States. The displaced Colombian traffickers increasingly focused on the growing
European market.
Traditionally, there have been several parallel streams of cocaine flowing into Europe.
Commercial air couriers, sometimes directed by West African groups, have flown to
Europe from various intermediate countries in the Caribbean. Colombian groups also
made use of commercial air carriers, often in cooperation with groups from the
Dominican Republic, with whom they have a longstanding relationship. Larger maritime
consignments were often stored on board ‘mother ships’ and transported to shore by
smaller vessels from the coast. The primary maritime points of entry were Spain (due to
proximity and cultural links) and the Netherlands (due to the large ports). These vessels
typically transited the Caribbean.
11Figure 6: Global cocaine flows, 1998 and 2008
Source: UNODC World Drug Report 2009 and UNODC calculations informed by US ONDCP, Cocaine Consumption Estimates
Methodology, September 2008 (internal paper).
Some time around 2004, Colombian groups began experimenting with routing their
cocaine shipments through West Africa. From 2005 to 2008, there was a dramatic series
of very large cocaine seizures in or near West Africa. Many of these involved ‘mother
ships’ intercepted by European navies. There were also incidents where modified small
aircraft were used. High-level officials were involved in some countries. There was also a
sharp increase in the number of cocaine couriers found on flights from West Africa to
Europe.
Around 2008, international attention to the issue, coupled with local political events,
resulted in a dramatic reduction in the number and volume of seizures, including both
maritime shipments and commercial air couriers. In 2008, only four large (over 100 kg)
seizures were made, and in 2009, only one. According to IDEAS, an air courier database,
in the second quarter of 2007, 59% of cocaine couriers detected were from West Africa.
In the third quarter of 2009, none were. Since then, some increases have again been
reported, to 5% in the fourth quarter of 2009 and, on average, 11% in 2010.
12The Transatlantic Cocaine Market
Figure 7: Significant cocaine seizures affecting West Africa, 2005-2011*
* January 2011
Source: UNODC individual drug seizure database and government sources
Despite this disruption, informal reports indicated that the trafficking continued. The use
of jet aircraft, which can fly deeper inland and land in remote areas, was detected, and
some analysts suggested this had become the dominant vector to Africa. There was less
clarity on how this cocaine was shipped to the European mainland once in Africa.
c) Current value and money flows
The value of the global cocaine market is most certainly lower than it was in the mid-
1990s, when prices were much higher and the US market was strong. In 2009 dollars, the
global market was worth some US$165 billion in 1995, and just over half of this in 2009
(US$85 billion).
13Figure 8: Value of global cocaine retail market in billion constant 2009 US$,
1995 and 2009
180 165
160
in contant billion 2009 US$
140
120
100 85
80
60
40
20
0
1995 2009
Sources: UNDCP, Economic and Social Consequences of Drug Abuse and Illicit Trafficking, Vienna 1997 (re-
valued based on US consumer price index) and UNODC estimates on the size of the global cocaine market for
2009, based on Annual Reports Questionnaire data and other government sources.
North America and West and Central Europe accounted for 86% of the global cocaine
market in economic terms in 2009. North America accounted for 47% and West and
Central Europe 39% of the total.
Figure 9: Regional breakdown of the value of the global cocaine market in
2009 in US$ billions (N = US$85 bn)
East Europe, 2
Asia, 2 Oceania, 2
Africa, 3
Latin America, 4
North America, 40
West and Central
Europe, 33
Source: UNODC estimates on the size of the global cocaine market for 2009, based on Annual Reports
Questionnaire data and other government sources.
While the North American market shrank over the last two decades – due to both lower
volumes and lower prices - the European market expanded. The US market remains,
nonetheless, the largest market globally, but the market of the EU and EFTA countries
(US$33 bn at retail level in 2009) is – in economic terms – now nearly as large as the US
market (US$37 bn in 2009).
14The Transatlantic Cocaine Market
Figure 10: Value of US and West and Central European cocaine markets,
1989-2009 (constant 2008 US$ billions)
140 134
120
111
100
87
80
71
62
60 56 54 50 49
43 44 45 44
36 35 36 35 37
40 32 34
32
34 33
31
20 26 26 27
21
18 18
14 14 14
0
1989
1990
1991
1992
1993
1994
1995
1996
1997
1998
1999
2000
2001
2002
2003
2004
2005
2006
2007
2008
2009
US Wes t & C entral E urope
Source: UNODC, World Drug Report 2010 and updates for 2009.
UNODC estimates that between 9% and 15% of Europe’s cocaine supply transited West
Africa in 2010, down from around 25% in 2007. This is not to imply that as much as 15%
of the retail value of this flow remained in West Africa, of course. The drugs are worth
much less in West Africa than at retail level in their destination markets, and the
ownership of these drugs may remain in foreign hands, with locals receiving only a
portion for their logistic assistance.
Informal reports have indicated that up to one third of the shipment is paid in kind to
service providers in West Africa, who then traffic most of this to Europe on their own
behalf. In addition, profits are made in supplying the West African cocaine market. The
potential wholesale profits affecting West Africa in 2009 would be in the neighbourhood
of US$800 million, equivalent to 0.2% of GDP in West and Central Africa. This is – in
relative terms – comparable to the cocaine-related profits made in the USA expressed as a
proportion of GDP (US$31.6 billion or 0.2% of GDP) and higher than the corresponding
proportion in West and Central Europe (US$23.1 billion or 0.1% of GDP).
These figures do not include profits made by West African citizens engaged in European
cocaine retail sales (mostly as European residents, illegal immigrants or asylum seekers).
European retail profits amount to some US$20 billion. West African groups play an
important role in cocaine street sales in several (mainly continental) European countries.
Assuming that the West African groups reap, on average, between 5% and 10% of the
European cocaine retail profits, this would amount to as much as US$2 billion in
potential cocaine-related income.
152. Current transatlantic trafficking routes
a) Overview
The global shift in demand has clearly affected trafficking routes, with much greater
volumes crossing the Atlantic by air and sea. It is estimated that close to 220 tons of
cocaine (26% of total cocaine exports) left the Andean countries for West and Central
Europe in 2009. Out of this amount, close to 60 tons (purity-adjusted) were seized in
other South American countries or in the Caribbean. Thus, close to 160 tons left South
America for West and Central Europe in 2009.
Table 7: Flows of cocaine, purity-adjusted*, to major consumer markets
(tons), 2009
Production 1,111
Less seizures in Andean countries -254
Less domestic consumption in Andean region -13
Amounts available for export out of the Andean 844
countries
Less seizures in other South American countries, -203
Caribbean and Central America
Less domestic consumption in other South -83
American countries, Caribbean and Central
America
Amounts available for export out of South 558
America, Caribbean and Central America
West and North
Central Europe America
Amounts of cocaine leaving the Andean countries 217 378
for West and Central Europe and North America
Less amounts seized in South America, Caribbean -59 -98
and Central America linked to trafficking flows to
West and Central Europe and North America
Amounts leaving South America (incl. Caribbean 158 280
and Central America) to West and Central Europe
(incl. 21 tons via
and North America
West Africa)
Less amounts seized by consumer countries of -35 -101
West and Central Europe and North America
Less amounts seized in West and Central Africa 0.4
Amounts of cocaine consumed in West and Central 123 179
Europe and in North America (incl. 159 in
the USA)
*Purity levels tend to decline along the trafficking chain. All numbers in this table have been adjusted to pure cocaine
equivalents. Seizure data were adjusted based on reported wholesale purity data.
Source: UNODC estimates based on Annual Reports Questionnaire data and other government or scientific sources.
16The Transatlantic Cocaine Market
The seizures in West and Central Europe (including seizures on the open sea off the
shores of Europe) amounted to some 35 tons (purity-adjusted), leaving 123 tons for
consumption in this region (range: 100 – 138 tons).8
An analysis of individual drug seizures reported in Europe suggests that more than 86%
of the drugs were trafficked directly, while around 13% were trafficked via West Africa.
This implies that the volume of cocaine transiting West Africa for Europe would be
around 21 tons.9 In addition, cocaine is trafficked to West and Central Africa – an area
with a population of more than 400 million people – for local demand, which could
amount to as much as 13 tons.10 Trafficking flows to West Africa could have amounted to
some 35 tons in 2009 (range: 21-55 tons), equivalent to 4% (2%-6%) of total cocaine
exports out of the three Andean countries. Of this, almost two thirds was for subsequent
onward transit traffic to countries in West and Central Europe.
Figure 11: Main global cocaine flows, 2009
Source: UNODC, World Drug Report 2010, updates for 2009.
8
The amounts of cocaine trafficked via the Atlantic to Europe are still relatively modest compared to the large amounts
trafficked to North America, a region with a population of 460 million people. UNODC estimates suggest that almost 380 tons of
cocaine (or 45% of total cocaine exports) leave the Andean countries towards North America. Seizures made in other South
American countries, in Central America and the Caribbean in relation to shipments towards North America are estimated at
slightly less than 100 tons (purity-adjusted). A further 100 tons of purity-adjusted cocaine seizures are made in North America.
Thus, out of 380 tons exported to North America only some 180 are available for consumption, of which the bulk (87%) is
consumed in the United States.
9
158 tons * 13.4% = 21 tons; range: 158*10.7% to 158 to 16% = 17-26 tons.
10
Consumption figures for West and Central Africa are only rough estimates. They are based on a limited number of surveys in
three West African countries and assumptions about (lower) cocaine consumption in countries which do not border the sea,
resulting in an average annual prevalence rate of 0.5% of the population aged 15-64. This is far lower than the reported
prevalence rate for the United States (2.4% of the population aged 15-64) or for West and Central Europe (0.8%) and
assumptions about per capita use levels in the region (12 grams per person per year) is less than half the levels reported from
North America or West and Central Europe (around 30 grams).
17b) Seizures in Europe
Overall cocaine seizure data for West and Central Europe showed a strong increase over
the 1998-2006 period, from 32 to 121 tons, followed by a significant decline over the
2006-2009 period, from 121 to 53 tons. When adjusted for purity, this was equivalent to a
decline from 87 tons in 2006 to 35 tons in 2009.
Table 8: Cocaine seizures in West and Central Europe (tons), 2006-2009
2006 2007 2008 2009
Spain 49.7 37.8 28.0 25.4
France 10.2 6.6 8.2 5.2
Netherlands 10.6 10.5 6.8 4.9
Belgium 3.9 2.5 3.9 4.6
Italy 4.6 3.9 4.1 4.1
United Kingdom 3.4 3.6 3.1 2.8
Portugal 34.5 7.4 4.9 2.7
Germany 1.7 1.9 1.1 1.7
Other 2.3 4.7 2.3 1.8
Total 120.9 78.9 62.4 53.2
Purity-adjusted* 87 55 42 35
* based on wholesale-purities
Source: UNODC ARQ.
This remarkable decline in seizures is more than offset by an increase in seizures in South
American countries, however, including strong performances in Argentina, Brazil, the
Plurinational State of Bolivia, Colombia, Ecuador and Uruguay. Several of these
countries showed a doubling of the volumes seized between 2006 and 2009, but the vast
bulk of the total increase is due to the remarkable growth in seizures in Colombia. In
2009, Colombia reported seizing nearly 275 tons of cocaine, an all-time world record.
This was almost 100 tons more than in 2006, more than compensating for the decline in
European seizures (down about 68 tons).
Figure 12: Cocaine seizures in Colombia, 1980-2009
300
250
tons of cocaine seized
200
150
100
50
-
1980
1982
1984
1986
1988
1990
1992
1994
1996
1998
2000
2002
2004
2006
2008
Source: UNODC DELTA.
18The Transatlantic Cocaine Market
There may be several reasons for this increase, aside from strong performance by
Colombian law enforcement officials. There is growing evidence that cocaine is being
cut with adulterants in the production countries, so it is unclear what share of these
seizures is pure cocaine. Some European law enforcement agencies have also been
engaged in ‘upstream’ work, helping their South American counterparts to stop
cocaine seizures before they depart the continent.11 Consequently, the decline in
seizures in Europe is not necessarily an indicator of a decline in European law
enforcement performance.
Figure 13: Tons of cocaine seized in the United Kingdom versus drug
interdictions in which the Serious Organized Crime Agency
(SOCA) participated
90 85.1
80
70
60
50
40
30
20
10
2.8
0
Seizures in the UK (2009) SOCA seizures (2008/9)
Source: ARQ and SOCA Annual Report 2008/9
So has the supply of cocaine to Europe increased or decreased? If supply were under
pressure, an increase in price and/or a decrease in purity would be expected. Prices
have increased in a number of European countries, while declining in others.
Adjusting for inflation and weighting by population, the average retail price of a gram
of cocaine in West and Central Europe declined from 44 euros per gram in 1999 and
40 in 2006 to 39 euros in 2009 (constant 2009 euros).
11
See, for example, the Annual Report of the British Serious Organized Crime Agency (SOCA) for the year 2009/10, p 14.
19Figure 14: Population-weighted average price of a gram of cocaine at
street purity in constant 2009 euros
euros per gram of cocaine at street purity 90.0
80.0
70.0
60.0
50.0
40.0
30.0
20.0
10.0
-
1990
1991
1992
1993
1994
1995
1996
1997
1998
1999
2000
2001
2002
2003
2004
2005
2006
2007
2008
2009
Source: UNODC ARQ.
There are, however, indications that purity has significantly declined in a number of key
markets. In the United Kingdom, average purity was tested at 75% in 1998; by 2009, it
was only 63%. Other countries show different trends, and a number have very little data
to assess. Based on unweighted averages, however, it appears that European cocaine
purity has declined from around 74% in 1999 and 72% in 2006 to 65% in 2009. This
decline offsets the price decline. The overall effect suggests a small decline in cocaine
availability. Cocaine is still reaching the market in Europe, however, and much less is
being seized on the continent.
Figure 15: Unweighted purity levels of cocaine seized in Europe,
1998-2009
0.80
Percentage purity of cocaine samples tested
0.70
0.60
0.50
0.40
0.30
0.20
0.10
0.00
1998 1999 2000 2001 2002 2003 2004 2005 2006 2007 2008 2009
Source: UNODC ARQ.
Trends can also be detected in national annual seizures. For decades, the main entry point
for cocaine into Europe has been Spain, reflecting the close cultural ties with Latin
America. Spain accounted for 45% of all European cocaine seizures made over the 1998-
2008 period. Despite a decline in the volumes seized, this increased to 48% in 2009.
20The Transatlantic Cocaine Market
Cocaine seizures in Spain rose from 12 tons in 1998 to 50 tons in 2006 before falling back
to 25 tons by 2009, the lowest figure since 2002. Most of these seizures appear to have
originated in the Bolivarian Republic of Venezuela and Colombia, and most were seized
in international waters.
Figure 16: Countries from which individual cocaine seizures reported in
Spain were shipped, 2008-2010
Others
16%
Venezuela
Peru
37%
6%
Dominican Rep.
6%
Ecuador
8%
Colombia
27%
Source: UNODC ARQ.
Figure 17: Location of Spanish seizures, 2008-2010
Other
15%
Coastal
2%
Airports
6%
Containers
11%
International
waters
66%
Source: UNODC ARQ.
Seizures made by the Portuguese authorities reflect the patterns seen in Spain. There was
a strong increase in seizures from 1998 (0.6 tons) to 2006 (34 tons) and a decline to 3 tons
in 2009. This reflects the growth and decline of West Africa as a transit zone, particularly
the use of the Lusophone countries (Guinea-Bissau and Cape Verde). While in 2005 and
2006 Portugal reported the second largest cocaine seizures in Europe after Spain, its
importance dropped, and by 2009, it ranked 7th. A number of additional potential
explanations have been put forward for the decline in seizures, including more direct
shipments from West Africa to final destinations in Europe, the use of containers or high-
speed boats to smuggle drugs into the country, and the use the Azores islands instead of
mainland Portugal as a transit zone. In 2009, the most commonly cited sources of cocaine
21shipments were Brazil (33% of all seizures by volume) and the Bolivarian Republic of
Venezuela (13%).
For many years, the Netherlands was Europe’s second largest entry point of cocaine after
Spain, reflecting inter alia the importance of Rotterdam as Europe’s largest port as well as
cultural ties with a number of islands in the Caribbean. Seizures in the Netherlands have,
however, declined sharply in recent years, from 15 tons in 2005 to 5 tons in 2009.
Although this was still the third largest cocaine seizure total in Europe (after Spain and
France), it was the lowest Dutch cocaine seizure total since 1995.
The decline seems to have been at least partly due to growing efforts to stop shipments
before they leave their ‘origin.’ For example, in 2008 the National Crime Squad arrested
several people suspected of planning to transport 2.6 tons of cocaine from a warehouse in
Sao Paulo to the Netherlands, before the shipment actually took place. In addition, the
‘100% control’ strategy in the Antilles and Schiphol airports appears to have deterred the
use of air couriers.
Large amounts of cocaine continue to be seized by the coastguards of the Dutch Antilles
and Aruba. Out of 6.8 tons seized in 2008, 4.2 were taken by the Dutch navy from a cargo
vessel sailing under a Panamanian flag from the Bolivarian Republic of Venezuela to
Europe. Another factor may be diversions to Belgium, notably the port of Antwerp. Thus
cocaine seizures reported by Belgium – in contrast to the overall trend in Europe –
increased from 2.5 tons in 2007 to 4.6 tons 2009, giving Belgium the fourth largest
cocaine seizure total in Europe in 2009.
In 2008 and in 2009, the second largest annual cocaine seizure total in Europe was
reported by France, even though French cocaine seizures fell from 10 tons in 2006 to 6
tons in 2009. The bulk of French cocaine seizures was made at sea, mostly close to West
Africa or close to the French overseas territories in the Caribbean. In 2009, the largest
source country for cocaine shipments to France was the Bolivarian Republic of Venezuela
(35% of the total).
Figure 18: Departure location of cocaine seizures in France, 2003-2008
Unknown
28% Venezuela
34%
Central America
1%
Caribbean
14% Brazil
12%
Other S. America Colombia
6% 5%
Source: OCTRIS.
Some 21% of the cocaine entered France via the Iberian Peninsula in 2009, with the
Netherlands also being an important transit country, but direct shipments from the French
22The Transatlantic Cocaine Market
Caribbean are gaining in importance. Maritime shipments are of less importance to
France than to Spain, however, with just over a third of the seizures occurring at sea. Less
than half (44%) of the cocaine seized in France in 2009 was destined for the local market,
with the UK being the destination of 20% of all the seizures made.
Cocaine seizures in the United Kingdom have also seen a downward trend over the 2006-
2009 period, from 3.4 to 2.8 tons. This downward trend was, however, less pronounced
than in several other European countries. The UK ranked sixth in terms of seizures made
in Europe in 2009. These figures may be misleading, however, as many large seizures are
nowadays made ‘upstream’, that is, in the transit countries or countries of origin, based on
intelligence gathered by UK authorities and shared with the respective local authorities in
order to prevent such shipments to the UK. Thus, the UK’s Serious Organised Crime
Agency (SOCA) reported the worldwide interdiction of 73 tons of cocaine in 2006/2007,
84 tons in 2007/2008 and 85 tons in 2008/2009 that would otherwise have landed in the
UK.12
Cocaine trafficking to the UK – Europe’s largest cocaine market – is dominated by
shipments of cocaine from the Iberian peninsula, which subsequently transit France for
final destinations in the British Isles, and, to a lesser extent, by shipments from the
Netherlands and Belgium. UK authorities estimate that some 75% of the cocaine transits
continental Europe before reaching the UK. Main entry points for cocaine into the UK are
the Channel Tunnel, Dover, Felixstowe, Folkestone and Harwich. The UK authorities
estimate that between 65% and 70% of the cocaine originated in Colombia, most of the
rest (30%-35%) in Peru and the balance from the Plurinational State of Bolivia. The
Bolivarian Republic of Venezuela was identified as the main cocaine transit country in
the Americas in 2009.
The UK authorities also reported the emergence of cocaine shipments through the
Balkans. Serbian and Montenegrin crime groups have been involved in these trafficking
activities, exploiting links and associations with Southern Cone countries in South
America. This cocaine is mainly of Peruvian or Bolivian origin. In addition, cocaine is
being shipped from West Africa into the UK. Direct shipments of cocaine from the
Andean region into the UK also exist, but are still exceptions. However, the UK
authorities also report an increasing use of sea containers to transport cocaine, either
directly to the UK or to mainland Europe, with Spain, the Netherlands and Belgium being
favoured destinations. Examples include container shipments from Costa Rica to the UK
and the Netherlands, and from Chile to Spain.
The fifth largest European cocaine seizures in 2009 were reported by Italy. Seizures in
Italy declined slightly, from 4.6 tons in 2006 to 4.1 tons in 2009. Surprisingly, Mexico
has traditionally been identified as the largest ‘country of origin’ of cocaine shipments,
alleged to be the proximate source of 24% in 2008, ahead of Spain (21%). In 2009,
Mexico dropped from this position, to be replaced by the Bolivarian Republic of
Venezuela, Spain and the Netherlands. In addition, the Italian authorities have reported
increasing trafficking of cocaine via the Balkan countries to Italy. In contrast to other
countries with direct access to the sea (such as Spain, Portugal, the Netherlands or
Belgium) just 3% of the cocaine seizures in 2009 were reported to have been made at sea
or at seaports in Italy.
Figure 19: Location of Italian seizure cases, 2009
12
Serious Organised Crime Agency, Annual Report, 2008/09, London 2009, p. 42.
23Other Sea and ports
3% 3%
Roads
39%
Airports
55%
Source: UNODC Individual Drug Seizures database.
c) Commercial air couriers to Europe
While the bulk of the cocaine enters Europe by sea, commercial air couriers remain an
important vector for trafficking. Based on information collected from Member States in
the Annual Reports Questionnaire, about 21% of Europe’s cocaine supply comes by air.13
This includes shipments that may have originally been maritime, but which entered
Europe through the airports. The amounts trafficked by air into Spain, Europe’s main
cocaine entry point, were equivalent to just 6% of the total, but far higher proportions
were reported from Austria (90%), Germany (62%), Italy (55%), Switzerland (50%) and
the UK (50%). Most of these countries report other European counties as the proximate
source of their cocaine.
Figure 20: Breakdown of national source of cocaine seized from
commercial air couriers in Europe
Other
14%
Panama
2%
Argentina Colombia
4% 36%
Ecuador
5%
Venezuela
5%
Bolivia
5%
Brazil
Dominican Rep
7%
Peru 11%
11%
Source: UNODC Individual Drug Seizure database.
13
This share is supported by information collected in UNODC’s individual drug seizure database, where air-related cocaine
seizures comprised 20% of the total volume seized in West and Central Europe over the 2008-2010 period. Sea-related seizures,
in comparison, amounted to 77% .
24The Transatlantic Cocaine Market
While air couriers were responsible for a small share of the volume imported, they made
up the majority of cocaine trafficking cases: each courier carries only a small amount of
the drug, but a large number of them make the attempt. Due to its value to volume ratio,
cocaine is a particularly attractive drug for air couriering. Cocaine accounted for 83% of
all air-related drug seizure cases capture in UNODC’s database for the 2008-2010 period
in West and Central Europe.
d) Maritime trafficking
Data reported to UNODC by Member States suggest that 59% of the cocaine seized in
West and Central Europe in 2009 was seized while still at sea or at ports. Above-average
proportions were reported from Greece (83%), Belgium (80%), Spain (77%), Portugal
(75%) and Ireland (70%). Based on individual drug seizures, sea-related cocaine seizures
comprised 77% of the total amounts of cocaine seized in West and Central Europe over
the 2008-2010 period.
e) Maritime trafficking routes through the Caribbean
The Bolivarian Republic of Venezuela has emerged as a key transit country for shipments
to Europe, particularly for large maritime shipments. The largest cocaine seizure in 2008
was 4.1 tons of cocaine seized from a commercial vessel coming from the Bolivarian
Republic of Venezuela, and 2.5 tons were also seized on a fishing boat from that country.
According to the Maritime Analysis Operation Centre (MAOC-N), more than half (51%)
of all intercepted shipments in the Atlantic during the 2006-2008 period started their
maritime journey in the Bolivarian Republic of Venezuela. A further 11% of the
shipments could be traced back to various Caribbean countries.
Figure 21: Departure locations of identified drug trafficking shipments by
sea from South America to Europe, 2006-2008
Other
12%
Wes t
Africa
11%
Colombia Venezuela
5% 51%
Caribbean
11%
B razil
10%
Source: Maritime Analysis Operation Centre.
Data from the UNODC individual drug seizures database (IDS) confirm the key role
played by the Bolivarian Republic of Venezuela as a transit country for cocaine shipments
to Europe by sea.14 In the IDS database, the Bolivarian Republic of Venezuela is followed
by Colombia (25% of the total over the 2008-2010 period), Ecuador (10%) and the
Caribbean region (7%), of which the Dominican Republic alone accounts for 5%.
14
46% of the total over the 2006-2008 period; 44% over the 2008-2010 period.
25MAOC-N reports that sailing vessels travelling from the Caribbean to Europe are the most common source of seizures, followed by freight vessels, and other motor vessels. In contrast, semi-submersibles, which have gained strongly in importance in trafficking cocaine from Colombia to Mexico in recent years, do not as yet play any significant role in Europe. Only one has been sighted, in Galicia, northern Spain in 2006, and this craft was not used for any cross-Atlantic journeys but to ship cocaine from ‘mother-ships’ arriving off the coast of Spain to hidden locations along the coast. f) Maritime routes to West Africa In the past few years, the most innovative element in trafficking cocaine to Europe has been the emergence of trafficking routes via West Africa. These routes gained strongly in importance over the 2004-2007 period, before appearing to lose some of their importance in 2008 and 2009. Based on estimates of cocaine demand and information on the origin of seized cocaine in Europe, the amounts trafficked via West Africa increased from just 3 tons in 2004 to around 47 tons in 2007, before falling back to some 21 tons in 2009. Adding the amounts estimated to be consumed locally in West and Central Africa (some 13 tons in 2009) and the purity-adjusted seizures made in recent years suggest that cocaine flows to West and Central Africa rose from 15 tons in 2004 to 62 tons in 2007 before falling back to some 35 tons in 2009 (range: 21–55 tons). Contrasting these cocaine trafficking flow figures with (purity-adjusted) seizures reported in the countries of West and Central Africa, just 3% of the amounts trafficked to or via West Africa were seized by countries in this subregion over the 2004-2009 period, far less than in other regions. With cocaine seizures of just 0.5 tons reported from the countries of West and Central Africa in 2009 (down from 2.3 tons in 2008 and 4.6 tons in 2007), the proportion of seizures made out of the amounts trafficked to or via West Africa fell to just 1% in 2009. 26
You can also read