Who is more equal? Access to tertiary education in Europe - Jan Koucký, Aleš Bartušek and Jan Kovařovic Prague 2009
←
→
Page content transcription
If your browser does not render page correctly, please read the page content below
CHARLES UNIVERSITY IN PRAGUE
          FACULTY OF EDUCATION
          EDUCATION POLICY CENTRE

Who is more equal?
Access to tertiary education in Europe
Jan Koucký, Aleš Bartušek and Jan Kovařovic
Prague 2009
The study Who is more equal? Access to tertiary education in Europe was developed thanks to financial support from the Ministry of Education,Youth and Sports of the Czech Republic. Studie Kdo je rovnější? Přístup k terciárnímu vzdělání v Evropě vznikla díky finanční podpoře Ministerstva školství, mládeže a tělovýchovy České republiky (MŠMT ČR). © Charles University in Prague, Faculty of Education, 2009 © Univerzita Karlova v Praze, Pedagogická fakulta, 2009 ISBN 978-80-7290-391-7
Who is more equal?
Acces to tertiary education in Europe

Jan Koucký, Aleš Bartušek and Jan Kovařovic

Education Policy Centre, Faculty of Education, Charles University
Prague 2009
Contents

     Preface								                                                5

 1   Theoretical background						                                   7

 1.1 Social changes and the development of education			             7

 1.2 Key concepts—inequalities and equity					                      8

 1.3 Expansion and diversification of tertiary education			         10

 1.4 Expansion and inequalities						                               11

 2   Analytical process							                                      13

 2.1 Data and variables							                                      13

 2.2 Conceptual model and Inequality index					                     17

 2.3 Correction of the post-2000 period					                        18

 3   Results of the study							                                    21

 3.1 Changing family background and participation in education		    21

 3.2 Inequality index in access to tertiary education 1950–2007		   24

 3.3 The profiles of family background factors				                  26

 3.4 Expansion of tertiary education and inequality in access			    28

 4   Conclusions								                                            31

     References								                                             32

     Annex: Profiles of European countries				                      34
Preface
Preface
About the project. The study Who Is More Equal? Access and explain in more detail the situation and development trends
to Tertiary Education in Europe (both in Czech and English) as regards access to tertiary education in the Czech Repub-
is the output of the second stage of the project Inequality in lic. The study will draw on the Czech data from ESS and, most
Access to Higher and Tertiary Education in the Czech Re- importantly, from the aforementioned special Czech survey of
public and other European countries, carried out since 2007 2007/2008. The Czech national study will, of course, make use
by the Education Policy Centre (EPC) at the Faculty of Education, of the analytical procedures already developed and the available
Charles University in Prague for the Ministry of Education, Youth results of comparisons with other European countries. Moreo-
and Sports of the Czech Republic. ver, it will show other conceptual, methodological and empiri-
The objective of the first stage of the project in 2007 was cal approaches and new directions in analysing access to tertiary
to find out whether, to what extent and how it is possible to use education and the impact of social background and educational
databases of the first two rounds of the European Social Survey attainment on graduate employment.
conducted in 2002/2003 (ESS-1) and 2004/2005 (ESS-2) for the The project will continue in 2010 by the fourth stage. As
purpose of examining and analysing the degree of inequality in part of this stage there will be several major developments. The
access to tertiary education in the Czech Republic and other EPC will make use of the comments to this study that will be
European countries. Another aim was to develop, on the basis received in the following months and that may result in innova-
of analyses of the combined set of data from the first two ESS tion of the methodology used. At the end of 2009 data will be
rounds, indicators and a model (models) of inter-generational available from the fourth stage of ESS-4 of 2008/2009. These
transmission of inequities in access to tertiary education, and to data will, again, make it possible to update and further expand
interpret the outcomes. Finally, the third objective was to pro- the database, to extend the sets of respondents and probably
pose implementation of the project in the following stages. also to increase the number of countries included in the study
The output of the first stage of the project was an analytical (according to data of April 2009 a total of 31 countries are par-
study Inequality and Access to Tertiary Education: European ticipating in ESS-4)2. The most important change will consist in
Countries 1950–2005 (by Jan Koucký, Aleš Bartušek and Jan the fact that the new analyses will not limit their focus only on
Kovařovic), published as an EPC working paper in 2007.The study access to, and outcomes of, tertiary education, but will try to
contained a definition of the theoretical and conceptual contexts, provide a comprehensive picture of the relationships between
a proposal for methodological approaches and the actual analy- family background, access to education, the position of gradu-
sis of 22 European countries (the analysed set of data included ates on the labour market and their social status, that is they
72 694 respondents). The study was developed in both a Czech will include also effects of tertiary education. The fourth stage
and English version to be used as part of the OECD project Terti- of the project will be completed by an extensive comparative
ary Education Review; in the final report (OECD 2008) the out- study the working title of which is Tertiary Education Be-
comes of the study were indeed used and quoted. The English tween Origin and Destination.
version of the study was sent to some thirty international ex- About the study. The initial chapter of this study provides,
perts for comments. The comments received were used by the above all, an outline of the theoretical background and concepts
EPC during the second stage of project implementation. related to the issues addressed. In addition to the social and in-
The objective of the second stage of the project in 2008 dividual reasons behind the gradual development of tertiary edu-
was to develop a more extensive comparative analysis of inequal- cation it tracks changes that are associated with expansion of
ity in access to tertiary education in 23 European countries. To access to this education and explains the formation of one of the
this end the theoretical/conceptual context prepared, tested and main objectives of current education policies—the principle of
commented upon during the first stage were used, as well as, and equity. Furthermore, the chapter deals with inequalities in access
most importantly, the methodological approach which had to be to tertiary education in general, and with diversification of terti-
streamlined on the basis of the comments and other innovation ary institutions and changes in their structure as an implication
proposed. The empirical data from the ESS database were ex- of expansion of tertiary education. In conclusion it explains the
panded to include the relevant data from the third stage of ESS-3 rationale behind the approach taken by the EPC to the develop-
of 2006/2007 and complemented by data from a special Czech ment of this study.
survey conducted at the turn of 2007/2008. The new data made The second chapter presents the empirical sources of
it possible not only to update but also to expand considerably analyses and explains, always using specific examples of two
the analysed sets of respondents in most European countries1, countries, the methodological approaches developed. It de-
which, understandably, brought a number of major benefits. The scribes the analysed set of ESS data and variables used in the
study Who Is More Equal? Access to Tertiary Education in analysis, and explains the method of defining the age cohorts
Europe that is now presented is the output of the second stage representing the individual historical periods. Moreover, the
of the project. chapter describes the model used to analyse inequalities in
The aim of the third stage of the project in 2009 is to de- access to tertiary education and the resulting indicator—the
velop a Czech national study (only in Czech) that will describe Inequality index. Finally, it describes the principle of revising
1)
The analysed set of data created by combining national sets for 23 European countries includes a total of 115 695 respondents. The size the individual country sets normally
ranges from 3 to 6 thousand respondents.
2)
It may be expected that the analysis will concern 25–28 countries. The overall set will have between 160–180 thousand respondents and the size of individual country sets will
range from 4 to 8 thousand respondents.
Who is more equal? 5Preface
the Inequality index values for the youngest age cohort in the family background factors. Finally, the chapter analyses the influence
most recent period. of expansion of tertiary education on the level of inequality.
The third, and the longest chapter presents the main results of The annex to the study presents the results of the analyses
the analysis of the level of inequalities in access to tertiary education carried out for Europe as a whole and for each of the 23 par-
in 23 countries over the last fifty years, and also the results of other ticipating countries. The short (one-page) profiles of all countries
subsequent analyses. It assesses the overall level of inequalities in have been developed using a uniform approach and style. They
access to tertiary education according to the Inequality index, and contain the same indicators, which ensures their comparability.
documents the development of inequalities in Europe as a whole Before studying individual countries it is advisable to study the
and in various countries. The chapter tracks the development of profile of Europe which, in addition to providing the results of
the family background structure for various generations of young the analysis, refers to the terms and concepts used, and describes
people, the changing education and occupational profile and social how the indicators have been identified, what they mean and how
status of their parents and the changes in the impact of various they can be interpreted.
6 Who is more equal?Theoretical background
1 Theoretical background
The initial chapter places the study within a broader theoreti- moves from industry to traditional services). The last two decades
cal context.The first part of this chapter explains what economic, of the 20th century witness another change where knowledge, in-
political and social reasons resulted in expanding higher—or more novation and information, as well as the human capacity to acquire
precisely tertiary—education, and describes how the enlarging of knowledge, make use of it and learn, become the main productive
access to this education changed its roles and functions. It is con- force in the society of knowledge.
cerned with key concepts, as equal opportunities, inequalities in Higher education is not only associated with a higher level of
access to tertiary education and a gradual establishment of the employability and income (and, consequently, higher living standards),
equity principle as one of the main objectives of current education but it is also considered to be a key factor of economic growth and
policies. The next part then deals with expansion of tertiary edu- technological advancement (among best-known and most impor-
cation, which not only facilitates a much higher participation rate, tant authors belong f.i. Becker, Blaug, Dennison, Harbison, Mincer,
but also necessarily results in diversification of tertiary institu- and Schultz). It was as early as the 1960s that the theory of human
tions and changes in their structure. It discusses some interpreta- capital emerged and gained recognition with an assertion that the
tions of the impact of expansion on the development of inequali- capacities and education of people were more important (and yield-
ties in access to tertiary education. The final part of this chapter ing better returns to investment both to society and individuals)
explains and justifies the approach adopted by this study. than other forms of capital. However, the following decades saw a
certain sobering up from overly optimistic expectations of the so-
cial benefits of investment in education (economic analyses repeat-
edly confirmed that the individual returns of education were higher
1.1 Social changes and the than those to society, e.g. Psacharopoulos 2002). It was pointed out
development of education that some of the premises of the human capital theory were un-
tenable (Wolf 2002), and attention was increasingly drawn to the
The role and position of education in modern European so- importance of the signalling and allocating functions of education.
ciety underwent substantial changes in the course of the second However, the importance of education for the development
half of the previous century. Higher levels of education were tra- of society and the economy has been increasingly stressed again
ditionally open to a relatively tiny group of the population. Unlike as a result of the gradual process of European integration and
primary and later on, to a degree, also secondary education they the building of the common market. This process is further rein-
remained for a much longer time highly elitist both in terms of forced by much stiffer global competition that requires that the
the chances of its acquisition and in terms of the nature of edu- potential of the entire population (preferably all social groups
cation provided. Participation in higher education was very low and individuals) be used in full, and therefore their education and
even just before WWII1. However, the rate of participation (i.e. qualifications be enhanced as much as possible.
the proportion of students in the relevant age cohort) in terti- The same requirements are, however, also stipulated by the
ary education increased significantly in developed countries over development of society and politics. The post-war democrati-
the last fifty years. This has changed the structure and nature of sation of education (first at upper secondary level, only later at
universities and other tertiary education institutions as well as, tertiary level) was perceived as a substantial widening of rights
and most importantly, the social functions and roles of tertiary and liberties of citizens and thus as part and parcel of the overall
education. The enormous growth in the share of the population post-war democratisation in Europe. It was also linked with great
studying at tertiary education institutions was the consequence expectations—some important political programmes assumed
of economic, political and social changes. that education would become an effective instrument in tackling
The economic prosperity in developed Europe after WWII poverty and bringing more justice.
brought about major changes at the labour market and in terms Anyway, education is a prerequisite for upholding democratic
of employment structure. Jobs were created in large numbers and society that requires full participation in civic life. While some
there were increasing requirements for well-prepared and skilled other bonds holding society together have been weakened, the
workforce. This was caused by a continuous emergence of new education system is expected to function as an integrating force,
technologies and the related growth in productivity, new trends in limiting marginalisation and even exclusion of individuals and
consumption, expansion of international trade and changes in the di- social groups. Education has a major influence not only on the
vision and organisation of labour. Moreover, transition from agrarian stability and cohesion of society as a whole, but also on the de-
societies of the previous centuries, where man depended primarily on velopment and the quality of life of each individual; it facilitates
land for his livelihood (still in 1870 nearly a half of the population of a larger degree of sharing the cultural wealth, establishment of
Western Europe worked in agriculture), to industrial societies, where broad social networks and healthier lifestyles.
man operated machines (the bulk of work took place in factories), Attention is currently focused not only on quantitative growth,
was completed. In the second half of the 20th century the industrial but also on the actual distribution of educational opportunities
era gradually comes to an end2 and work in service society society in society. Nearly all developed countries seek, in addition to in-
focuses more on trade, transport and similar activities demanding creasing the overall rate of participation in education, to increase
in terms of human labour (the largest proportion of employment and equalise participation of all social strata regardless of their so-
I)
Participation in higher education did not exceed 2 % of the age cohort at that time. Also it was increasing only very gradually, at the end of the 19th century it amounted to 1 %
of males of the age cohort and almost no females (Wolf 2002). It exceeded 10 % only in the mid-1950s and only in some European countries.
2)
This development has been reflected in the theory of post-industrial society (Bell 1973).
Who is more equal? 7Theoretical background
cial, economic, culture or ethnic background, and to ensure equal tors4 remains to be strong in most countries. To certain extent,
opportunities (or equity) for each individual. Efforts to overcome it is an unintended consequence of the concept of meritocracy
social inequality in access to higher education therefore consti- that is therefore justly criticised on the grounds that, although
tute one of the principal characteristics of modern democratic it emphasises competence and results, in fact it favours those
society. Ensuring equal access to education based on individuals’ who have had better conditions for achieving them only due to
ability and results (the concept of meritocracy) and not on as- a more stimulating and richer (in economic, social and cultural
criptive factors (i.e. the social, cultural and economic status of the terms) family background (see for example Arrow, Bowles and
family) has become a generally declared and acknowledged goal. Durlauf 2000, or Bowles, Gintis and Groves 2008). The concept
Equity has become, along with quality and efficiency, one of the is even blamed for covering up the real causes of inequality by
main objectives of education policies of developed countries as presenting socially determined (and therefore ethically unaccept-
well as and international organisations, namely of the European able) inequalities as being the natural (and therefore legitimate)
Union, the OECD and the UNESCO (D´Addio 2007). inequalities in individual abilities and performance (Bourdieu et
There exist many grounds for it—and again on multiple levels, Passeron 1970).
economic, socio-political and ethical. Equal access to education for Inequalities in education are subject to systematic and inten-
members of all social groups and strata facilitates the development sive research that started as early as the 1960s and 1970s (for
of the potential of the entire young generation and, in this way, en- example Coleman and Jencks in the USA, Halsey and Golthrope
sures the most effective use of their talents and aptitudes for the in the United Kingdom, Boudon and Bourdieu in France, Gold-
benefits of the economy and society. It maintains social cohesion, schmidt and Müller in Germany, Husén and Ericsson in Sweden
as it facilitates changes in social status (status mobility) between belong among authors of most important works), also some
the generations of parents and children. It prevents various classes major international comparative studies were carried out (e.g.
and groups from becoming increasingly closed towards each other Boudon 1974, OECD 1975 and a later summary by Husén, 1987).
and distanced. It prevents some from accumulating privileges and Since then sociological theory as well as empirical research have
others from being pushed to the margins of society and, in this way, sought to ascertain and explain whether, to what degree and how
prevents otherwise inevitable social conflicts. Finally, equal chances education systems in various countries help overcome barriers
in life constitute one of the foundations of understanding justice in in society, or, on the contrary, whether they act as instruments
democratic societies, as all human beings should have the same hu- for inter-generational transmission of social status from parents
man rights, which must also apply to their right to education. to children. Various authors stress different components of this
The individual function of education has been strengthened complex process and focus on its various aspects and levels.Their
as well. It was particularly in the post-war period of democratisation theories (e.g. the social and cultural theory of transmission of
of society, which brought about extensive opportunities of enhancing educational attainment) and models (e.g. the socio-psychological
individuals’ social status and life, that education became a major factor model of the stratification process) tend to be complementary
of upward mobility, “the way up”. Education attained became an im- rather than mutually exclusive.
portant component of the social status of each individual and his/her For the purpose of analysing the causes and implications of
family, and a factor of change.Tertiary education was indeed viewed as inequalities Pierre Bourdieu (1986) defined various forms of capi-
a relatively reliable “lift” to social success: to interesting and prestig- tal that are essential in terms of generating social inequalities and
ious work, high living standard and style, and good social position. their transmission. Based on the definition of economic capital,
Efforts to increase one’s position (and/or that of one’s own chil- which was the starting point, he also produced definitions of cul-
dren) naturally resulted in an unprecedented growth of educational tural and social capital. They are used above all in European con-
aspirations in all groups of society. Although individual demand for text, while in the USA the focus is on economic capital and also
education does not always correspond to abilities or future po- on intelligence. The distribution of the various forms of capital in
sition on the labour market, yet it has become the main driving society is very uneven, and their surplus or deficit leads to vari-
force of the quantitative expansion of education.3 After decades ous forms of inequality. Also ways how to alleviate or compensate
of expansion, tertiary education—today acquired by a substantial them differ. From the point-of-view of our study, it is important to
proportion of young people—is seen more as a safeguard against know that there exists a close relationship between above forms
social decline than as a lift, a safeguard that is even no longer en- of capital and indicators characterising occupation and education
tirely reliable (Keller 2008). Problems thus raised provoke a certain of both parents.
tension between social and individual functions of education. Economic capital is described, above all, in terms of the material
and financial status of a family. A low level of this status is the most
apparent: a poor economic situation either prevents individuals
from studying or results in their dropping out of education and en-
1.2 Key concepts—inequalities and tering employment. The influence of economic capital on inequali-
equity ties in access to tertiary education was the first aspect to be taken
into account, and efforts were made to alleviate it (at least to a
Although equal access is formally guaranteed in almost all degree) by various forms of financial support. Inequalities arising
systems of tertiary education in developed countries, the in- from uneven distribution of cultural and social capital were at first
fluence of ascriptive (that is independent of the individual) fac- problematic in terms of acknowledging their existence, and then it
3)
An excellent analysis of the above tendencies was carried out by an international team led by Professor Kjell Harnquist thirty years ago (OECD 1979).
Ascription occurs when social class or stratum placement is primarily hereditary. In other words, people are placed in positions in a stratification system because of qualities
4)
beyond their control. Race, social class, strata or group (parental characteristics), sex, age, and ethnicity are good examples of these qualities. Ascription is one way sociologists
explain why stratification occurs.
8 Who is more equal?Theoretical background
was uneasy to pinpoint their manifestations and causes. And this is For some forty years the term equity7 has been elaborated
why they are even more serious and difficult to redress. on and gradually expanded to cover new perspectives and di-
Social capital is defined usually as a complex of shared norms mensions. Apart from equity in the sense of access it was at
or values that promote social cooperation and generate trust first equity in terms of outcomes—i.e. successful completion of
(Fukuyama 1999). At individual and family micro-level, it is char- studies—that was considered. Other dimensions relate not only
acterized by a network of contacts and acquaintances that may to learning outcomes, but also to the effects of education that,
be utilized to acquire a higher status, and also by the importance in an ideal situation, should lead to a full use of the potential and
of these networks (i.e. the size of the capital of those who form capacities of each individual. The selected definitions presented
them). A high level of social capital may therefore contribute to below show that the term is still open to new interpretations
acquisition of prestigious education and, later on, to a successful and that varying levels of importance are attributed to its vari-
professional career and a high social status.5 ous aspects.
Cultural capital involves the knowledge, skills, attitudes and The OECD thematic review of tertiary education (OECD
values that allow an individual to succeed in society. It corre- 2008b, p.14) defines, for example, equitable tertiary systems as
sponds to the level of involvement in the dominant status culture those that “ensure that access to, participation in and outcomes
from which the language and other symbolic codes (Bernstein of tertiary education are based only on individuals’ innate ability
1975) are derived and on which the existing education system and study effort. They ensure that educational potential at terti-
is based. Sufficient cultural capital is therefore a prerequisite for ary level is not the result of personal and social circumstances,
a successful passage through education. Families that share the including of factors such as socio-economic status, gender, eth-
dominant status culture and have acquired the relevant lifestyle, nic origin, immigrant status, place of residence, age, or disabil-
manners and modes of communication (according to Bernstein, ity”. The review distinguishes equity of access which “relates to
a developed language code as distinct from a limited code typical equality of opportunities to enter tertiary education and access
of lower social classes), have, on the whole, a positive attitude to programmes at different levels and with distinct qualities, and eq-
education, and their children have strong motivation and high ed- uity of outcomes which relates to opportunities to progress and
ucational aspirations. The situation is entirely different in families complete tertiary studies and also to achieve particular returns
where the environment does not provide appropriate stimuli for to tertiary education”.
the development of children and fails to prepare them for work On the other hand, a recent communication of the European
at school. This results in both a low level of their aspirations and Commission8 focuses on overall socio-economic disadvantage,
motivation and poorer school performance. other inequalities—of gender, ethnic origin, disability or regional
All three forms of inequality—resulting from the different disparities—are relevant only as far as they contribute to it. It
wealth and financial situation, cultural standards and social con- defines equitable systems as those that ensure that the outcomes
tacts of a family—are strongly reflected in the differences in the of education and training are independent of socio-economic
educational paths of the children, and they are constantly trans- background and other factors that may lead to educational dis-
mitted. Equity in access to tertiary education is therefore influ- advantage, and stresses that treatment should be differentiated
enced to a degree by the ways in which inequality was manifested according to individuals’ specific learning needs. It finds it useful
at previous levels of education, for example when the choice of to distinguish between equity in access (the same opportunities
secondary school is made, however most importantly, it is influ- for all to access to quality education), in treatment (quality educa-
enced by the overall attitude to education. tional provision suited to individuals’ needs) and in outcomes (the
If the level of inequality is high, there is a large degree of knowledge, competences, skills learnt and qualifications achieved
transmission of tertiary education between parents and children within an educational system).
and social mobility6 is limited.This is dangerous both in social and Moreover, a recent definition (OECD 2007) distinguishes
economic terms. The higher education system becomes increas- two entirely different dimension of equity. These are fairness and
ingly closed (only a limited part of society has access to it) and inclusion. While the former relates to the principal meaning of
ceases to respond to the needs of the entire country.The society the term and means that the personal and social situation of an
faces the risk that various social groups and strata become en- individual should not pose an obstacle to a full use of their edu-
closed and it is not able to develop and make use of the capaci- cational potential, the latter is considered to be more relevant at
ties of young people with various talents across the entire social lower levels of education (it implies the basic standard of educa-
spectrum. As a result, the potential of new generations is insuf- tion for all). However, it may be helpful for interpretation of the
ficiently developed and used. To avoid such development and loss relationship between expansion and equity in tertiary education,
of human talent and capital it is necessary to create opportunities since it pays attention to the main positive effect of expansion—
accessible for all and corresponding to their interests and aspira- i.e. an increased level of inclusion (see 1.4) that is manifested by
tions (Brennan and Naidoo 2007). Therefore, not only expansion a higher level of educational attainment and qualifications of the
but also diversification of tertiary education is required. entire population.
5)
At macro-level it is used for expressing the relationship of trust and cooperation in society (Putnam 2000), be it within one social group (bonding social capital) or between them
(bridging social capital).
6)
Social mobility depends upon the degree, to which an individual can change his/her social status during his/her lifetime (intra-generation mobility) or against the status of the
family he/she was born in (inter-generation mobility).
7)
It is important to distinguish between equality and equity. While equality is ideologically loaded and implies a tendency towards sameness (or even uniformity), basic meaning of
equity is “moral justice of which laws are an imperfect expression, the spirit of justice to guide practical action and interpretation, fairness” (OECD 1997, p. 127), even “principles
of justice used to correct laws when these would seem unfair in special circumstances” (Oxford Advanced Learner’s Dictionary 1990). Equity is always related to an individual
situation.
8)
Efficiency and equity in European education and training systems (2006).
Who is more equal? 9Theoretical background
1.3 Expansion and diversification of ing to the position and prestige of the institution, and horizontal
according to the focus and specialisation of the study programmes
tertiary education (Brennan and Naidoo 2007).
The increased intake has naturally meant a gradual increase
The development of tertiary education during the last fifty in the number of graduates a few years later that is analysed in
years shows that its expansion is inevitably interlinked with its the following chapters of this study. However, the relationship be-
diversification, both processes are interdependent, caused by the tween these two indicators is not a clear-cut and straightforward
same reasons. The economic reasons and the demand on the la- one, as it is influenced by a number of factors. These include the
bour market—when the graduation rate is growing—require nature of transition between various sectors or institutions of
more types and levels of education and training, including short and tertiary education, the completion rate (it ranges between 60–
largely professionally and practically oriented programmes. Social 90 % in European countries), accumulation of degree-level diplomas,
reasons and widening of access result in a far higher heterogene- interruption and resumption of studies, etc.10 The European Social
ity of students and thus in a greater diversity of their aptitudes, Survey data and subsequent analyses make possible to reconstruct a
interests, motivations and goals. Hence quantitative expansion is probable development of the graduation rate in European countries
accompanied with structural transformation, and as new types of during the last fifty years (see the box Reconstruction of the gradu-
institutions and study programmes impact on other characteristics ation rate in Europe 1950–2007). This approach requires, however,
of tertiary education, also qualitative transformation is under way. that quantitative limits of the three phases of tertiary education are
This fundamental threefold transformation proceeds in more redefined in terms of the graduate rate, instead of the entry rate. If
stages than one. It was as early as the 1970s that American so- the completion rate is about 80 %, transition from the elite to the
ciologist Trow—making use of the experience of US higher edu- mass phase can be characterised by a 20 % proportion of graduates,
cation institutions that were ahead of European development— and the proportion of 40 % of graduates in the relevant age group
defined together with the OECD9 three basic phases of tertiary can be assigned to transition from the mass to the universal phase.
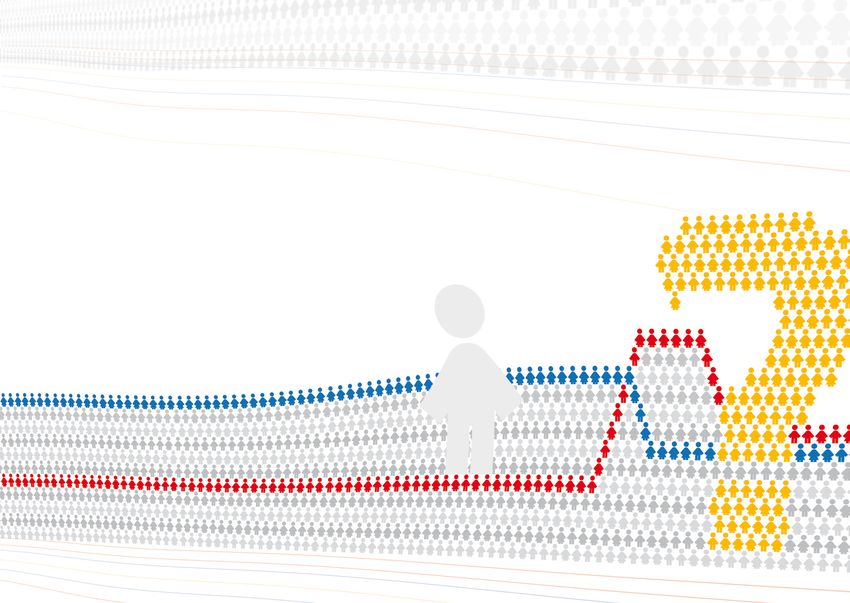
education (and thus three types of tertiary education systems) as An analysis of the proportion of tertiary education gradu-
elite, mass and universal. Trow characterised and explained them ates in the relevant age cohort in European countries over the
not only in terms of their function, goals, structure and further past period of more than fifty years points to marked differences
qualitative characteristics (e.g. governance, quality standards, ac- between the countries. At the same time it documents a dynamic
cess and selection, curriculum) but also quantitatively, according increase in the graduation rate and the transition process be-
to the proportion of the relevant age group admitted to studies tween the three phases. In Europe transition from the elite to the
(that is to the entry rate). He established a 15 % limit for transi- mass phase occurred mostly in the early 1970s (slightly earlier in
tion from the elite to the mass phase, and 50 % for transition Norway, Denmark, the Netherlands and Belgium, slightly later in
from the mass to the universal phase (Trow 1974). Poland, Portugal, the Czech Republic and Hungary). However, in
In Europe, the transition from the elite to the mass phase terms of the proportion of graduates in the relevant age cohort
has been in progress since the second half of the 1960s. New European countries are, at present, gradually moving from the
short and mostly vocationally oriented programmes have been mass to the universal phase of tertiary education (the first ones
introduced, offered in new types of institutions that were often are Ireland, Denmark, Spain and Norway); even the countries hav-
transformed from best upper secondary technical schools. A ing a low graduation rate, as the Czech Republic or Germany,
whole range included, for instance, Polytechnics in England and Fin- have already passed beyond the elite phase.
land, Fachhochschulen in Germany and Austria,
Institutes Universitaires de Technologie and Sections Proportion of tertiary education graduates in population
des Techniciens Supériers (STS) in France, Higher European countries 1950–2007
Vocational Schools (HBO) in the Netherlands,
Flemmish Hogescholen and Wallonian Hautes KEY
Écoles in Belgium, Regional Colleges in Ireland or 60 % AT CZ
Graduation rate
Norway, or Higher Professional Schools (VOŠ) DE DK
ES FI
in the Czech Republic. Although they usually GB GR
50 %
had a lower status as HE non-university institu- HU CH
IE NL
tions or as tertiary non-HE institutions, their NO PL
graduates often found a good position on a 40 % PT SE
SI SK
growing labour market. Europe FR
Some countries defined their tertiary edu- 30 %
cation systems explicitly as binary with a clear
distinction made between universities and other
20 %
types of institution (today f.i. in Belgium, Finland
or France). However, even in cases where these
systems formally remained—or again became 10 %
—unitary (f.i. in the Netherlands or the United
Kingdom), they still underwent internal structur- 0%
al and qualitative differentiation: vertical accord- 1950–1960 1960–1970 1970–1980 1980–1990 1990–2000 2000–2007 (revised)
10)
When calculating the graduation rate, in order to prevent graduates to be counted more than once only the first tertiary education certificate of each graduate can be taken
into account.
10 Who is more equal?Theoretical background
Reconstruction of graduation rate in Europe in 1950–2007 1.4 Expansion and inequalities
Attempts to reconstruct the fifty years of development of the num-
bers of admitted students and graduates and their proportions in the Since the 1990s research into inequalities in access to tertiary
relevant age cohorts in a relatively large number of European coun- education has been focusing on three key questions that emerge
tries are problematic, no matter what approaches and data are used. in the process of studying the issue of expansion of tertiary edu-
It is difficult to procure historical time series related to the develop- cation on the one hand and the issue of inequality in access to
ment of tertiary education over such a long period, not to mention this education on the other hand. Does quantitative growth (i.e.
their mutual comparability. The reason is that they may not be avail- a robust expansion of opportunities of studying at tertiary level)
able at all, and another reason may be that the definitions of various also lead to a more equal and fairer access to this education
indicators often change and they are difficult to compare, lack con- regardless of various advantages or disadvantages on the part of
sistency, etc. the applicant? Does it result in a genuine decrease in inequality?
The data obtained via analysing various age cohorts as part of ex- Moreover, the fact that expansion of tertiary education goes hand
tensive international surveys, which are transformed into indicators in hand with its diversification raises another question: What is
for various historical periods, have the advantage that they are more the impact of internal diversification of the system on the devel-
consistent and therefore more easily comparable in time and between opment of inequalities—irrespective of whether the diversifica-
countries. However, there are also various disadvantages. What is tion consists in differences between various sectors of tertiary
particularly complicated is the assigning of age cohorts to historical education, individual schools/institutions of tertiary education,
periods. There is always a certain distortion. For example, graduates levels (bachelor’s, master’s, PhD), or fields of studies, with differ-
in the 1950s may include those who acquired tertiary education at a ent prestige and standards and, consequently, with a varying level
higher age, for example during the 1960s. Another problem is that old- of selectivity?
er people tend to overstate their education – i.e. describe it in present According to the theory of Maximally Maintained Inequality
terms, although they studied several decades ago. For example, grad- (Raftery and Hout 1993, Raftery 2007) the influence of family
uates of upper secondary or postsecondary institutions that, in the background does not decrease until the educational needs of
meantime, have been upgraded to tertiary level sometimes state that the most favoured social groups are satisfied—i.e. until nearly
they acquired tertiary education. On the other hand, members of the all individuals within these groups achieve the relevant level of
youngest age cohort are often still studying or they may resume stud- education (the term saturation point is used in this context). At
ies after some time, and this means that their formal education is not this point inequalities began to decrease at the given level of edu-
completed. However, in questionnaires they state the highest level of cation, but they increase at the next more advanced level, as the
education they have achieved so far. population applying for these studies becomes more heterogene-
A thorough analysis of the two main approaches has revealed that ous. The MMI theory is consistent with some other conclusions
for the purpose of comparing the development of entry rate and gradu- and it is therefore often used as a working hypothesis in research
ation rate in tertiary education in various European countries over the into expansion and stratification of education. For example, the
last fifty years it is far more appropriate and also feasible to use the authors of an extensive comparative study of inequalities in ac-
data derived from the analysis of various age cohorts as part of the Eu- cess to education in twelve countries characterised this situation
ropean Social Survey (ESS). However, the difficulties mentioned above as persistent inequality (Shavit a Blossfeld 1993).
and some other problems result in a somewhat overrated level of ed- Expansion of tertiary education necessarily affects the func-
ucational attainment particularly in the earlier historical periods. Even tions and roles of this education in society. The reason is that,
so, the use of the cohort analysis could be confronted, in around half at individual level, instead of serving as a lift to prestigious jobs
of the countries, with time series and, in this way, the size of the vari- and careers tertiary education becomes a necessary but far from
ation could be established. In doing so it has been confirmed that the sufficient precondition for reaching up to these jobs and careers.
difference between the results of the cohort analysis and the historical Expansion of tertiary education is accompanied by its inner di-
time series for younger age cohorts is gradually diminishing. Converse- versification. New study opportunities emerge predominantly at
ly, the level of educational attainment in the youngest age group is se- the lower, less selective level that has been added to complement
verely underrated and requires further revision. the higher level of traditional universities. Individual strategies
All this must be taken into account when comparing the thresholds for therefore cannot aim at a mere acquisition of tertiary education,
transition between various stages of the development of systems of ter- but rather at completion of elite and prestigious institutions, at
tiary education according to Trow’s typology on the one hand, and the acquisition of higher degrees, studies of preferred programmes
data on the proportion of graduates in the given age cohort (graduation etc. However, access to these continues to be limited. This means
rate) according to ESS data on the other hand. The comparison of time that inequalities in access have not been eliminated, but they have
series for some European countries and the corresponding data from been merely shifted within diversified systems and have taken
the cohort analysis of the ESS database has revealed that, in view of the new forms—qualitative and structural instead of quantitative.The
aforementioned reasons behind the overrated data from the cohort anal- Effectively Maintained Inequality theory, for example, offers simi-
ysis, it is a 20 % proportion of graduates in the corresponding age cohort lar conclusions (Lucas 2001).
in the ESS database that must be considered as the threshold for transi- The new situation continues to be non-transparent and, what
tion from the elite to the mass stage of the development of tertiary edu- is more, it varies significantly from country to country. First of all,
cation. Moreover, 40 % of graduates in the given age cohort can be seen it is not clear what the roles of quantitative, qualitative and struc-
as the threshold for transition from the mass to the universal stage. The tural factors are in various countries. Answering this question
data must be subject to a major revision for the youngest age cohort – would require extensive comparative analyses of the various fac-
for this purpose additional information must be obtained (a more detailed tors and dimensions involved. However, comparative analyses are
explanation of the revision is state in Chapter 2.3). limited by a lack of relevant and up-to-date information (Clancy
a Goastellec 2007). This is why some of the most recent com-
Who is more equal? 11Theoretical background
parative projects are designed as profound sociological qualitative candidates from elite institutions by offering them second-rate
studies that do compare a number of countries, but also focus institutions. For others expansion means a clear benefit, because
on their overall situation and broader context, interpret their even lower-level tertiary institutions enhance the chances of
specific development and analyse national data sources without acquiring more advanced education and the overall result is in-
claiming rigorous comparability and relevance. creased inclusion (in OECD 2007 interpretation explained earli-
One of the most recent extensive comparative studies (Shavit, er).The outcomes of the study confirm that inclusion does occur.
Arum a Gamoran 2007) that concerns inequalities in access to Although social selection remains the same (until the saturation
tertiary education in 15 countries has expanded on the existing point is achieved), there are more students of all classes (includ-
knowledge of the effects of diversification and provided a new ing those with disadvantages) continuing their education, and in-
assessment of the whole process (particularly see Arum, R., A. equalities therefore decrease within the age cohort as a whole.
Gamoran and Y. Shavit, 2007). Thirdly, the study stresses that the above conclusions—i.e.
Firstly, the study focuses on the relationship between expan- that expansion supports inclusion although inequalities do not
sion, differentiation and market structure of tertiary education decrease—lead to a new interpretation of earlier research
and their impact on inequalities. Expansion is taking place in all (Shavit a Blossfeld 1993). It was this research that produced the
countries and, under certain conditions, can lead to a decrease term persistent inequality, but failed to get to the very essence of
in inequality. At the same time, expansion is closely linked to dif- the problem. Expansion at a certain level of education increases
ferentiation, as diversified tertiary education systems increase the level of heterogeneity of those who then move on to study
the overall participation rate. For instance, systems with a larger at a higher level. This means, at the same time, that expansion
involvement of the private sector expand more rapidly and they facilitates access for a larger proportion of young people from all
are more diversified. There are two contradicting trends within social strata, and the system should therefore be considered as
private institutions that have mutually restricting effects in terms more inclusive (see also Chapter 1.2). Although relative inequalities
of inequalities. They seek to attract prospective students and, at remain unchanged, inclusion leads to an absolute enlargement of
the same time, seek to achieve prestige. access for a wide range of the population. And even though it is
Secondly, the study interprets the research results from two possible to see education predominantly as a position good, yet
perspectives—diversion and inclusion. Some experts believe that its expansion represents a benefit because it increases the human
expansion of tertiary education is only a way of diverting new capital of individuals and of the entire society.
12 Who is more equal?Analytical process
2 Analytical process
The analysis of the development of inequalities in access to tries and a correct setting of the original variables in the ESS data
tertiary education is based on the data of first three rounds of sets. Despite several limitations and problems described below
the European Social Survey (ESS). ESS is a research programme it is apparent that a database established by means of combining
of the European Science Foundation focused on monitoring val- data from three initial rounds of the ESS survey is remarkably
ues, attitudes, beliefs and behaviour patterns in current European suitable for the purposes stated above not only in terms of its
societies. It focuses particularly on value orientation, cultural and factual focus and the characteristics of the variables, but also in
national values and the social structure of society. terms of its unique scope.
Although the ESS is not primarily focused on education and The first part of the chapter deals with data and variables
educational inequalities, yet it contains questions which can be analysed. It describes the overall ESS data set and explains how
well utilised for analysing inequalities in approach to tertiary edu- age cohorts representing historical periods examined have been
cation and their social conditioning (important is the retrospec- defined. Further it focuses on ESS variables and their (re)cod-
tive way of examining family background of the respondent at ing necessary for subsequent analyses, explaining why so-called
the age of fourteen years). However, the use of the ESS database quartile groups were used instead of their original values. The
limits the scope of the research only to those characteristics and second part of the chapter describes the model developed for
variables already contained in it (i.e. the father’s and mother’s analysing inequities in access to tertiary education, and defines
occupation or the highest education level attained by the father the outcome—the Inequality index. The final part analyses values
and the mother).This is why the ESS database is very apt for com- of Inequality index and their revision concerning the youngest
parative analysis, however for deeper and more detailed studies age cohort post the year 2000. All data and methodological prob-
focused on individual countries it does not suffice and has to be lems are explained by specific examples comparing always two of
supplemented with other sources of information. countries examined.
An analysis of the scope of inequalities in access to tertiary
education and its development in various countries, an analysis of
the effects of expansion of tertiary education on inequalities and
further analyses and interpretations must be preceded by the de- 2.1 Data and variables
velopment of a high quality analytical (data) and methodological
basis. This consists, above all, in the development of appropriate Establishing an overall data set. At present1 data from the
indicators and a justified model of inter-generational transfer of first three rounds of ESS are available. The ESS-1 was conducted
inequalities. Moreover, this concerns, for example, an analysis of in 2002/2003 with 22 participating countries: Austria, Belgium,
Tab
the age structure of tertiary education graduates in various coun- the Czech Republic, Denmark, Finland, France, Germany, Greece,
Hungary, Ireland, Israel, Italy, Luxembourg, the Netherlands, Nor-
Number of respondents analysed
way, Poland, Portugal, Slovenia, Spain, Sweden, Switzerland and the
in European Social Survey United Kingdom. The ESS-2 was conducted in 2004/2005 with
Country Code ESS-1 ESS-2 ESS-3 ESS 1–3 26 countries participating in it: without Israel, but Estonia, Ice-
Austria AT 2 123 1 915 2 181 6 219 land, Slovakia, Turkey and Ukraine joined the survey. Compared
Belgium BE 1 730 1 644 1 630 5 004 to the ESS-2, Iceland, Italy, Luxembourg, Greece, Turkey and also
Czech Republic CZ 1 289 2 781 5 279 * 9 349 the Czech Republic did not participate in the ESS-3; on the other
Germany DE 2 648 2 568 2 622 7 838 hand, Bulgaria, Cyprus, Latvia, Romania and Russia joined it.
Denmark DK 1 359 1 317 1 353 4 029
Since the Czech Republic did not participate in the most re-
Estonia EE • 1 769 1 356 3 125
cent round of ESS, the data necessary for continuation of the
Spain ES 1 606 1 481 1 720 4 807
Finland FI 1 720 1 782 1 693 5 195
analysis of inequalities in access to tertiary education in the Czech
France FR 1 385 1 689 1 867 4 941 Republic were collected as part of a special national survey. This
United Kingdom GB 1 951 1 662 2 262 5 875 survey was carried out at the turn of 2007/2008 by the Education
Greece GR 2 375 2 251 • 4 626 Policy Centre at the Faculty of Education of Charles University in
Hungary HU 1 484 1 352 1 436 4 272 co-operation with the MEDIAN agency. One of many objectives
Switzerland CH 1 888 2 015 1 714 5 617 of the survey was to obtain in the Czech Republic data which
Ireland IE 1 890 2 104 1 669 5 663 would be fully comparable with those of the third ESS-3 round.
Luxembourg LU 1 333 1 407 • 2 740 The entire set of questions was therefore taken over from the
Netherlands NL 2 238 1 778 1 792 5 808
ESS questionnaire, and the Czech sample of 5 279 respondents
Norway NO 1 851 1 591 1 550 4 992
became a fully-fledged part of the analyses carried out. Apart
Poland PL 1 750 1 471 1 488 4 709
Portugal PT 1 387 1 880 2 075 5 342
from this, additional substantial data were obtained during the
Sweden SE 1 742 1 705 1 705 5 152 survey that are to be used in the following stages of project im-
Slovenia SI 1 311 1 220 1 273 3 804 plementation.
Slovakia SK • 1 291 1 545 2 836 Iceland, Israel, Italy and Turkey were excluded from the com-
Ukraine UA • 1 884 1 868 3 752 parative analyses due to an overly small sample. For the same
Europe 35 060 40 557 40 078 115 695 reason all countries participating only in ESS-3 were excluded as
*) The ESS-3 round in the Czech Republic was substituted with data from the special national survey. well. Finally, also respondents which have not terminated their
I)
The Czech text of this publication was completed at the end of 2008.
Who is more equal? 13Analytical process
studies (i.e. still studying) and those with missing data on their tertiary studies and the middle value of this interval. This means
family background or education attained were excluded. After that in countries where students complete tertiary education at
excluding the countries and respondents mentioned above, the a higher age and, moreover, their age span is larger (particularly all
ESS data sets have the following size: the ESS-1 data set covers Scandinavian countries), the age cohorts representing the same
35 060 respondents in 20 countries, the ESS-2 data set 40 557 historical period are defined by respondents born earlier. They
respondents in 23 countries, and ESS-3 data set covers 34 799 are also broader and therefore overlap to a larger degree (i.e.
respondents in 20 countries. However, it is necessary to add to one respondent is more likely to be placed in two age cohorts
these figures another body of more than 5 thousand respondents at the same time). On the contrary, in countries such as Belgium,
who participated in the complementary survey carried out in the France or the United Kingdom the age cohorts are narrower and
Czech Republic. In view of the ensuing analyses of several age overlap to a lesser degree. The table shows the quartile span of
cohorts in each country the data obtained in all three ESS rounds the age cohort, which means that half of the graduates are aged
and in the complementary survey for the Czech Republic was as indicated.
brought together. This means that the overall data set covers al- If the definition of age cohorts clearly differs from country
together as many as 115 695 respondents in 23 countries. Each of to country, the age distribution of graduates in individual coun-
the countries included participated in at least two ESS rounds. tries does not change too much over time (but for some excep-
Transposing age cohorts into historical periods. In tions). This is why it has been possible to simplify the process and
view of the size of the overall data set (ESS 1–3), and the age consider the definition of cohorts as stable for all six periods in
span of the respondents, it was possible to form six age cohorts each country. However, it must be noted that comparable data
covering, approximately, people who finished tertiary education about the age distribution of higher education graduates in vari-
in a particular historical period, specifically in the course of one ous countries are only available from the early 1990s—i.e. for ap-
of the following six periods: 1950–1960, 1960–1970, 1970–1980, proximately 15 years. Too little is known about possible changes
1980–1990, 1990–2000 a 2000–2007. The approach employed by in the age distribution of tertiary education graduates prior to
the Education Policy Centre is analogical to that one of other 1990, so that they cannot be dealt with as part of the methodo-
authors2, however with some substantial methodological innova- logical process. Since the data relate to the cohorts (they are not
tions. historical), there may be a certain overlap of historical periods
This required an analysis of the age distribution of tertiary due to a shift in the age cohorts of graduates.
education graduates in individual countries and its development Seen from this angle, particularly the reconstruction of the
over recent decades. In international terms it was possible to first decades that followed the WWII can be considered as slight-
use data about graduates’ age from the OECD database until ly inaccurate. The war itself caused a certain shift of age cohorts
2006, and data from two international surveys concerned with of graduates, however not much is known about its total impact
higher education graduates: CHEERS of 1998/1999 (graduates in in 23 European countries.Two other deformations can be consid-
1993–1994) and REFLEX of 2005/2006 (graduates
Tab 1 in 2000–2002). ered as more significant. It is, first, the overlapping of cohorts as
When the available data from these sources were analysed, two defined which even thus cannot cover all age groups of graduates
major conclusions could be drawn: firstly, the age distribution of in a given period (e.g. graduates of the 1950s include also some
graduates in various countries graduates of the 1960s, the latter again those of the 1970s etc.).
varies to a large degree (dif- Typical age Second, the very definition of the education level attained has
ferences in the average age of Country of graduation * changed frequently. For example, in some countries certain types
graduates may be 5–7 years); Austria 25–29 of secondary or postsecondary vocational education have been
secondly, changes in the aver- Belgium 22–24 transformed into tertiary education. Today, their graduates quite
age age in various countries Czech Republic 23–26 understandably report that they have attained tertiary education,
Germany 25–29
over time are distinctly smaller although it was classified at a lower, i.e. secondary, level at the
Denmark 24–30
(a maximum of 1–2 years). It is time of their studies.The approach can result in overvaluing num-
Estonia 23–27
therefore impossible to apply Spain 23–26
bers of graduates indicated particularly within historically oldest
the same definition of age co- Finland 25–32 periods. It is possible, however, neither to reduce them on the
horts (and historical periods) France 22–24 basis of ESS data, nor to reconstruct them historically with suf-
to all countries—it is necessary United Kingdom 20–23 ficient plausibility due to lack of background material available in
to take account of the specific Greece 23–26 individual countries.
demographic characteristics Hungary 23–29 Inaccuracies could also occur in the last period under re-
of graduates in each individual Switzerland 25–29 view (2000–2007), where a not negligible portion of the rel-
Ireland 21–24
country. evant age cohort consists of individuals who are still studying at
Luxembourg 22–26
The process of assigning age higher education institutions—mainly students of longer study
Netherlands 22–26
cohorts to individual historical programmes. However, they are not considered as subject of
Norway 23–30
periods was carried out so that Poland 24–27
the analysis although they will acquire tertiary education short-
the decisive factors for defining Portugal 23–29 ly. As the data for the last period could be partly affected by his,
the given cohort and its span Sweden 25–32 a correction was carried out that is described in more detail
were the interval between the Slovenia 25–29 in Chapter 2.3. The outcome of this procedure and the defini-
value of the upper and lower Slovakia 23–27 tion of individual age cohorts can be found in the table below
quartiles of the graduate’s age Ukraine 23–27 presenting sets of respondents who represent the relevant his-
* (lower quartile – upper quartile)
at the time of completion of torical periods.
2)
The same approach has been followed many other authors, f.i. by Breen, Luijkx, Müller and Pollak (2005), Chevalier, Denny and McMahon (2009) or Underwood and de Broucker (1998).
14 Who is more equal?You can also read