The state of funding in education, teachers' working conditions, social dialogue and trade union rights in Western European countries 03/2016
←
→
Page content transcription
If your browser does not render page correctly, please read the page content below
03/2016

       ETUCE report on

   The state of funding in
    education, teachers’
working conditions, social
 dialogue and trade union
rights in Western European
          countries

        February 2016

                               1
Reproduction of all or part of this publication is permitted without authorisation. However,
accreditation to ETUCE must be made and copies must be sent to the ETUCE secretariat.

                Published by the European Trade Union Committee for Education - Brussels 2016

                                                                                                2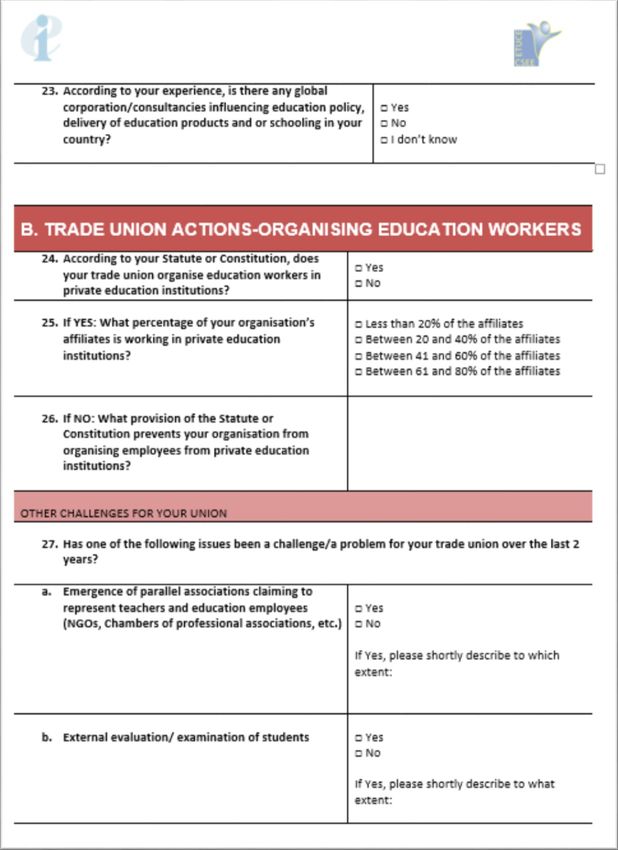
Contents
Foreword............................................................................................................................................... 5
Introduction .......................................................................................................................................... 8
   Background ....................................................................................................................................... 8
   Methodology..................................................................................................................................... 8
Executive summary ............................................................................................................................. 11
1. Funding education .......................................................................................................................... 14
   1.1 Introduction .............................................................................................................................. 14
   1.2 Defining the terms .................................................................................................................... 15
   1.3 Aim and scope ........................................................................................................................... 15
   1.4 Public investment in education: main trends 2009-2013 ......................................................... 16
   1.4 National education system reforms.......................................................................................... 19
   1.5. Major trends in privatisation ................................................................................................... 21
2. Teachers’ working conditions and trade union action ................................................................... 32
   2.1 Organising education workers .................................................................................................. 32
   2.2 Teachers’ representations: A state of play ............................................................................... 33
       Main challenges in the representation of the teaching profession ............................................ 33
       Teachers’ salaries and working conditions ................................................................................. 40
       Teachers’ tasks and distribution of working time ....................................................................... 43
       Employment contracts of teachers ............................................................................................. 45
       Social protection benefits ........................................................................................................... 47
3. Social dialogue and collective bargaining ....................................................................................... 49
   3.1 Social dialogue: main challenges .............................................................................................. 49
   3.2 Collective bargaining ................................................................................................................. 51
   3.3 Further challenges and priorities .............................................................................................. 52
Annex I: List of Charts ......................................................................................................................... 55
Annex II: List of Tables ........................................................................................................................ 58
Annex III: List of Figures ...................................................................................................................... 59
Annex IV: List of respondent ETUCE member organisations .............................................................. 60
Annex V: Survey questions.................................................................................................................. 63

                                                                                                                                                       3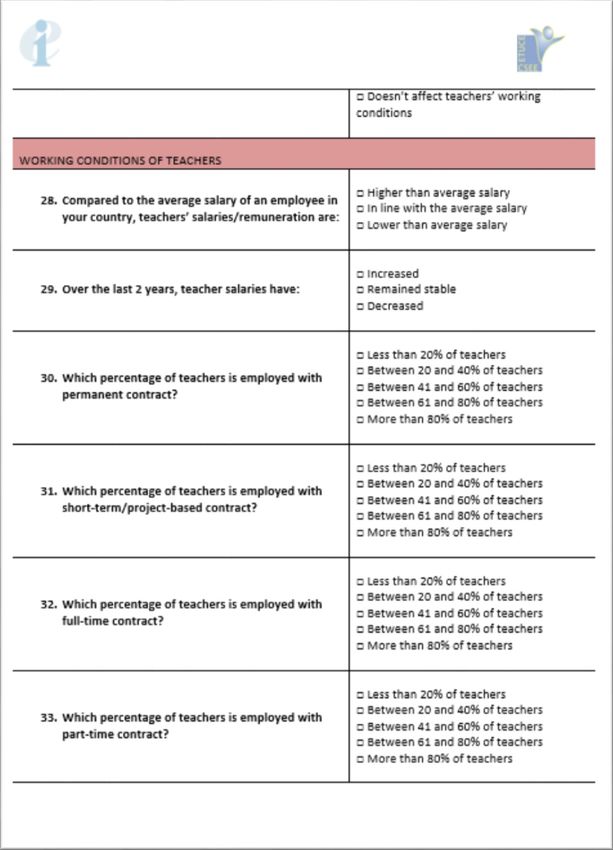
4
Foreword
This ETUCE report is based on a survey of our member organisations in Western Europe. We
conducted another, similar survey covering our member organisations in Central and Eastern Europe.

Based on both surveys, other studies, discussions in our constitutional bodies and conversations with
colleagues, is interesting to compare what we have learned in the areas of education funding,
challenges for teacher trade unions and the state of social dialogue and collective bargaining.

The major differences between the regions may not be surprising. In general, the financial situation
of education systems in the Eastern part of our continent is much more serious, recruitment and
retention of new teachers in the profession, organising and other challenges are overwhelming,
working conditions and social protection are poorer, and social dialogue and collective bargaining
where they exist, are, in general, much less developed than in the West.

But it is the similarities between the two parts of Europe rather than the differences that are striking.
Having said that, those countries that received “special treatment” from EU institutions and the
International Monetary Fund (IMF), principally Greece, Spain, and Portugal, have, in some ways,
joined their neighbours to the East with nearly all of the same problems and challenges to overcome.
And, more than any other part of Europe, they have paid a heavy price for the financial and economic
crisis.

The impact of austerity programmes imposed in reaction to the financial crisis of 2008 is, for the most
part, not over and education budgets remain under pressure. This affects salaries and benefits of
education workers, their working conditions and the availability and quality of training and
professional development. And, of course, it damages the quality of education. Moreover, tax fraud,
tax avoidance and evasion by multinational companies – a challenge to tackle in both areas of Europe
– are depriving public education from important resources, thus deepening inequalities and
jeopardizing the future of young generations.

Although not on the scale of Central and Eastern Europe, our member organisations in much of
Western Europe are also concerned about the growth of precarious work with short-term and part-
time contracts. This is particularly true in higher education and research.

Many teacher unions in Western Europe are concerned about lack of respect for teachers as human
beings and as professionals. Increasing numbers are exposed to psychosocial risks that can lead to
stress-related illness. Sources of stress include violence and harassment, from inside and outside of
schools. Moreover, a considerable part of their tasks is carried out outside working time.

The report clearly demonstrates that even in the area of social dialogue, which was once thought to
be the basis of Social Europe, there are problems. We are informed that discussions are no longer
consistent with outcomes, or they are underrated, decisions affecting teachers and the school
community are taken outside formal consultations with social partners, in particular when it comes
to education and training system reforms and professional issues. In many countries, the scope of
bargaining has narrowed at the very time that it should be expanding to deal with the many new
challenges to the education community.

Although the survey indicates that there is increasing, but not yet significant privatisation in
education itself as opposed to education services, it rings an alarm bell about the increasing pressure

                                                                                                       5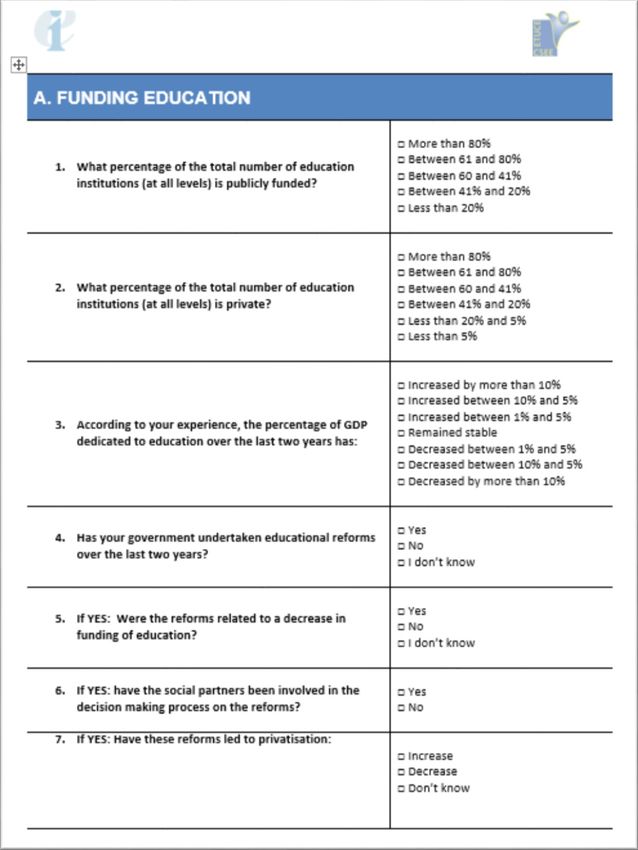
from the inappropriate use of neo-liberal, market and business driven ideology and approaches in
education. This is what one member organisation described as the “commodification of education”.
The attitude and new programmes developed and sustained by the European institutions, such as
the Juncker’s Investment Plan - also targeting education and favouring public-private partnership in
education - confirm the observed trend.

In other words, although the situation is, overall, much more serious in the Eastern than the Western
part of our Continent, there are many dangerous and similar tendencies. What is at stake goes
beyond the rights and working conditions of education workers and the status of teachers. What is
being called into question across Europe is the nature and the mission of education.

In that context, we, the ETUCE, are on the front line to do all that we can to ensure that education is
considered crucial for the future of Europe, that the teaching profession is defended and its status in
society enhanced, as to continue to spark the imagination of children and to reinforce and underpin
social justice and tolerance, build greater respect for human rights and strengthen and deepen a
healthier democracy.

Martin Rømer
ETUCE European Director

                                                                                                     6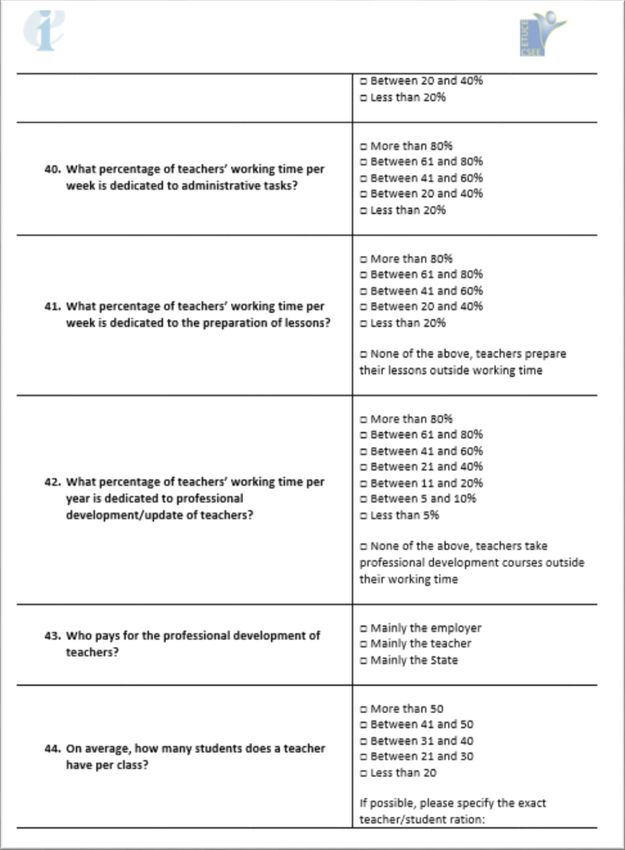
7
Introduction
Background
In 2015, ETUCE adopted its complementary strategy to the EI Global Response to Commercialisation
and Privatisation in and of Education. The EI campaign seeks to demonstrate that commercialisation
and privatisation undermine public education and are detrimental to the interests of society. It is in
this framework that the ETUCE has prepared a comprehensive “state of play” of education funding,
teachers’ working conditions, social dialogue and trade union rights by education sector across
Europe.
For this purpose, the ETUCE conducted a survey of member organisations in Central and Eastern
Europe; mapping public investment in education, privatisation of education systems, teachers’
working conditions, social dialogue and collective bargaining, trade union actions and future
challenges to teacher unions. The survey results were presented at the ETUCE CEE Round table 2015
in Bucharest, Romania.
In parallel, the ETUCE surveyed member organisations in Western Europe on the same topics. The
survey results are presented in this report. The report also follows up on many studies and surveys
carried out during the last eight years on the impact of the economic crisis on European teachers and
education systems.
The ETUCE, with this survey, combines the outcomes of eight years of economic crisis and fiscal
consolidation measures on public finance of education systems, teachers’ working conditions, the
role of trade unions, and the major trends in social dialogue and collective bargaining. The ETUCE
also seeks to call attention to European education-related challenges. Among them, European
countries are confronted with increased privatisation and commercialisation in education related to
the effort to shrink public debt. By sharing information on these crucial issues, the ETUCE seeks to
focus attention on present and future challenges as well as support, with ETUCE member
organisations, policy actions to address them.
Methodology
This report is based on an online survey distributed to 41 teacher unions covering the sectors of early
childhood education, primary school education, lower secondary education, upper secondary
education, vocational education and training and higher education and research in 15 EU countries,
2 EEA countries and Switzerland. The response rate represents a majority of those countries1 and
education sectors addressed. Between June and October of 2015, 29 ETUCE member organisations
from 13 EU countries, 1 EEA country and Switzerland replied to the online survey.
The online survey was composed of 54 questions divided into 3 main chapters:
1. Funding of education (questions 1 to 23)
2. Trade union actions – Organising education workers (questions 24 to 47)
Challenges for teacher trade unions
Working conditions of teachers
3. State of social dialogue and collective bargaining (questions 48 to 54)
1
With the exception of Iceland, Austria and the Netherlands.
8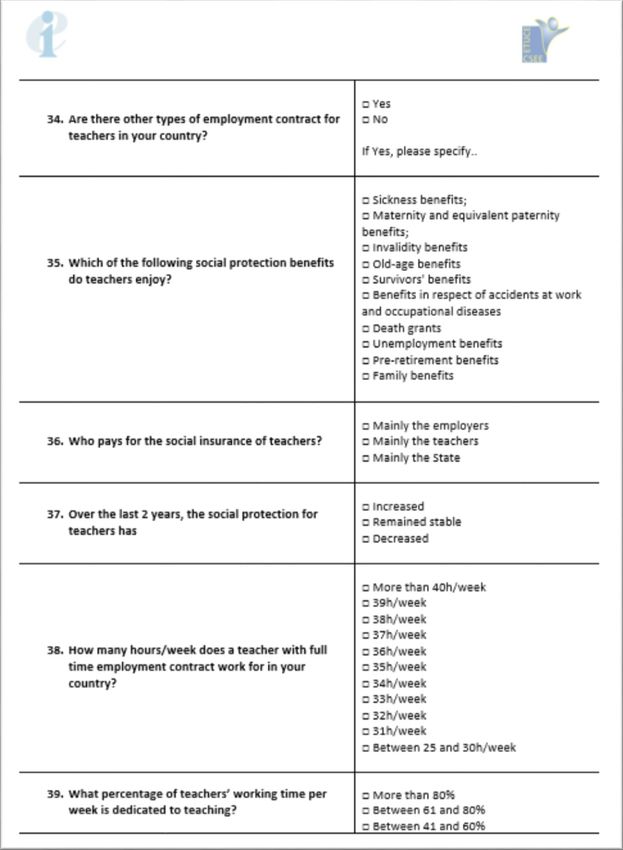
Other challenges related to social dialogue
The survey aims to:
Measure national developments in all sectors of education on these topics;
Provide information for sectoral and regional analyses; and
Raise awareness of teacher unions in Western Europe of educational trends such as
privatisation of education and training institutions and services and the increasing and
related pressure on social dialogue and collective bargaining.
The analysis of the survey was completed with desk research on funding of education. The ETUCE
used data from the Eurostat database for GDP estimations.
The figures and tables included in the report show:
Country analysis when the conditions below were met:
□ The responding teacher union(s) representing teachers in different education
sectors provided the same answers;
□ The responding teacher union(s) representing teachers in different education
sectors provided different answers on quantitative indicators, but it was possible to
determine an average;
□ The responding teacher union represents all education sectors in one country.
Sectoral analysis when the conditions below are met:
□ The responding teacher union(s) representing teachers in different education
sectors provided specific answers for each sector
□ The responding teacher union(s) representing teachers in different education
sectors did not provide sector-specific answers, but it was possible to disaggregate
the answers for comparison based on a sectoral representation
□ The responding union represents one education sector in the country
Regional analysis for Western European countries was based on the aggregation and
elaboration of answers of all responding teacher unions.
The present report is organised into 4 chapters:
The first chapter provides an overview of public investment in education in each country surveyed
in comparison with GDP trends over the last few years. In parallel, this chapter investigates whether
national education reforms were carried out in the different countries and/or whether privatisation
of education institutions and/or services occurred; and in which sector(s) they were most
concentrated.
The second chapter takes a closer look at the activity of teacher unions. The analysis is based on
information from respondent organisations. The chapter ranks the most widespread and emerging
challenges for teacher unions and their activities. This chapter includes reports and analyses of
teacher working conditions.
The third chapter confirms that effective social dialogue and collective bargaining is under severe
pressure and is eroding in Western Europe. This chapter should contribute to a better knowledge of
the state of social dialogue and to understanding topics addressed in each country and education
sector as reported by respondent organisations.
9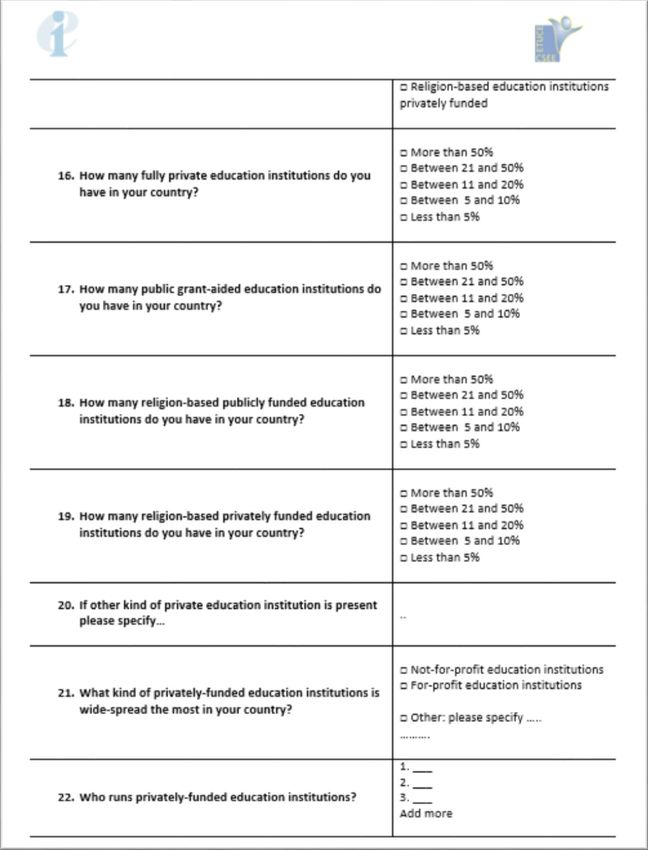
The survey was distributed to and completed by ETUCE member organisations in the following
countries:

Figure 1. Countries represented in the ETUCE Survey

                                                                     According       to     the
          Chart 1. Education sectors represented in the              responses received, the
                           ETUCE Survey                              survey      covers      all
                                                                     education sectors. The
   30
                                                                     education sector most
   25                                                                widely represented in the
   20                                                                survey is the lower
   15                                                                secondary           school
                                                                     education sector (25
   10
                                                                     unions), although there
    5
                                                                     are     no    remarkable
    0                                                                differences with other
           Early   Primary   Lower   Upper Vocational Higher
        childhood school Secondary secondary education education     sectors.         Education
                                                and       and        workers      in      upper
                                              training research
                                                                     secondary education and
                                                                     primary schools are
represented by 23 respondent unions, followed by early childhood and vocational education and
training (22 respondent unions) and higher education (19).

In annex IV, the table lists country abbreviations, respondent ETUCE member organisations and
education sectors represented.

Annex V provides the survey questions sent to teacher unions in Western Europe.

                                                                                              10
Executive summary
The ETUCE Report presented in 2016 is part of the ETUCE complementary strategy to the EI Global
Response to Commercialisation and Privatisation in/of education. The survey was conducted and the
report prepared to gather and assemble information on whether and how the increasing pressure
on public budgets, together with the ideological drive towards privatisation of potentially profitable
education services, are undermining the right to free quality education in Europe, teachers’ working
conditions, labour relations and rights, teachers’ professional status and development.
The Report maps developments over the last 2 years; identifies some common trends and challenges
concerning 1) funding of education and the scope and scale of private sector involvement in the
provision of education services; 2) teachers’ working conditions and trade union actions; and 3) social
dialogue and collective bargaining.
Funding of education
Public investment in education: The economic and financial crisis have had a profound
impact on education. According to data collected, two trends emerged, both of which led to
reduced funding for education. First, the share of Gross Domestic Product (GDP) invested in
education was cut in many countries. Second, after 2008, the GDP declined. As a
consequence, investment in education declined in real terms. The European Semester
mechanism of economic governance coordination and the continuous demand to bring
down public debt have made it difficult for European countries to mobilise the financial
resources for education investment. There has been a persistent negative investment trend
since 2010. This is not due to one-off cuts spread across Europe. Rather, it reflects
subsequent reductions mainly found in the same group of countries (Ireland, Spain, Portugal,
and Italy, UK, Denmark and the Netherlands). Recently, in connection with a – still fragile –
economic recovery, funding of education has slightly increased in several countries (Belgium,
France, Luxemburg, Austria, and Sweden).
Reforms of national education systems: Since the inception of the Europe 2020 strategy and
the reinforcement of the European Semester mechanism to coordinate budgets and reforms
related to Europe 2020 and Education and Training 2020 targets, reforms occurred in almost
all the countries concerned. However, 61% of survey respondents reported a lack of social
partners’ consultation/participation. Reforms were linked with decreases in education
funding and led, according to many survey respondents (40%), to increased privatisation.
Privatisation according to funding models: Public grant aided education institutions are the
most commonly found in the Western European region followed by publicly funded
religious-based education institutions. The majority of private education institutions in the
surveyed countries were not-for-profit. The total number of public education institutions
exceeds private education providers.
Privatisation by education sector: According to respondent unions, privatisation is most
widespread in the secondary school sector, pre-primary and vocational education and
training as a state of play. Trends of increasing privatisation are emerging in the sectors of
primary school, vocational education and training and early childhood education.
11 Privatisation of education services in education institutions: Privatisation of services was
reported by half of respondents. It mainly affected services such as school catering,
transport, security, school stationary and after school-support centres.
Global corporations/consultancies: 62% of responding unions are aware of the presence of
global corporation/consultancies in their countries that are influencing education policy and
the delivery of education products and/or schooling. Where private corporations are not
directly influencing education, they, nevertheless, exert ideological policy influence.
Teachers’ working conditions and trade union action
Representation of education workers in private education institutions: According to union
Statutes or Constitutions, teacher unions have the possibility to organise education workers
in private education institutions in almost all the countries surveyed. In CH, DE, EL, ES, FR,
IE, LUX, some teacher unions have formal limits on recruiting education workers in private
education institutions. The rate of representation of education workers in private education
institutions, however, very low almost everywhere (less than 20% of all union affiliates are
working in private education institutions except in BE – Flanders COV – where those
teachers’ salaries are publicly funded and IE – TUI; where they constitute between 61 and
80% of affiliates).
Teaching profession: Overall, the main challenges of unions to represent the teaching
profession are related to: recruitment and retention of teachers (67% of respondents) and
continuous professional development of teachers and their initial training (59% and 50%
respectively).
Salaries: Over half of the unions indicate that teacher salaries remained stable or have
decreased over the last 2 years in their respective countries. After experiencing years of cuts
and freezes, salaries have not yet begun to increase. In other words, salaries remain blocked
and frozen in spite of the modest economic recovery.
Employment contracts: In all countries surveyed, there are short-term contracts for teachers
although they are in a minority (less than 20%). A large majority of teachers are still
employed with permanent empoyment contracts. On average, between 70 and 90% of
teachers have permanent contracts. The distribution of permanent contracts is, however,
uneven among sectors. In addition, there are a significant number of part-time contracts.
Working time: On average, teachers devote 60% of their working time to teaching; 20% to
the preparation of the lessons, 17% to administrative tasks and only 3% to professional
development. One third of the time to prepare lessons and for professional development is
unpaid and outside of working hours.
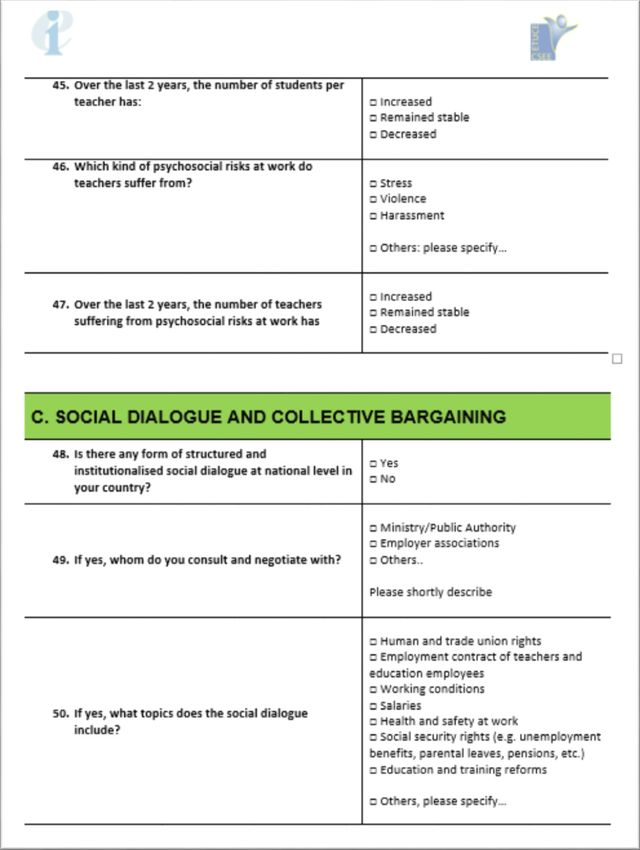
12 Health and Safety: according to 75% of teacher unions, the number of teachers suffering
from psychosocial risks at work increased over the last 2 years. Stress, violence and
harassment are the most common risks.
Social dialogue and collective bargaining
Social dialogue: Western European trade unions report that there are forms of structured
and institutionalised social dialogue in their countries except for Greece – OLME and Spain –
CSI-F. However, great effort is needed to make it more effective and efficient. Social dialogue
has been put under pressure almost everywhere across Europe. Unions observed that when
consulted, governments tend not to seriously consider positions of teacher trade unions.
Collective bargaining: Overall, 90% of respondent unions negotiate collective agreements.
The remaining 10% not negotiating collective agreements are teacher unions in Switzerland,
Greece and Luxemburg. The percentage of education workers covered by collective
agreements is very high across the region, with levels of nearly 100% in the Nordic countries
(Sweden, Norway, Finland and Denmark) and the lowest levels in Greece and Switzerland
(less than 20%).
Further challenges related to social dialogue: in addition to the weakening of social dialogue
in nearly all countries, there are other fundamental challenges. These are primarily the
denial/obstruction of trade union rights, including limits on the scope of bargaining of
teacher unions on rights and working conditions, and professional issues related to
education and training reforms. This is particularly true in in private education institutions
(often religious-based schools).
131. Funding education
1.1 Introduction
It is widely recognised that investment in education is crucial to foster economic growth, to improve
competitiveness as well as social cohesion, to raise citizens’ standards of living and well-being, to
foster redistribution of wealth and to provide citizens with the skills and competences they need for
coping with labour-market transitions and the repercussions of economic crisis.
ETUCE has documented the impact of the economic and financial crisis on education and on
teachers2. Education suffered big cutbacks since the outbreak of the economic crisis. On average,
despite signs of slow recovery and slight increases in education budgets, investment in education has
not come back to pre-crisis levels. Furthermore, on the grounds of budgetary constraints, some
countries have tended to increase their reliance on the private sector, often justifying it on the
assumption that it will bring quality and efficiency gains.
However, EI and ETUCE argue that the role of private providers in financing, delivering and managing
education institutions and/or education services might hamper equity of access and participation in
education, might reduce education to a commodity rather than a public good, and undermine
education as a human right. As a result, the ideological drive towards privatisation and marketisation
of education is resulting in increased discrimination, social fragmentation and widening inequalities,
the most affected being those with fewer resources.3
Especially in those European countries that have been intensively under the pressure of financial
consolidation measures, cuts on education budget are having detrimental effects on the entire
school community. Salaries, working conditions and job security of teachers has been undermined,
thus jeopardizing the attractiveness and the future of the teaching profession. These factors are
crucial determinants for widening the equity gap in access and learning. Subsequently, they have a
far-reaching impact on the quality of education and training. Public investment in the countries
concerned have started to declining in real terms in 2011, with a persistent negative trend due to
consecutive – rather than one-off cuts – reductions ever since. Governments have been encouraged
to look for other ways to finance their education and training systems, for example, by promoting
public-private partnerships.
Funding issues and privatisation of certain education services/institutions are going hand in hand
with education and training system reforms. The European Semester and the country specific
recommendation have become crucial both for budgetary plans and for national reforms in the
education sector. Across Europe, recommendations have been implemented mainly with a view to
enhance the labour market relevance of education on one side, and integrating disadvantaged
students into mainstream education on the other side.
2 For reference, ETUCE Action and Campaign Framework on the Economic Crisis: - ETUCE Member organization
mobilizing for Quality of Education based on 10 Key Messages on ‘What is needed to improve Quality of
Education in Europe?’, 2013-2014 - ETUCE webpage on Crisis in Education, - ETUCE survey - The continued
impact of the crisis on teachers in Europe, 2013 - Analysis of a mini-survey on the impact of the economic crisis
on teacher education in the European Union, 2012 - ETUCE action and campaign framework on the economic
crisis - Analysis of the mini-survey, 2012 - ETUCE film documentary: ‘Exiting the crisis through quality education’,
first screening September 2014
3
ETUCE Resolution on Privatisation and Educational Inequality, 2012
14For all these reasons, this chapter focuses on investment in education, national education system
reforms and the scale of private sector involvement in the delivery of education services.
1.2 Defining the terms
To better understand what is happening, it is important to define what is meant by public and private
education and to define the terms used in this chapter.
There are two recognised definitions of private education.
The first one is provided by UNESCO and it is based on the control and management of the education
institution. According to this definition, all the education institutions that belong or are run by a
private owner (whether for profit or not for profit purposes) are private, as opposed to publicly
managed education institutions.
The second definition is provided by Eurydice, and it is based on the funding origin rather than on
the management. Thus, this definition allows us to define as private all educational institutions
belonging to private owners (individual or collective), as opposed to public agencies (state,
municipality). Eurydice definition makes a distinction based on public versus private funding. By
combining the two definitions, EI recalls that ‘all policies aimed at expanding the private ownership
of education institutions or private funding, at expense of public, can be defined as privatisation.’4
The following categories will be used in the course of the report:
Fully private education institution: schools administered by private boards without support
from public funding.
Public-grant aided education institution: schools administered by private boards with
support from public funding.
Religion-based education institution publicly funded: schools administered by religious
organisations with support from public funding.
Religion-based education institution privately funded: schools administered by religious
organisations without support from public funding.
1.3 Aim and scope
This chapter focuses on public and private funding trends of education institutions and services. It
provides analysis on a national and regional basis and, where appropriate, for each sector of
education.
The chapter addresses four main questions:
How has the public expenditure in education as a percentage of GDP/government
expenditure changed in the last decade?
What are the main features of public versus privately funded education institutions in each
surveyed country?
Have reforms of national education systems occurred?
Has privatisation of education institutions occurred?
4EI European Region, ‘Education and Privatisation in the countries of Central and Eastern Europe’, Central and
Eastern European Round Table, 2006.
151.4 Public investment in education: main trends 2009-2013
Education is widely recognised as the area that has the biggest potential to put Europe on a path
towards sustainable economic growth and social cohesion. Since the inception of the Europe 2020
Strategy, the European institutions have continuously called on Member States to prioritise growth-
enhancing investment in education. However, the economic and financial crisis and the need for
fiscal consolidation have made clear that the necessary investment in education have not been
made, yet, they have been reduced.
Eurostat, the European institute of statistics, released the latest data on education expenditure in
July 2015, with reference to 2013 as the latest available year for data. Data showed that government
expenditure on education in the EU-28 stagnated at 5.0% of the Gross Domestic Product (GDP), after
declining by 0.1 percentage point of GDP in 2012. The distribution is however quite uneven ranging
from the 7.0% of GDP devoted to education in Denmark, followed by Portugal (6.8%) and Sweden
(6.6%) to the 2.8% invested on education by Romania, followed by Bulgaria (3.8%), Spain (4.0%),
Ireland (4.1%) and Italy (4.1%). The table below indicates the main trends in public expenditure on
education as a percentage of GDP for the country surveyed throughout the report.
Table 1: Investment in education trends 2009-2013
Public expenditure on education as a Annual % change at constant price
percentage of GDP
2010 2011 2012 2013 2011 2012 2013
EU 28 5.3 5.1 5.0 5.0 -1.2 -1.5 -0.5
Belgium 6.1 6.3 6.3 6.4 2.5 0.7 1.6
Denmark 7.2 6.9 7.1 7.0 -2.9 2.4 -0.7
Germany 4.4 4.3 4.3 4.3 1.7 -1.4 0.2
Ireland 4.9 4.7 4.4 4.1 -2.8 -6.4 -4.3
Greece 4.0 4.4 4.4 4.5 5.4 -4.3 0.3
Spain 4.5 4.4 4.1 4.0 -2.1 -6.1 -3.8
France 5.6 5.5 5.5 5.5 -0.8 0.6 1.3
Italy 4.4 4.1 4.1 4.1 -4.5 -1.4 -0.4
Luxembourg 5.2 5.1 5.4 5.6 -0.2 6.6 6.8
Netherlands 5.6 5.5 5.5 5.4 -0.7 -3.0 -0.4
Austria 5.1 5.0 5.0 5.0 0.7 -0.6 1.3
Portugal 7.7 7.3 6.5 6.8 -5.9 -6.7 -0.6
Finland 6.6 6.5 6.4 6.5 -0.7 -3.0 -0.8
Sweden 6.5 6.5 6.5 6.6 -0.1 -0.5 0.7
UK 6.6 6.0 5.8 5.5 -4.8 -1.3 -3.0
Iceland 7.6
Norway 5.3 5.0 4.9 4.9
Switzerland 5.9 5.9 6.0 6.0
Source: Eurostat’s general government finance and national accounts statistics. Online data code: gov_10a_exp. EAC
Calculation on annual changes figures, excluding Norway and Switzerland.
When looking at the evolution of the expenditure a persistent negative trend emerges. As the
Education and Training Monitor 2015 of the European Commission confirms, this is not due one-off
cuts across Europe. Rather, it is due to subsequent reductions mainly in the same group of countries.
16Not surprisingly, these countries are those who were the most affected by the economic recession
(Ireland, Spain, Portugal, and Italy), confirming this is an easy target for fiscal consolidation, together
with UK, Denmark and the Netherlands. At the same time, it is important to recall that the
percentages of GDP invested in education reported in the table above refer to the relative share of
the GDP. However, in the last five years, the GDP went down or arrested its growth in many
countries, meaning that expenditure in education went down even more in real terms.
Government expenditure in education can also be broken down by level of education, according to
the international UNESCO ISCED 2011 classification. The charts below (Chart 2 to 4) show that on
average, early childhood and primary education on one side and secondary education on the other
absorb approximately one-third of the total education expenditure each. The distribution, however,
varies a lot across countries for each sector.
The evolution of the expenditure per education sector for the years 2011-2013 shows an uneven
negative trend especially in pre-primary and primary education, where expenditure has slightly
decreased in many of the countries concerned, except Germany, Luxemburg, Sweden and Norway.
Cuts are observed in the Netherlands and Denmark, UK, Greece and Spain (Chart 2). Government
financing of secondary education has remained rather stable across countries, with the exception of
Finland and Greece. This latter is of particular concern, as it devoted relatively little resources to
secondary education (Chart 3).
Investment in tertiary education is below 1% as EU 28 average (Chart 4), with the lowest peaks in
Italy, UK, Luxemburg, Ireland, Spain, France and Austria, which dedicate less than 1% of their GDP to
higher education and research. While the greatest decrease was in Ireland (from 1% of the GDP in
2011 to 0.5% in 2013), the low and further stagnating investment share in higher education in Italy
(0.4% of GDP) is cause for concern.
Chart 2. Government expenditure on pre-primary and primary
education as a % of GDP
4.5 2013
4.0
2011
3.5
2012
3.0
2.5
2.0
1.5
1.0
0.5
0.0
SE DK NO BE PT IE LUX NL EU (28) ES IT UK CH EL FR AT FI DE
17Chart 3. Government expenditure on secondary education as a % of
GDP
3.0
2013
2.5
2012
2.0
2011
1.5
1.0
0.5
0.0
FI BE FR CH AT NL PT UK EU DK IT LUX DE IE ES EL NO SE
(28)
Chart 4. Government expenditure on tertiary education as a % of
GDP
2.5
2013
2011
2.0
2012
1.5
1.0
0.5
0.0
FI CH DK NL BE SE PT DE EL NO EU AT FR ES IE LUX UK IT
(28)
Source: Eurostat’s general government finance and national accounts statistics. Online data code: gov_10a_exp. Own
charts.
Data collected confirm the experience of respondent teacher unions in the countries concerned, as
the Figure 2 below shows.
In England, the National Union of Teacher (NUT) confirmed that education spending as a whole fell
by 5.3% in real terms between 2010-11 and 2014-15. While according to the Belgian teacher union
CSC-E, education expenditure decreased in the Walloon\Brussels region of Belgium, moving from 7%
of the federal GDP in 2010 to 6.7% in 2013.
18Figure 2: According to your experience, the percentage of GDP dedicated to education
over the last two years has:
DECREASED
Germany
Belgium - Wallonia
Ireland
Switzerland
Sweden
Denmark
Greece
Spain INCREASED
Italy
Portugal
UK
Remained stable: Belgium - Flanders, Finland, France, Luxemburg, Norway
1.4 National education system reforms
According to the survey’s respondents, reforms of national education systems occurred in almost all
the countries concerned over the last 2 years. When asked about the social partners’ involvement in
education reforms, only 39% of respondents replied positively5, while the large majority of
respondents6 (61%) denounced the lack of involvement of social partners in the decision making
process on reforms. The Spanish teacher union FE.CC.OO reported that the government refused to
listen to the demands of the social partners.
The graphs below are drawn from the answers of each surveyed teacher union in every sector of
education. Answers might vary, however, according to different sector and within the same country.
5
Belgium - Flanders (COV), Belgium – Wallonia, (CSC-E), Switzerland (LCH), Germany (GEW), Finland (OAJ),
France (SE-Unsa, SNES-FSU), Ireland (IFUT, INTO).
6
Denmark (DLF); Greece (OLME); Spain (FE.CC.OO, FETE-UGT, STES-I, CSI-F); Italy (FLC-CGIL, UIL SCUOLA);
Portugal (FENPROF, FNE); Sweden (Lararforbundet); UK (NASUWT, NUT).
19Figure 3: Where reforms of national education systems occurred, have the social partners
been involved in the decision making process on the reforms?
61%
39%
YES NO
The Charts below identify a relation between education budget and reforms, and whether these
latter led to an increase in privatisation (Chart 6), according to respondents. As Chart 5 shows, 90%
of respondent unions declared that when reforms occurred, they were related to a decrease in
funding of education. NUT added that many changes in England were related to a decrease in
education funding insofar as the limits on funding have restricted teacher pay progression.
Chart 5. Where reforms of national education systems occurred, were the
reforms related to a decrease in funding of education?
100
80
60
40
20
0
Yes No
Chart 6. Where reforms of national education systems occurred, did they
lead to privatisation:
Percetage of respondents
50
40
30
20
10
0
Increase Remained Stable
Effect of national reforms on privatisation of education institutions/services
Note: Remaining 50% of answers to the above question are null (do not know, no reply).
20Chart 8 below also confirms that in those countries experiencing privatisation increases, the share of
GDP dedicated to education decreased between 1 and 5 percentage points (green area) according
to 41% of respondents, decreased between 5 and 10% according to 9% of respondents and by more
than 10% according to another 9% of respondent unions.
Chart 7. Whether you experienced increase of privatisation in your country,
the percentage of GDP dedicated to education had:
4%
9%
Increased between 10 and 5%
Decreased between 5 and 10% 9%
41%
Decreased more than 10%
Increased between 1 and 5%
Remained Stable 14%
Decreased between 1 and 5 %
23%
1.5. Major trends in privatisation
State of play of public/private education institutions in Western European
countries
Chart 8. What percentage of the total number of education institutions (at
all levels) is public?
Publicly funded education institutions
0% 20% 40% 60% 80% 100%
More than 80% Between 61 and 80% Between 21 and 40%
As the Chart 8 above clearly shows, a large majority of education institutions in western European
countries are publicly funded. Almost all the responding unions declared that more than 80% of
education institutions at all levels are public. However, a sectoral analysis shows that this rate slightly
decreases for Vocational Education and Training (VET) and Higher education and research institutes
(see Chart 9 below).
21Chart 9. What percentage of the total number of education institutions (per
sector) is public?
Early childhood
Primary school
Secondary school
Vocational Education and Training
Higher education and research
0% 10% 20% 30% 40% 50% 60% 70% 80% 90% 100%
More than 80% Between 61 and 80% Between 21 and 40%
When asked about the percentage of private education institutions, the picture slightly changes.
Chart 11 shows that according to the majority of respondents less than 20% of education institutions
in their countries are private (answer: “between 5 and 20%”). However, an important share of
respondents (40%) affirmed that private education institutions are between 21 and 40%.
Chart 10. What percentage of the total number of education institutions (at
all levels) is private?
Privately funded education institutions
0% 20% 40% 60% 80% 100%
More than 80% Between 61 and 80% Between 21 and 40% Between 5 and 20% Less than 5%
Chart 11. What percentage of the total number of education institutions
(per sector) is private?
Early childhood
Primary school
Secondary school
Vocational Education and…
Higher education and research
0% 20% 40% 60% 80% 100%
More than 80% Between 61 and 80% Between 21 and 40% Between 5 and 20% Less than 5%
As the Chart 11 above shows, private education institutions are mainly present in primary education,
vocational education and training and in early childhood education.
22Chart 12. Have you experienced increasing privatisation in education in
your country?
0% 10% 20% 30% 40% 50% 60% 70% 80% 90% 100%
1
Yes 13
No 2
Yes No
YES NO
Belgium (COV, CSC-E), Switzerland (LCH), Germany Finland (OAJ), France (SE-Unsa, SNES-FSU),
(GEW, VBE), Denmark (DLF), Greece (OLME), Spain Ireland (IFUT, TUI), Italy (UIL Scuola), Norway
FE.CC.OO, FETE-UGT, STES-i, CSI-F), France (FEP-CFDT), (NAR), Portugal (FNE)
Ireland (INTO, ASTI) , Italy (FLC-CGIL), Luxemburg
(SNE-CGFP), Norway (UEN), Portugal (FENPROF),
Sweden (Lararforbundet), UK (NASUWT, NUT)
Throughout the analysis, replies from different unions within the same country are not always
consistent. The present report takes account of the countries in which at least one - or more than
one - teacher union has answered affirmatively. This choice is based on the fact that privatisation
might vary according to the different education sectors trade union respondents represent.
Member organisations were asked at which level of education privatisation was most frequent. The
list below ranks the education level in which privatisation showed the greatest increase according to
each union/country ranking.
Chart 13. At which education level(s) is privatisation most widespread?
0 5 10 15 20
Secondary (general)
Pre-primary
Secondary (VET)
Primary
Higher education and research
Teachers continuous professional training
Teachers initial education
The Greek teacher union OLME reported increasing privatisation in in-service teacher training and in
VET provision during the years 2013-2015. This was due to budget cuts in education, especially in
public VET schools, and was reflected in the elimination of several VET subjects. Private providers
were encouraged to move into the subject areas no longer covered. Many students previously
enrolled in the affected VET subjects had no choice but to turn to private education if they wanted
to continue on their learning path. The Irish second level teachers union ASTI provided an explanation
of how privatisation in teachers’ initial education occurred. In their country, a private for-profit
college of education is now licensed to provide initial teacher education. Publicly funded teacher
23education institutions have a de-facto limit or cap on the number of graduates they can enrol. As the
private college (Hibernia College) has no such cap, and does most of its teaching on-line, it has two
groups of teacher graduates coming into the system each year. It is now the largest provider for
teacher education at primary level and the second largest at secondary level.
Privatisation of education services
Half of respondent organisations reported privatisation of education services in education
institutions (Chart 14). The Chart 15 below shows privatisation of education services in education
institutions according to each sector of education, as reported by teacher unions.
Chart 14. Did you experience privatisation of education services in
education institutions?
1
0% 10% 20% 30% 40% 50% 60% 70% 80% 90% 100%
1
Yes 14
No 14
Chart 15. Did you experience privatisation of education services in
education institutions?
15 Yes
No
10
5
0
Higher education and Vocational education Secondary school Primary school Early childhood
training and training
Several services were listed by respondents as being privatised, including school catering and
transport (Spain – FE.CC.OO., FETE-UGT and UGT STES-i), after school-support centres (France – FEP-
CFDT and Portugal – FENPROF), catering, security and school stationary (Portugal – FENPROF).
Funding models
When it comes to funding models, the most common form of privatisation in Western Europe is the
‘Public grant-aided education institution”, present in 13 countries7 out of 15 surveyed, according to
the experience of teacher unions at all levels, as the following graph shows (Chart 16). Religion-based
education institutions receiving public funding are also quite common, being present in 11
countries8. ASTI, the Irish teacher union, reported that in Ireland there are mainly religion-based
institutions privately funded. Only a minority of such institutions receive public funding. They
7
Belgium, Germany, Denmark, Spain, Finland, France, Ireland, Italy, Luxemburg, Norway, Portugal, Sweden,
UK.
8
Belgium, Germany, Denmark, Spain, Finland, France, Ireland, Italy, Luxemburg, Norway, Portugal.
24operate largely from fees paid by parents. In the UK, according to NUT, private providers run many
schools on contract.
Chart 16. What kind of privatisation have you experienced the most?
0 10 20 30 40 50
Public grant-aided education institutions
Religion-based education institutions publicly funded
Certain parts/ service
Fully private education institutions
Religion-based education institutions privately funded
In addition to the categories proposed, the Irish teacher union TUI further pointed to the presence
of so-called “Grind schools”, which are fee paying privately run schools outside the state sector, while
the Portuguese teacher union FNE reported the presence of “Private institutions of Social Solidarity”.
The Chart 17 below shows the kind of privatisation experienced in each sector of education,
according to respondent unions.
Chart 17. What kind of privatisation have you experienced the most
according to your sector?
Early childhood
Primary school
Secondary school
Vocational education and training
Higher education and training
0.0 20.0 40.0 60.0 80.0 100.0
Fully private education institutions
Public grant-aided education institutions
Religion-based education institutions publicly funded
Religion-based education institutions privately funded
The mapping exercise below (Table 2) shows what kinds of private education institutions are present
in each country, according to the aggregation of answers of surveyed organisations. However, the
list of private education institutions that exist in one country should not be confused with the
quantity of private education institutions present or the student outreach capacity of such
institutions.
25Table 2. Which type of private education/training institution offers educational programs in your
country?
Fully private Public grant- Religion-based Religion-based
education aided education education education
institutions institutions institutions institutions
publicly privately funded
funded
Belgium - Wallonia
Germany
Spain
France
Ireland
Italy
Norway
Portugal
Belgium - Flanders
Luxembourg
Denmark
Finland
UK
Switzerland
Greece
Sweden
Who runs privately-funded education institutions?
Some survey respondents indicated who runs privately-funded education institutions in their
countries. The replies are as follows:
Belgium: Private persons or communities sometimes with religious and/or pedagogical
backgrounds
Switzerland: Private entities (or foundations) under the supervision of the cantons
(competent regional political levels)
Greece: individual entrepreneurs
Spain: private companies, the State, religious entities, cooperative societies
France: The State for public-grant aided education institutions (Ministry, Rectorat),
Managing entity of religious education institutions
Germany: Private companies, both for profit and not for profit, Foundations, Corporations,
and Associations in higher education and research. For VET sector: Business associations,
Religious organisations
Ireland: Churches and religious trusts, Individual owners, Corporate, Company/directors,
Private trusts, Commercial bodies
Italy: Catholic congregations, Parishes, Private multinational companies (e.g. Mission Laique
Française, American School Abroad), Private entrepreneurs
UK: Privately funded schools granted charitable status
Portugal: Education institutions’ owners, Individual and collective entities. Cooperatives,
Private Welfare, Companies, Religious associations
26Are they profit or not for profit?
Chart 18 shows that around 60% of respondent unions affirmed that the majority of private
education institutions in their respective countries have not-for-profit purposes, while the remaining
nearly 40% of privately funded education institutions are for profit.
Chart 18. What kind of privately-funded education institutions is wide-
spread the most in your country?
0% 10% 20% 30% 40% 50% 60% 70% 80% 90% 100%
1
For-profit education institutions 11
Not-for profit education
18
institutions
Mostly For-profit Mostly Not-for Profit
Switzerland (LCH), Spain (FE.CC.OO, FETE-UGT, Belgium (COV, CSC-E), Denmark (DLF), Germany
STES-i, CSI-F), France (FEP-CFDT, SE-UNSA), Ireland (GEW, VBE), Greece (OLME), Denmark (DLF),
(ASTI), Italy (UIL Scuola), Portugal (FENPROF, FNE) Greece (OLME), France (SNES-FSU, FEP-CFDT),
Ireland (IFUT, INTO, TUI), Italy (FLC-CGIL),
Luxemburg (SNE-CGFP), Norway (NAR, UEN), UK
(NASUWT, NUT)
Chart 19. What kind of privately-funded education institutions is wide-spread
the most in your country according to the sector you represent?
12
10
8
6
4
2
0
Higher education and Vocational education Secondary school Primary school Early childhood
training and training
For-profit education institutions Not-for profit education institutions
27Finally, teacher unions were asked
Chart 20. Is there any global whether they are aware of the presence
corporation/consultancies influencing
of global corporation/consultancies
education policy, delivery of education
influencing education policy, the delivery
products and or schooling in your
country? of education products and/or schooling
in their country. A large share of
21% surveyed answered “Yes” (62%), 17% of
respondents said that they were not
aware of the presence of such
international corporations, and 21% of
respondents affirmed that there are no
17% multinational companies influencing
education in their country. According to
the Irish union ASTI, private
62% corporations/consultancies are not
directly influencing education policy;
Yes No Don't know however, they have a wide ideological
influence. Teacher unions representing
teachers, trainers and educators in the VET sector have been the most important group to respond
“Yes”, followed by unions representing teachers in primary schools and early childhood education
(Chart 21).
Chart 21. Is there any global corporation/consultancies influencing
education policy, delivery of education products and or schooling in your
education sector?
Secondary school
Higher education and training
Early childhood
Primary school
Vocational education and training
60 62 64 66 68 70 72 74 76
Percentage of respondents "Yes"
28Geographical distribution
The map below shows the geographical distribution of responses on widespread privatisation
according to funding mechanism of education institutions in Western European countries.
Figure 4: Private education institutions as percentage of the total
Figure 5. Fully private education institutions by country
29Figure 6. Public grant-aided education institutions by country
Figure 7. Religion-based publicly funded education institutions by country
30Figure 8. Religion-based privately funded education institutions by country
312. Teachers’ working conditions and trade union action
2.1 Organising education workers
This chapter looks in depth at teacher unions’ activity in western European countries. It describes
challenges that emerged over the last 2 years and the state of teachers’ working conditions. In order
to gather sufficient information and to better understand such challenges, the analysis is at the level
of the respondent unions. The following graphs illustrate the level of union representation of
education workers in private education institutions.
The topic has been addressed both from the point of view of the Statutes or Constitution of the
teacher union and from the concrete percentage of union affiliates working in private education
institutions in each organisation. 99 unions out of 29 have formal limits in their Statutes or
Constitution on representing education workers in private education institutions.
As the figure below shows, the vast majority of respondents (20 out of 29) have the legal possibility
to organise education workers in private education institutions and provide for that possibility in
Statutes or the Constitution.
Chart 22. Organisation of education workers in private education institutions
according to unions' Statute or Constitution
25
Percentage of 20
organisations'
15
affiliates working in
10
private education
institutions 5
0
Yes (20) No (9)
No 1 9
Less than 20% of affiliates 16
Between 20 and 40% of affiliates 1
Between 61 and 80% of affiliates 2
However, when those who could represent education workers in private institutions according to
their Statutes have been further asked which percentage of education workers are, in fact, union
affiliates, the rate is very low (less than 20% of affiliates). Only COV in Belgium-Flanders and TUI in
Ireland answered that between 61 and 80% of their affiliates work in private education institutions.
Some of those not organizing teachers in private education institutions have formal limits to their
affiliation in their Constitutions. In Greece, the Constitution of OLME defines it as a trade union for
secondary school teachers working in public schools only. Alike in France, SNES-FSU accepts
education employees who work in secondary public schools and in Luxemburg SNE-CGFP represents
civil servants working in public schools. The situation is less clearly defined in Belgium, where COV
represents teachers working in publicly funded private education institutions. However, such
teachers are paid by the State as civil servants. They represent between 61 and 80% of COV’s
affiliates. In Ireland, TUI reports that the organization of education workers in private institutions is
9 According to Statutes or Constitution the following teacher unions in Switzerland (LCH), Germany (VBE),
Greece (OLME), Spain (CSI-F), France (SE-UNSA, SNES-FSU), Ireland (ASTI), Luxemburg (SNE-CGFP), do not
organise private sector workers.
32not prohibited by its Constitution or Statutes. The organisation of public school employees is, rather,
a matter of history and tradition above all. The TUI is currently considering recruiting employees in
private higher education institutions. Similarly, the Irish union ASTI does not have a specific provision
in its Constitution/Statute, but it has been the established practice of the Union since such
institutions began operating in Ireland in the late 1970s.
2.2 Teachers’ representations: A state of play
Main challenges in the representation of the teaching profession
The following data illustrates some of the challenges in the representation of the teaching profession
of teacher unions in the last 2 years.
A ranking based on multiple choice questions shows that recruiting and retention of teachers is still
problematic for many unions (67% of respondents). At the same level, continuous professional
development and initial training of teachers are considered as a challenge for the majority of
respondents (59% and 50% of respondents respectively, as Charts 23 and 24 show).
On several occasions, ETUCE has reported on the effects of the economic crisis on the teaching
profession; a lowering of the status of teachers. This development has made teacher recruitment
and retention more difficult. There have been related problems of not being able to provide effective
initial training and continuous professional development once entering the profession10.
Chart 23. Main challenges for teacher trade unions in Western European
countries in the last 2 years
Recruitment and retention of teachers
Continuous professional development of teachers
Initial teacher training
Evaluation of teachers
External evaluation/ examination of students
Parallel associations claiming to represent teachers
0 10 20 30 40 50 60 70
10
ETUCE Project “The development of the teaching profession in times of the economic crisis as a key task for
social partners in education. Finding joint strategies to tighten the links between education and the labour
market" (2012 -2013); ETUCE Project “Recruitment and Retention in the Education Sector, a matter of Social
Dialogue” (2011-2012)
33You can also read