CHANGES IN VICTORIAN ATTITUDES AND PERCEPTIONS OF THE WASTE AND RESOURCE RECOVERY SECTOR: 2016 TO 2019 - ANDREA WALTON, ROD MCCREA, AND TALIA ...
←
→
Page content transcription
If your browser does not render page correctly, please read the page content below
LAND AND WATER

Changes in Victorian attitudes
and perceptions of the waste
and resource recovery sector:
2016 to 2019
Andrea Walton, Rod McCrea, and Talia Jeanneret

August 2019

Engaging Communities on Waste project
Citation
Walton, A., McCrea, R., and Jeanneret, T. (2019). Changes in Victorian attitudes and social acceptance in
the waste and resource recovery sector: 2016 to 2019 CSIRO, Australia.
Front cover image: Saved from landfill, Eaglehawk Recycle Shop by Social Traders CC BY 2.0

Copyright
© Commonwealth Scientific and Industrial Research Organisation 2019. To the extent permitted by law,
all rights are reserved and no part of this publication covered by copyright may be reproduced or copied
in any form or by any means except with the written permission of CSIRO.

Important disclaimer
CSIRO advises that the information contained in this publication comprises general statements based on
scientific research. The reader is advised and needs to be aware that such information may be
incomplete or unable to be used in any specific situation. No reliance or actions must therefore be made
on that information without seeking prior expert professional, scientific and technical advice. To the
extent permitted by law, CSIRO (including its employees and consultants) excludes all liability to any
person for any consequences, including but not limited to all losses, damages, costs, expenses and any
other compensation, arising directly or indirectly from using this publication (in part or in whole) and
any information or material contained in it.
CSIRO is committed to providing web accessible content wherever possible. If you are having difficulties
with accessing this document please contact csiroenquiries@csiro.au.

Funding
This research is part of the ‘Engaging Communities on Waste’ project and was jointly funded by
Sustainability Victoria and the CSIRO.

Report Milestone 4| engaging communities on waste| August 2019|1
Contents
Acknowledgements ............................................................................................................................. 6
Executive Summary ............................................................................................................................. 7
What we did ............................................................................................................................ 7
Who participated..................................................................................................................... 7
What we found ........................................................................................................................ 8
Social acceptance .................................................................................................................. 10
Key conclusions ..................................................................................................................... 13
1 Introduction and background information ........................................................................... 15
2 Method: How we conducted the research ........................................................................... 19
3 Knowledge and attitudes about waste and recycling ........................................................... 23
3.1 Knowledge levels of the waste and resource recovery system ............................... 23
3.2 Attitudes ................................................................................................................... 24
4 Waste reducing behaviour .................................................................................................... 30
4.1 Self‐reported behaviour ........................................................................................... 30
4.2 Effort put into reducing waste at work and home................................................... 32
4.3 Underlying drivers of waste reducing intentions and behaviour ............................ 32
4.4 Predicting intentions and effort to reduce waste and waste reducing behaviours 34
5 Social acceptance and perceptions of waste and resource recovery hubs .......................... 35
5.1 Levels of social acceptance of a waste complex ...................................................... 35
5.2 Underlying drivers of social acceptance .................................................................. 38
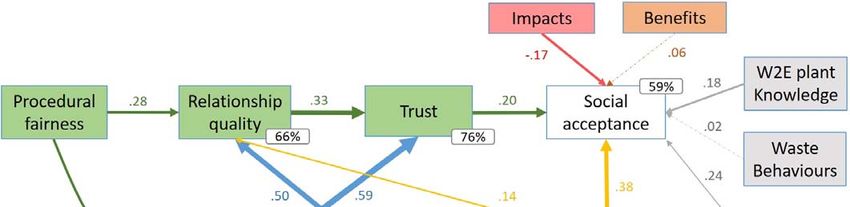
5.3 Model of social acceptance: waste and resource recovery ..................................... 41
5.4 Deeper dive into the underlying drivers .................................................................. 43
6 Social acceptance and perceptions of waste to energy plants ............................................. 57
6.1 Perceptions of waste to energy ............................................................................... 57
6.2 Attitude towards living near a waste to energy plant ............................................. 57
6.3 Awareness and understanding of waste to energy ................................................. 59
6.4 Model of social acceptance: waste to energy.......................................................... 60
7 Demographic differences ...................................................................................................... 63
8 Conclusions ............................................................................................................................ 65
9 References ............................................................................................................................. 67
Appendix A Waste and resource recovery system ...................................................................... 68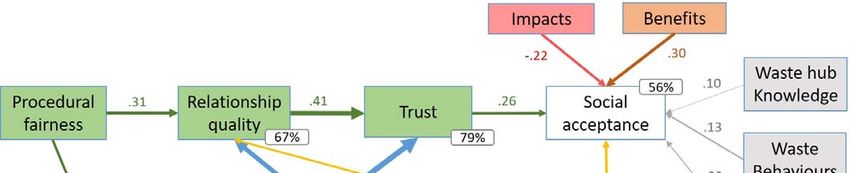
Appendix B              Example of the scenarios used in the survey ........................................................... 69
Appendix C      Survey results: Social acceptance and perceptions of Waste and Resource Recovery
Facilities and Waste to Energy plants ................................................................................................ 72
Appendix D              Survey results for knowledge, attitudes and behaviour items ................................ 78

Figures
Figure 1 Self‐rated knowledge scores.................................................................................................. 8
Figure 2 Percentage of items in kerbside recycling bins believed to be recycled into new products:
2019 ..................................................................................................................................................... 9
Figure 3 Views about the waste hierarchy as the best options for managing waste: 2019 ............... 9
Figure 4 Willingness to pay a little more for household waste collection / disposal to reduce the
amount of waste going to landfill: 2016 and 2019............................................................................ 10
Figure 5 Acceptance of living near a waste facility 2016 and 2019: Differences between impacted and
non‐impacted residents ..................................................................................................................... 11
Figure 6 Main drivers underlying acceptance of living near a waste facility: waste hubs and waste to
energy plants ..................................................................................................................................... 12
Figure 8 Drivers of social acceptance in the waste domain .............................................................. 18
Figure 9 Survey procedure ................................................................................................................. 19
Figure 10 Self‐rated knowledge scores: 2016 and 2019 ................................................................... 23
Figure 11 Views about the waste hierarchy as the best options for managing waste: 2019 ........... 24
Figure 12 Perceived essentialness of various services: 2016 and 2019 ............................................ 25
Figure 13 Beliefs about sectors contributing to total waste: 2016 and 2019 ................................... 26
Figure 14 Beliefs about responsibility for reducing waste: 2016 and 2019 ...................................... 26
Figure 15 Percentage of items in kerbside recycling bins believed to be recycled into new products:
2019 ................................................................................................................................................... 27
Figure 16 Beliefs about recycling management and outcomes: 2019 .............................................. 28
Figure 17 Willingness to pay a little more for household waste collection / disposal to reduce waste
going to landfill: 2016 and 2019 ........................................................................................................ 28
Figure 18 Attitude towards different services for collecting or disposing of different types of waste:
2016 and 2019 ................................................................................................................................... 29
Figure 19 Frequency of self‐reported behaviours for reducing waste going to landfill: 2019.......... 31
Figure 20 Frequency of self‐reported behaviours for reducing waste going to landfill: 2016.......... 31

Report Milestone 4| engaging communities on waste| August 2019|3
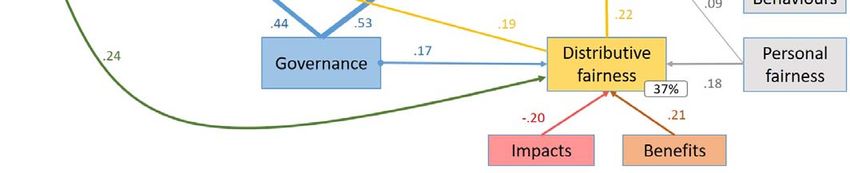
Figure 21 Effort put into reducing waste going to landfill ‐ at home / at work / out and about: 2016
and 2019 ............................................................................................................................................ 32
Figure 22 Social acceptance of different types of infrastructure: 2016 and 2019 ............................ 36
Figure 23 Acceptance of living near a waste complex, 2016 and 2019: differences between impacted
and non‐impacted residents.............................................................................................................. 37
Figure 24 Attitudes towards living near a waste and resource recovery hub: 2016 and 2019 ........ 37
Figure 25 Attitudes towards a WRR hub: Differences between impacted and non‐impacted residents,
2019 ................................................................................................................................................... 38
Figure 26 Perceptions of underlying drivers of social acceptance of a WRR hub: 2016 and 2019 ... 39
Figure 27 Perceptions of underlying drivers of social acceptance of a WRR hub: Impacted and non‐
impacted residents, 2019 .................................................................................................................. 39
Figure 28 Model explaining social acceptance of the waste and resource recovery sector............. 42
Figure 29 Relative importance and perceptions of underlying drivers of acceptance of a waste and
resource recovery hub ....................................................................................................................... 42
Figure 30 Perceptions of impacts associated with living within 2 kms of a waste complex hub: 2016
and 2019 ............................................................................................................................................ 44
Figure 31 Perceptions of impacts associated with living within 2 kms of a waste complex: Impacted
and non‐impacted residents, 2019 .................................................................................................... 45
Figure 32 Perceptions of risk manageability: 2019 ........................................................................... 46
Figure 33 Perceptions of risk manageability: Impacted and non‐impacted residents, 2019............ 46
Figure 34 Perceptions of benefits: 2016 and 2019............................................................................ 47
Figure 35 Perception of benefits: Impacted and non‐impacted residents, 2019 ............................. 48
Figure 36 Perceptions of different types of fairness: personal fairness and distributive fairness: 2016
and 2019 ............................................................................................................................................ 50
Figure 37 Perceptions of fairness: impacted and non‐impacted residents, 2019 ............................ 50
Figure 38 Perceptions of procedural fairness: 2016 and 2019.......................................................... 51
Figure 39 Perceptions of procedural fairness 2016 and 2019: impacted and non‐impacted residents52
Figure 40 Perceptions of relationship quality between the local community and the waste operator,
2016 and 2019: Differences between impacted and non‐impacted................................................. 53
Figure 41 Perceptions of trust in the sector: 2016 and 2019 ............................................................ 53
Figure 42 Perceptions of trust in the sector 2016 and 2019: Difference between impacted and non‐
impacted residents ............................................................................................................................ 54
Figure 43 Confidence in governance: 2016 and 2019 ....................................................................... 55
Figure 44 Perceptions of governance in 2016 and 2019: Differences between impacted and non‐
impacted residents ............................................................................................................................ 56
Figure 45 Comparison of attitudes towards living near a WRR complex and a waste to energy plant,
2019 ................................................................................................................................................... 57
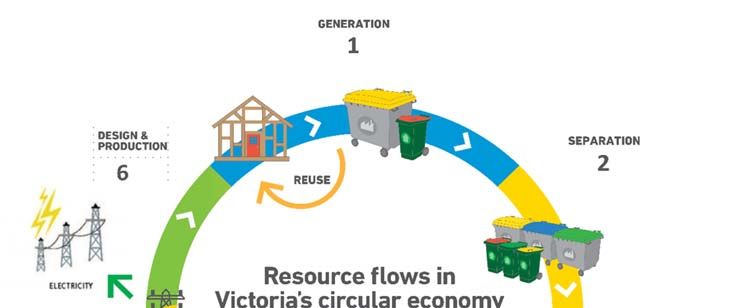
Figure 46 Attitudes towards living near a waste to energy plant: impacted and non‐impacted
residents, 2019 .................................................................................................................................. 59
Figure 47 Levels of awareness and understanding of waste to energy ............................................ 60
Figure 48 Model of acceptance of living near a waste to energy plant ............................................ 61
Figure 49 Relative importance and perceptions of underlying drivers of acceptance of a waste to
energy plant ....................................................................................................................................... 62

Tables
Table 1 Sample profile: Age, gender, geography: 2016 and 2019 .................................................... 19
Table 2 Summary of mean scores and survey items used to measure the underlying drivers of waste
reducing intentions and behaviours: 2016 and 2019 ........................................................................ 33
Table 3 Predictors of intentions to reduce waste going to landfill and predictors of waste reducing
behaviour: 2019 ................................................................................................................................. 34
Table 4 Summary of perceptions of underlying drivers of social acceptance in the waste and resource
recovery sector .................................................................................................................................. 40
Table 5 Summary of perception scores for underlying drivers and social acceptance of a waste to
energy plant compared to a waste and resource recovery complex: 2019 ...................................... 58
Table 6 Demographics: levels of knowledge and social acceptance for a waste complex and waste to
energy, 2019 ...................................................................................................................................... 64

Report Milestone 4| engaging communities on waste| August 2019|5
Acknowledgements

This research has been carried out in partnership with Sustainability Victoria.
The CSIRO would like to acknowledge the support and contribution from Ki Halstead, who is the Waste
Education Coordination Lead in Sustainability Victoria’s Resource Recovery Strategies & Program, in
completing this research.
We would also like to thank the Victorian residents who participated in this survey.

About Sustainability Victoria
Sustainability Victoria is a Victorian government agency and our vision is for a sustainable and thriving
Victoria.
Our purpose is to support Victorians to use resources more sustainably and to take practical action on
climate change – we do this via delivering programs and shaping policy.
We also have obligations under the Environment Protection Act 1970 for statewide waste management
strategy and planning.
Executive Summary
The 2019 CSIRO Victorian Attitudes to Waste Management survey measured community
attitudes and perceptions about waste and the waste and resource recovery sector,
comparing results to 2016. In the 2019 survey we also investigated attitudes and
perceptions of waste to energy.
This report documents the changes in attitudes over the three‐year period and models
the drivers that underpin trust and social acceptance of both the waste and resource
recovery and waste to energy sectors. The report also documents changes in waste
reducing behaviours currently undertaken in respondent households.
These research findings provide an evidence base for matters that are important to
communities with respect to waste, the waste and resource recovery sector, and waste
to energy. This evidence base provides opportunities for government and industry to
focus their initiatives on areas that can drive waste reducing behaviour, and increased
trust and acceptance of the sector, its infrastructure, and activities. Making changes in
these areas support sustainable waste management solutions and better outcomes for
Victorian communities.
What we did
Over a six‐week period in March and April 2019, we conducted an online survey of 1,244 Victorians
living in metropolitan and regional areas of Victoria. The survey took approximately 20 minutes to
complete and included 130 questions about people’s attitudes, knowledge and behaviour in relation to
waste and resource recovery.
We also asked half the sample of respondents (n = 621) about their views towards living near an
imaginary waste and resource recovery complex using a scenario. The other sample half (n = 623) were
given a scenario about living near a waste to energy plant. In both scenarios we asked about issues such
as possible impacts, benefits, trust, and governance in relation to living near such a site.
Who participated
The survey sample included people from all over Victoria. The sample design ensured half the
participants lived within a 2 km radius of waste and resource recovery infrastructure, as listed in the
‘Existing hubs of state importance’, Statewide Waste and Resource Recovery Infrastructure Plan: Victoria
2015‐44. The other participants were from across urban and regional Victoria.
68.5% from Metropolitan Melbourne
31.5% from Regional Victoria
All participants were randomly selected from a panel of approximately 75,000 participants.
Report Milestone 4| engaging communities on waste| August 2019|7
Participants were asked if they were negatively affected by a waste and resource recovery facility near
their home such as a landfill, transfer station, or organic processing facility.
50% self‐ identified as ‘Impacted residents’
50% self‐identified as ‘Non‐impacted residents’; also referred in the report as ‘Victorian public’
The people who completed the survey were over 18 years old and representative of Victoria based on
ABS (2015) statistics for age, sex, and geography.
What we found
Self‐rated knowledge
In 2019, residents felt they knew significantly more about landfills and the use of recycled
materials in new products compared to 2016.
Knowledge about household waste collection services was good.
Knowledge about the overall waste and resource recovery system was low, especially
knowledge about ‘waste to energy’ production.
Figure 1 Self‐rated knowledge scores
3.5
Household waste collection services
3.4
3.1
The sorting, recycling and recovery of materials
3.0
3.0 2019
Landfill services or tips *
2.8
3.0 2016
The use of recycled materials in new products *
2.8
2.8
The overall waste and resource recovery system
2.7
2.5
‘Waste to energy’ production #
1 2 3 4 5
Self rated knowledge
Note: 1 = No knowledge; 3 = some knowledge; 5 = A lot of knowledge
*significant difference between years; # significantly lower than other items (pFigure 2 Percentage of items in kerbside recycling bins believed to be recycled into new products: 2019
25% 75%
70%
20% % of residents
Percentage of respondents
Cumulative percentage
20% 60%
58% 17% Cumulative %
15% 49% 50%
15% 14%
40%
35%
10% 9% 8% 30%
7%
20% 5% 20%
5% 3%
2% 10%
0% 0%
0‐10% 11‐20% 21‐30% 31‐40% 41‐50% 51‐60% 61‐70% 71‐80% 81‐90% 91‐100%
Percentage of items believed to be recycled
Attitudes about waste
General views about the waste hierarchy as a way to manage waste
Almost 75% of people thought landfills were the worst option for managing waste.
Approximately 45% of people thought the avoidance of waste generation was the best option
for managing waste.
Approximately 80% of people ranked reusing and recycling waste materials in their top three
options for managing waste.
Up to 40% of people ranked waste to energy as their least two preferred options for managing
waste.
Figure 3 Views about the waste hierarchy as the best options for managing waste: 2019
100%
90%
Percentage of respondents
80%
70%
60% Best option
50%
2nd best
40%
30% 3rd best
20%
4th best
10%
0% Worst option
Avoid the Reuse materials ‐ Recycle waste ‐ Recover energy ‐ Dispose of waste
generation of without additional using waste in by using residual into landfills
waste processing other processes waste to generate
energy
Report Milestone 4| engaging communities on waste| August 2019|9Essentialness of waste and resource recovery services
Waste and resource recovery services were perceived as very essential services.
As in 2016, waste management and resource recovery services were ranked 5th in essential
services to emergency services, hospital and health services, water and sewerage services, and
electricity and gas services.
Willingness to pay more to reduce waste going to landfill
In 2019 more people were prepared to pay more to reduce waste going to landfill than those
who disagreed. Compared to 2016, there was a statistically significant increase in the
percentage of residents willing to pay a little bit more in 2019; now 40% agree or strongly
agree.
Figure 4 Willingness to pay a little more for household waste collection / disposal to reduce the amount of waste going to
landfill: 2016 and 2019
2016 2019
40%
Percentage of participants
35%
32%
30% 27%
23%
20% 16% 15% 15%
12% 13%
10%
10%
0%
1 2 3 4 5
Note: 1 = Strongly disagree; 5 = Strongly agree Willingness to pay a little more
Social acceptance
Social acceptance of the waste and resource recovery sector
The broader Victorian public (non‐impacted residents) have significantly lower levels of
acceptance of waste and resource recovery facilities than residents who actually live near a
waste facility and feel impacted by the facility.
Acceptance levels for impacted residents were positive on average while acceptance levels for
non‐impacted residents were negative on average.
Acceptance levels of non‐impacted residents had reduced in 2019 compared to 2016, whereas
acceptance levels for impacted residents were unchanged.Figure 5 Acceptance of living near a waste facility 2016 and 2019: Differences between impacted and non‐impacted
residents
5
Not impacted Impacted
Perceived acceptance levels
4
3.09 3.11
3 2.85
2.60
2
1
2016 2019
Note: 1 = Strongly disagree; 5 = Strongly agree, Significant difference between 2016 and 2019 for non‐impacted residents (pdumping, dust, health impacts, and environmental impacts on air, soil and water. The highest
concerns regarding waste to energy plants were about odour, air quality, and health impacts,
and the potential for illegal roadside dumping.
Perceived benefits – Residents also saw benefits with waste hubs. The main local benefits of
living near a waste hub was the convenience of being able to dispose of large household items
and garden rubbish, and the local employment and training opportunities the hub provides.
Victorians also saw the main societal benefits of waste hubs as managing waste generated by all
sectors and helping existing landfills last longer. Societal benefits for waste to energy plants were
seen as higher than those for waste hubs, which included landfills.
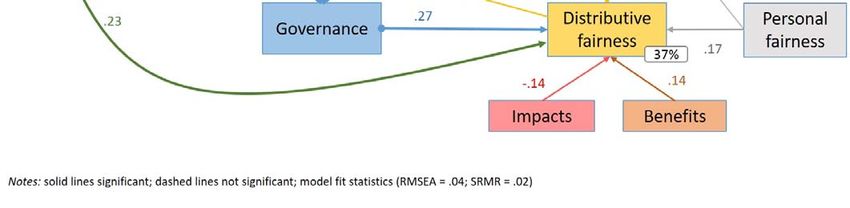
Distributive fairness – This takes into account whether residents consider it is fair to live near
waste hubs and waste to energy plants, including wider societal considerations. Distributive
fairness was modest for living near waste hubs, though, higher for waste to energy plants. The
findings suggest that distributive fairness can be enhanced by strong narratives as to the broader
need for waste complex activities at particular locations, minimising any perceived impacts, and
compensating or providing benefits for local communities.
Figure 6 Main drivers underlying acceptance of living near a waste facility: waste hubs and waste to energy plants
Waste and resource recovery complexes Waste to energy plants
3.2
Trust
3.2
3.4
Governance
3.4
3.0
Distributive Fairness*
3.2
3.8
Benefits: Societal*
3.9
3.6
Benefits: Local
3.6
3.7
Impacts*
3.6
1 2 3 4 5
Acceptance scores
Note: 1 = Strongly disagree; 5 = Strongly agree: * indicates significant difference (pKey conclusions Victorians are still motivated to recycle and reduce waste going to landfill despite negative incidents in the media Following the 2016 survey, several events in the industry had the potential to negatively impact waste‐reducing intentions and behaviours of Victorian households. Despite this, Victorians remain motivated to reduce the amount of waste going to landfill and continue to view the waste and resource recovery sector as an essential service. Victorians presently impacted by a waste and resource recovery facility have more favourable attitudes toward the sector than those who are not impacted In terms of where they live, people impacted by waste and resource recovery infrastructure report more positive attitudes about living near a waste and resource recovery hub than the broader Victorian public, who can only imagine it. Impacted residents have become slightly more positive about the sector since 2016, whereas non‐impacted residents have become less favourable. Knowledge reduces perceptions of risk associated with waste complexes and waste to energy plants Higher levels of knowledge about waste hubs and waste to energy plants were linked to lower perceived risk associated with these facilities. More knowledge was also linked to increased levels of social acceptance, though the effects of knowledge on perceived risks and acceptance were greater for the waste to energy scenario and only modest for acceptance of a waste hub. Nonetheless, community knowledge about waste hubs and waste to energy plants was very low, representing a significant opportunity to improve people’s understanding, with subsequent improvement in an understanding of risks and increased confidence in the manageability of any risk. Perceived benefits underpinning social acceptance of a hub relate to the recycling and recovery activities People perceived benefits that a waste and resource recovery hub offer, such as local economic and social investment benefits and broader societal benefits, only when the hub included recycling and resource recovery activities. If the hub was to function solely as a landfill, support for the hub would reduce, and the perceived benefits would also be diminished. Governance is doing a good job in contributing to trust and the acceptance of hubs People’s perception of governance was robust and this confidence contributed significantly in residents forming more positive views of the relationship between the industry and local communities, and trust in the sector. Impacted residents viewed matters related to governance of the waste and resource recovery sector positively on average whereas non‐impacted residents were less favourable. Report Milestone 4| engaging communities on waste| August 2019|13
People are more accepting of living near a waste to energy plant than a waste and
resource recovery hub
The difference in these views are most likely explained by the presence of a landfill within a waste
and resource recovery hub rather than the acceptance level of the waste to energy plant being
high.

When people reduce waste in their homes, it spills over to increased support for a
waste and resource recovery hub
The more recycling and other waste reducing behaviours undertaken in a person’s household the
more accepting a person is of the hub. This is largely driven by the hub functioning as recycling and
waste recovery complexes as well as a landfill, which are activities that align with waste reducing
behaviours.

Demographic differences are less important in driving attitudes than social
perceptions
Demographic differences do not seem to drive differences in attitudes towards the sector as much
as perceptions of trust, governance, impacts, benefits, and fairness. There is little variation in these
perceptions based on characteristics such as age, gender, income levels, education levels and
household size. Demographic differences are evident when it comes to knowledge of the WRR
system, WRR hubs, and waste to energy plants. However, these differences tended not to translate
to waste reducing behaviours or acceptance of waste facilities.
1 Introduction and background information

This research investigates community attitudes and perceptions of waste and the waste and resource
recovery sector in Victoria, and measures changes between 2016 and 2019. It identifies differences in
perceptions between those who currently feel impacted by waste and resource recovery infrastructure
and the broader Victorian public. The research also examines attitudes and perceptions of waste to
energy in 2019. The report builds on previous research findings of an earlier CSIRO‐SV research project
and uses the same survey instrument to compare attitudes in 2019 to three years earlier. This current
study also examines waste to energy perceptions for the first time.
Understanding community attitudes and perceptions of the waste and resource recovery sector is
important if the aim is to achieve sustainable waste management solutions for our growing populations.
Research findings from studies such as this is another way of giving voice to communities about what is
important to them. Gathering empirical evidence on matters that are important to communities helps
policy makers, planners, and industry deliver changes to the waste and resource recovery sector that
will meet community expectations.
The nature and function of waste management activities and types of infrastructure are forever evolving
as the sector responds to the increasing challenges of growing urban centres, changes to our climate,
changing consumer habits and social trends, and the ongoing emergence of new materials and products
that require a waste management solution. Through innovative technology and new waste management
solutions the waste and resource recovery sector is increasingly becoming a key component of the
circular economy. Achieving broad community support for the changes and initiatives taking place in this
domain is integral to achieving the best possible outcomes for our communities, regions, and cities.
This research provides government, industry and community stakeholders with the opportunity to
address issues that matter to local communities. These issues are wide‐ranging and encompass
community engagement processes to ensure community involvement, mitigating impacts, delivering
benefits, ensuring robust governance, and addressing issues of fairness and trust. It is through
addressing the breadth of these issues that the sector can achieve broad community support for their
plans and activities.
PROJECT AIMS

   1. Report community attitudes and perceptions about waste, waste reducing behaviour, the waste
      and resource recovery sector, and waste to energy in 2019; and how these perceptions have
      changed from 2016.
   2. Identify and expand our understanding of the drivers for building trust and community acceptance
      of the waste and resource recovery sector, its operators, facilities, and activities; including waste to
      energy plants.
   3. Identify and confirm the relative importance of the key drivers that contribute to building trust and
      achieving acceptance in the waste and resource recovery sector; including waste to energy plants.
   4. Communicate key messages to inform opportunities for policy, programs, and collaborative actions
      to shape behaviour among stakeholders in the waste and resource recovery sector that support
      waste reducing behaviour and social acceptance of sustainable waste management solutions.

Report Milestone 4| engaging communities on waste| August 2019|15
KEY EVENTS OVER PREVIOUS 18 MONTHS
Since the previous survey conducted in 2016, a range of state and national events, and other social
changes have occurred, each contributing to possible changes in attitudes and perceptions of the waste
and resource recovery sector in 2019. Seven events are described briefly in this section to provide
relevant background and contextual information.
China ‘bans’ Australian imports of recycling waste
In January 2018, China imposed restrictions on the import of recyclable material; decreasing maximum
contamination thresholds. The threshold of 0.5% contamination for plastics and paper is currently
unachievable for Australia’s processing facilities, effectively ‘banning’ Australia’s recyclable material
from China. Australia is heavily reliant on overseas markets such as China to purchase and reprocess
materials such as paper, plastic and glass; leaving processors with limited options. Further to this, the
‘ban’ has led to an oversupply and decrease in the average price of mixed paper and mixed plastic scrap
with subsequent losses for processors.
Without a significant market for Australia’s recyclables, some processors have resorted to stockpiling
materials, while others refused to accept any more material from local councils. Some local councils
have also been forced to send recyclable material to landfill sites when no other alternative has been
available. The ban and its impacts to Australia were highly publicised by national media outlets, with
reports also highlighting the potential for council rate rises as councils struggled to cope with increased
kerbside recycling collection costs. The State Government has subsequently intervened to provide
additional funding aimed towards developing solutions to the issue.
Serious fires within metropolitan Melbourne related to stockpiling of waste
Metropolitan Melbourne has experienced a number of serious fires occurring at warehouses, transfer
stations and recycling facilities where waste and recycling materials have been stockpiled. Several
notable incidents are listed below in chronological order. Serious impacts of these incidents included
evacuations of local residents, pollution of local waterways, and sending burnt/contaminated
recyclables to landfill.
July 2017 – SKM recycling facility in Coolaroo. Residents forced to evacuate
April 2018 – Knox Transfer Station in Wantirna
August 2018 – Warehouse in West Footscray stockpiling chemicals
October 2018 – Knox Transfer Station in Wantirna
April 2019 – Warehouse in Campbellfield stockpiling toxic chemical waste
April 2019 – Recycling plant in Tottenham
The last two events occurred shortly after the 2019 survey.
SKM recycling difficulties
In February 2019, SKM Recycling, who receives the majority of Victoria’s kerbside recycling, were
ordered by the EPA to stop accepting materials at their recycling plants in Coolaroo and Laverton due to
concerns that stockpiled plastic posed a high fire risk. Local councils serviced by SKM were forced to
send recyclable material to landfill while the sites were cleared. This caused a significant disruption to
the recycling system.Independent inquiry into the EPA and subsequent changes An independent inquiry was undertaken into the EPA to examine and advise on its future. The final report of the inquiry was handed down in March 2016, and identified 48 areas for improvement. The Government released its response in January 2017, supporting in full or in part, all of the recommendations. Following the Government’s response to the Inquiry major changes were made to the Environment Protection Act 1970 in two phases. In October 2017, legislation passed to establish the EPA as an independent statutory authority and legislated a Governing Board, Chief Executive Officer and Chief Environmental Scientist. The Environmental Protection Act was further amended in 2018. In order to work within the new legislation the EPA is overhauling its services, systems and processes. When the amended Act commences in 2020 it will give the EPA “enhanced powers and tools to prevent risks to the environment and human health as well as the ability to issue stronger sanctions and penalties which hold environmental polluters to account” (Environmental Protection Authority Victoria, 2018). Further to this, the legislation includes a new environmental duty requiring businesses and individuals to understand and minimise risks to human health and the environment, which will be criminally enforceable. Parliamentary Inquiry into waste and recycling On 6 March 2019, the legislative council of Victoria actioned an inquiry into current circumstances in municipal and industrial recycling and waste management as a result of the impacts caused by China’s waste import restrictions. Media coverage on waste and recycling issues In May 2017, the first season of The War on Waste premiered on the ABC. The television program consisted of three episodes with a focus on the generation, impacts and solutions of material waste in Australia. A second season with an additional three episodes aired in July 2018. The program is considered to have had a significant impact with notable campaigns to ban single use plastic bags from supermarkets, ban plastic straws from food outlets and decrease the use of disposable coffee cups. This opened up increased media coverage from Four Corners, The 7:30 report, Foreign Correspondent and Q&A. As a result, the Australian public has seen an increase in negative interest in waste issues. Australian Paper proposal for a waste to energy plant Australia Paper are currently in the planning stages to build a waste‐to‐energy plant in the Latrobe Valley. The plant will be built in partnership with Suez and will be used to help power Australian Paper’s mill in Maryvale. Feasibility studies have been completed and construction of the plant is expected to commence by 2020. The plant is expected to generate 225 megawatts of electricity and use 650 million tonnes of waste per year. Australian Paper are currently looking to secure a long term supply of municipal solid waste, and commercial and industrial waste. Report Milestone 4| engaging communities on waste| August 2019|17
DRIVERS OF SOCIAL ACCEPTANCE IN THE WASTE DOMAIN

The survey draws from earlier research findings to measure and test key drivers of social acceptance in
the waste domain. Figure 7 shows eight groups of potential factors that underpin overall community
attitudes towards the waste sector, referred to as social acceptance of the sector. These factors work
together to shape people’s overall level of acceptance, with some factors more important than others.
The research findings from this current study will identify and expand upon the most important factors
and the relationships between them. This is achieved through statistical modelling of the results to
come up with a model to describe the underlying components contributing to social acceptance of the
waste sector. This model provides opportunities for decision makers to focus their programs and
initiatives and to gauge the likely effectiveness of one initiative over another through understanding the
importance of the factor that the intervention is targeting.

Figure 7 Drivers of social acceptance in the waste domain

                                                                      IMPACTS TO
                                             TRUST IN THE SECTOR
                                                                       WELLBEING
                                             In government, local
                                                                     Social Economic
                                             council, the operator
                                                                      Environmental
                            QUALITY OF                                                  BENEFITS TO
                           RELATIONSHIPS                                                 WELLBEING
                           Responsiveness                                              Social Economic
                           Contact quality                                              Environmental

          FAIRNESS AND
             EQUITY                                                                                      ATTITUDES ABOUT
                                                                                                              Waste
            Distributive
                                                                                                          Reflected in waste
             Personal
                                                                                                         reducing behaviours
            Procedural

    GOVERNANCE
                                                                                                                  KNOWLEDGE
    Regulation and
                                                                                                                   Awareness
     compliance                                           Acceptance                                            Knowledge of the
  Planning and vision
                                                                                                                  WRR system
    Collaboration
2 Method: How we conducted the research
SURVEY PROCEDURE
An online survey about Victorian attitudes to waste and the waste and resource recovery sector was
conducted in June 2016 and repeated in March‐April 2019. In both years, the survey used a
representative sample of Victorian residents from a research panel administered by the Online Research
Unit (ORU). The survey instrument was similar in both years and took 15 ‐20 minutes to complete on
average.
The study was conducted in accordance with the ethical review processes of CSIRO and within the
guidelines of the National Statement on Ethical Conduct in Human Research.
Figure 8 shows, the survey proceeded in three sections and used a scenario.
Figure 8 Survey procedure
SECTION 1 SECTION 2 SECTION 3
Current knowledge, Scenarios with information Demographic questions
awareness, attitude, and followed by perceptions and including self‐identifying as
behaviour questions social acceptance questions impacted or non‐impacted
SURVEY SAMPLE
In 2019, the sample comprised 1,244 residents from across Victoria, which was similar to the previous
2016 sample of 1,212 residents. Participants were a minimum of 18 years old and considered to be
representative of Victoria based on ABS (2016) statistics for age, sex, and geography. Table 1 shows the
sample profile for 2019 and 2016 and the ABS census data.
Table 1 Sample profile: Age, gender, geography: 2016 and 2019
Variable Sample profile Sample profile ABS census
2016 2019 2016
Aged 18 – 34 29.2% 29.6% 30.3%
Aged 35 – 54 38.0% 32.9% 34.4%
Aged 55+ 32.8% 37.5% 35.3%
Male 50.6% 48.4% 49.9%
Female 49.8% 51.5% 51.1%
Indeterminate/Intersex/Unspecified 0.2% n.a.
Metropolitan Melbourne 79.0% 68.5% 75.8%1
Regional Victoria 21.0% 31.5% 24.2%2
Note: n.a. = not asked in 2016 census, though will be asked in the 2021 census
1
Melbourne Greater Capital City Statistical area as a percentage of the total Victorian population in June 2015
2
Total Victorian population outside the Melbourne Greater Capital City Statistical Area in June 2015
Report Milestone 4| engaging communities on waste| August 2019|19SAMPLE DESIGN
To ensure the survey measured attitudes that reflected both the views of those who felt impacted by
waste and resource recovery activity as well as the broader Victorian population, two sampling
strategies were employed in both 2016 and 2019.
1. Victorians in targeted postcodes (n = 610 in 2016, n = 610 in 2019)
‐ Residents were randomly selected from postcodes within a 2km radius of infrastructure listed on
the ‘Existing hubs of state importance’ as detailed in the Statewide Waste and Resource Recovery
Infrastructure Plan: Victoria 2015‐44 (Sustainability Victoria, 2015).
‐ Postcodes with more than 20 registered complaints or ‘Pollution Reports’ registered with the
Environment Protection Authority about waste or waste management issues in 2016 were also
included. These same postcodes were also targeted in 2019.
2. Victorians in other postcodes (n = 602 in 2016, n = 634 in 2019)
‐ Residents were randomly selected across the remaining postcodes in urban and regional
Victoria.
Impacted respondents
In 2019, the sampling design resulted in approximately half the sample indicating they felt negatively
impacted by a waste and resource recovery facility near their home. These facilities included any of the
following: a transfer station; a landfill or tip; an organic processing or composting facility; or any other
type of waste or resource recovery facility.
The size of the ‘impacted’ sample had increased significantly from the previous survey when 24% felt
impacted in 2016. This may relate to an increased salience of waste and resource recovery site incidents
in 2019.
2019 Sample
50 % identified as Impacted residents ‐ (n = 626), stating they were negatively affected by one
or more different types of waste and resource recovery facilities
50 % identified as Non‐impacted residents ‐ (n = 618) stating they were not affected by waste
and resource recovery infrastructure
Total respondents (N = 1,244)SURVEY QUESTIONS AND FORMAT
The surveys in 2016 and 2019 were essentially the same. However, the survey for 2019 included some
additional attitudinal and waste to energy questions.
The survey covered three main sections and comprised 134 questions (items) in 2016 and 172 in 2019.
SECTION 1: Knowledge, attitude, and behaviour questions
General attitudes about waste and resource recovery – essentialness of service, shared
responsibility, efficacy beliefs (self and collective), social influences
Self‐reported waste reducing behaviour
Knowledge of the waste sector, including additional questions in 2019 about waste to energy
See Appendix D for a more detailed description of the survey items.
SECTION 2: Scenarios with background information followed by perceptions and social acceptance
questions
Perceived impacts
Perceived benefits
Perceived fairness and equity
Trust
Quality of relationships
Procedural fairness
Governance
Community acceptance
See Appendix C (Social Acceptance and Perceptions of Waste and Resource Recovery Facilities) for a
more detailed description of the survey items.
SECTION 3: Demographics questions
Age / Gender / Income / Education / working status, plus household size and dwelling type in
2019
Geographic location (postcode)
Impacted by current waste and resource recovery infrastructure
The survey questions were developed in earlier research, which explored community expectations and
perceptions of the Waste and Resource Recovery sector (Walton, Jeanneret, McCrea, Lacey, & Moffat,
2016). The survey was also informed by previous research conducted by CSIRO on the social licence to
operate in mining and coal seam gas industries (Moffat & Zhang, 2014; Moffat, Zhang, & Boughen, 2014;
Williams & Walton, 2013).
Report Milestone 4| engaging communities on waste| August 2019|21SCENARIOS USED IN THE SURVEY
In the second half of the survey design, scenarios were used to measure residents’ perceptions and
attitudes of the waste and resource recovery sectors. Scenarios are used as a way of creating a common
level of understanding and to ensure that respondents are answering questions in relation to a common
stimulus or situation. The same scenario was used in both the 2019 and 2016 surveys, though in 2019
half the sample were given a waste to energy scenario.
‐ In 2016, all respondents answered attitude and perception questions in relation to living near a
waste and resource recovery complex.
‐ In 2019, respondents were randomly allocated to answer questions about one of two different
scenarios:
1. Living near a waste and resource recovery complex (n=621)
2. Living near a waste to energy plant (n=623)
DATA ANALYSIS AND REPORTING RESULTS
To analyse the data, t‐tests and Analysis of Variance (ANOVA) were used to test for differences among
question responses and between sample groups. Multiple regression was used to predict waste
reducing behaviours, and a path analysis was also used to test the acceptance models.
All results described as ‘significant’ refer to a statistical significance. The p‐value used for significance
varied based on the size of the comparison groups.
Using varying p levels avoids over reporting very small differences between groups detectable because
the sample size is large. Thus the p‐values for statistical significance varied between p < .001 for the
larger sample size groups and p < .05 for the smaller sample sizes. We have purposefully kept the
reporting of statistical tests to a minimum within the document, so that it is easier to read, and have
rounded mean scores to one decimal point and percentages to whole numbers in most graphs.Results
3 Knowledge and attitudes about waste and recycling
3.1 Knowledge levels of the waste and resource recovery system
In 2019, residents felt they knew significantly more about landfills and the use of recycled materials in
new products compared to 2016 (p < .001). People’s knowledge of the household waste and collection
services was good; however, their knowledge about the overall waste and resource recovery system was
low, especially knowledge about ‘waste to energy’ production. Self‐rated knowledge of ‘waste to
energy’ production was statistically significantly less than other aspects of the waste and resource
recovery system.
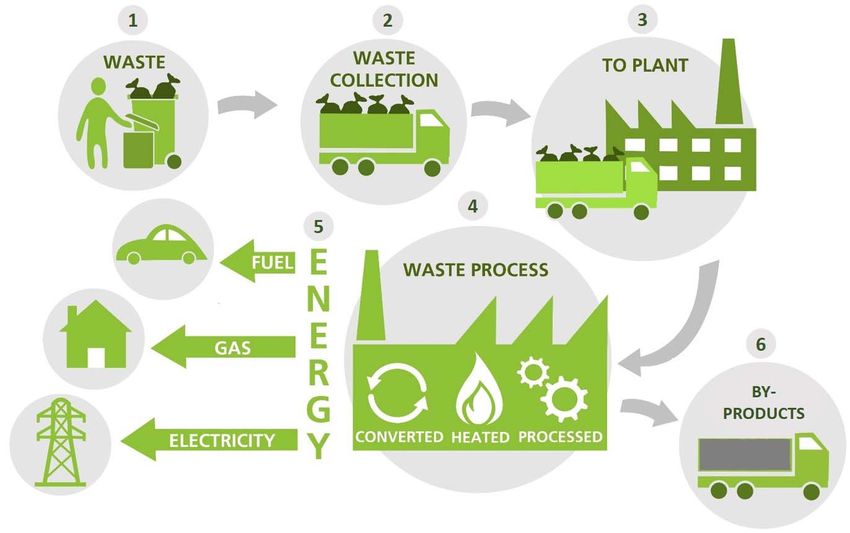
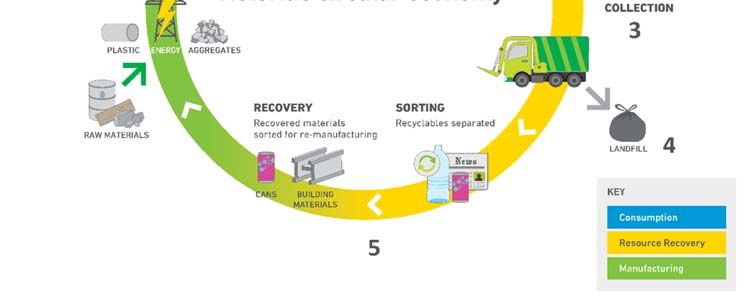
For the knowledge questions, respondents were asked to self‐rate their knowledge about six main
components of the waste and resource recovery system after being given a diagram and brief
explanation of each component (see Appendix A ).
Figure 9 shows the average knowledge scores for each component of the system, where 1 = no
knowledge, 3 = some knowledge and 5 = a lot of knowledge.
Figure 9 Self‐rated knowledge scores: 2016 and 2019
3.5
Household waste collection services
3.4
3.1
The sorting, recycling and recovery of materials
3.0
3.0 2019
Landfill services or tips *
2.8
3.0 2016
The use of recycled materials in new products *
2.8
2.8
The overall waste and resource recovery system
2.7
2.5
‘Waste to energy’ production #
1 2 3 4 5
Self rated knowledge
Note: 1 = No knowledge; 3 = some knowledge; 5 = A lot of knowledge
*significant difference between years; # significantly lower than other items (p3.2 Attitudes
3.2.1 General views about the waste hierarchy
The waste hierarchy represents the preferred options for sustainably managing society’s waste and is
used internationally and nationally to guide policy direction. Respondents were asked to rank each of
the five waste management solutions from the best through to worst solution that they preferred for
managing waste.
As shown in Figure 10, almost 75% of residents thought that landfills were the worst option for
managing waste, while 45% of people thought avoidance of waste was the best option. Approximately
80% of residents ranked reusing and recycling waste materials in their top three options for managing
waste. Finally, up to 40% of residents ranked waste to energy as their least two preferred options.
Figure 10 Views about the waste hierarchy as the best options for managing waste: 2019
100%
90%
80%
Percentage of participants
70%
Best option
60%
2nd best
50%
3rd best
40%
4th best
30%
Worst option
20%
10%
0%
Avoid the Reuse materials ‐ Recycle waste ‐ Recover energy ‐ Dispose of waste
generation of without additional using waste in by using residual into landfills
waste processing other processes waste to generate
energy
3.2.2 General views about the sector
Essentialness of the service
Respondents were provided with the definition of an essential service as “a service that is a basic right
for the community, and any failure to deliver it results in risks to the community”. Respondents were
then asked how much they agreed waste and resource recovery services were essential services, along
with rating a range of other services. Figure 11 shows the average rating for each service.
As in 2016, waste management and resource recovery services were ranked fifth in essential services. A
similar order of essential services were evident in 2019, except for public transport ranking higher in
2019 than road repairs and maintenance.In general, all services were seen as slightly less essential in 2019 than in 2016 though these differences
were not statistically significantly different.
Figure 11 Perceived essentialness of various services: 2016 and 2019
2019 2016
Ambulance, fire and police services* 4.6
4.7
Hospital and health services* 4.6
4.7
Water and sewage services* 4.5
4.6
Electricity and gas services 4.4
4.5
Waste management and resource recovery 4.3
services* 4.4
Public transport services* 4.2
4.3
Road repairs and maintenance 4.2
4.4
Mobile and phone services* 3.9
4.0
1 2 3 4 5
Note: 1 = Strongly disagree; 5 = Strongly agree Essentialness of services
* significantly different between years (p < .001)
3.2.3 Beliefs about waste generation
Contributors to waste
Respondents were asked to identify how much they believed the different producers of waste each
contributed to total waste generation, using a scale where 1 = not much of the total waste to 5 = most
of the total waste. The three sectors of waste producers were:
‐ Household waste (including garbage, recyclables and organic waste)
‐ Commercial waste (including food and other retailers, accommodation and other service providers,
public sectors and educational institutions)
‐ Industrial, construction and demolition waste (including manufacturing, housing, civil, and commercial
projects)
Figure 12 shows that residents thought household waste contributed less than the other two sectors
and this pattern remained the same in 2019 as in 2016. The mean scores were all over 3, which shows
that residents see all three sectors as large contributors on average (see bar heights). There were no
statistically significant difference in these beliefs between 2019 and 2016.
Report Milestone 4| engaging communities on waste| August 2019|25Figure 12 Beliefs about sectors contributing to total waste: 2016 and 2019
2016 2019
5
Contribution to total waste
3.88 3.86 3.91 3.89
4 3.68 3.76
3
2
1
Household waste * Commercial waste Industrial, construction and
demolition waste
Sector
Note: 1 = not much of the total waste to 5 = most of the total waste; * in both 2016 and 2019, household waste perceveid to be significantly
less contributors than other sectors; no significant differences between years (p3.2.5 Beliefs about recycling
Beliefs about amounts of recycling being recycled
In 2019, residents were asked for the first time what percentage of items in kerbside recycling bins they
thought were being recycled into new products. Figure 14 shows that 20% of residents believed that
only 0 to 10 percent of items in kerbside recycling bins were recycled into new products; and 75% of
respondents believed that less than half of kerbside recycling was being recycled into new products, as
shown by the cumulative percentage line in Figure 14.
In its Victorian Local Government Waste Services Report 2016‐17, the Victorian government estimated
the actual amount of recycling items processed or recycled into new products was over 90%, though
only 3% of people in this survey believed this to be the case, as shown in Figure 14.
Figure 14 Percentage of items in kerbside recycling bins believed to be recycled into new products: 2019
25% 75%
70%
20% % of residents
Percentage of residents
Cumulative percentage
20% 60%
58% 17% Cumulative %
15% 49% 50%
15% 14%
40%
35%
10% 9% 8% 30%
7%
20% 5% 20%
5% 3%
2% 10%
0% 0%
0‐10% 11‐20% 21‐30% 31‐40% 41‐50% 51‐60% 61‐70% 71‐80% 81‐90% 91‐100%
Percentage of items believed to be recycled
Beliefs about recycling management and outcomes
In 2019, residents were also asked about other beliefs regarding how recycling is managed and its
outcomes. As shown in Figure 15, the most common belief was that local recycling was going to landfill,
which was significantly higher than the other beliefs about local recycling.
Residents also agreed on average that local recycling was going overseas to be recycled more than they
believed it was being recycled in Australia. Residents also believed that local recycling material could be
cleaned to a high standard, though were not as confident that it could be effectively sorted.
Report Milestone 4| engaging communities on waste| August 2019|27You can also read