Government evidence to the - STRB The 2018 pay award February 2018
←
→
Page content transcription
If your browser does not render page correctly, please read the page content below
Government
evidence to the
STRB
The 2018 pay award

February 2018
Contents
Summary                                                     4
General Economic Outlook                                    6
  Introduction                                              6

  Public Finances                                           6

  Labour Market                                             7

  Public Sector Pay and Pensions                            9

  Conclusion                                                10

Affordability in schools                                    12
Maintaining a supply of high quality teachers and leaders   16
  Teacher Recruitment and Retention                         16

  School Leaders                                            21

Applying the 2018 pay award                                 23
Annex A: Affordability in schools                           24
  Funding for schools in England                            24

  School budgets in Wales                                   24

Annex B: The teacher labour market                          26
  The teaching workforce                                    26

  Classroom teacher salaries                                28

  Use of allowances                                         33

  Vacancies                                                 37

  Demand                                                    43

  Vacancies and demand in Wales                             44

Annex C: Recruitment to teacher training                    45
  ITT allocations 2017/18                                   47

  The quality of new recruits 2017/18                       49

  Bursaries and scholarships                                49

  School-based ITT                                          52

                                           2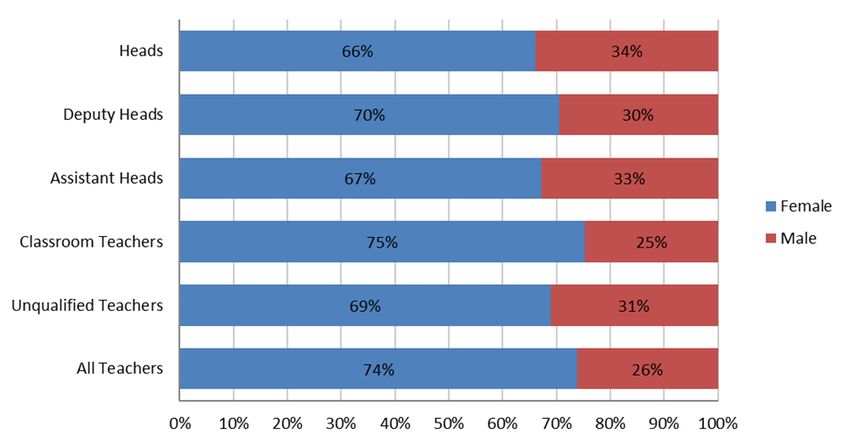
Teacher recruitment and training in Wales   54

Annex D: School leaders                       58
  Salaries of school leaders                  58

  Age                                         59

  Headship vacancies                          60

  Leadership supply in Wales                  60

                                        3
Summary
1. The then Secretary of State wrote to Dr Patricia Rice, the Chair of the School
Teachers’ Review Body (STRB), on the 7th December, asking for the STRB’s
recommendations on the September 2018 pay award.
2. The letter emphasised that the government recognises that in some parts of
the public sector, particularly in areas of skill shortage, a more flexible
approach to pay may be required but there is still a need for pay discipline to
ensure the affordability of public services.
3. The remit letter emphasised the importance of focusing on how the pay award
can best address recruitment and retention challenges and encourage high
quality entrants to join the profession and support their progression within the
workforce, while remaining within the bounds of affordability. The letter asked
for recommendations on:
• What adjustments should be made to the salary and allowance ranges for
classroom teachers, unqualified teachers and school leaders to promote
recruitment and retention.
4. This document provides the Secretary of State’s evidence to support the
STRB’s consideration of the 2018 pay award for teachers and school leaders.
It includes evidence on the teacher labour market, based on the latest
recruitment and retention data, and on affordability.
5. On affordability, the evidence sets out the need for the STRB to consider the
pay award in the context of the transition to the National Funding Formula and
the cost pressures faced by schools and headroom available for increases in
teachers’ pay. The evidence makes clear that affordability at a school level
will vary from the national picture and that uplifts to the statutory salary and
allowance ranges need to be considered in relation to an opportunity cost of
reduced flexibility for schools to invest money elsewhere.
6. The evidence makes clear that while we are recruiting the teachers we need
at a national level, we recognise this is a challenge, particularly in some
subjects and for some schools, not least in the context of an improving
economy and a strengthening graduate labour market.
7. For school leaders, the evidence shows a strong overall recruitment and
retention context, with a fall in the proportion of schools reporting a
headteacher vacancy or the headteacher post being temporarily filled between
2010-2016. This is supported by the pay system, which gives schools the
flexibility to reward exceptional leaders and to attract strong leadership teams
to work in the most challenging schools.
48. The STRB will want to carefully consider this evidence and how it can best
target the pay award to support schools with recruitment and retention in this
context.
5General Economic Outlook
Introduction
9. The economic and fiscal context in which the Pay Review Bodies (PRBs) will
make their recommendations was set out in detail in the November 2017
Budget. However, as in previous years, this chapter summarises points that
may be of particular relevance to the pay review process, notably the latest
Office for Budget Responsibility (OBR) projections for the economy, and
recent trends in the labour market, both in the public and the private sector.
This should be considered alongside the rest of this evidence when making
recommendations.
10. In 2017 the Government adopted a more flexible approach to public sector
pay, to address areas of skills shortages and in return for improvements to
public sector productivity. The Government will continue to ensure that the
overall package for public sector workers is fair to them and ensures that we
can deliver world class public services, while also being affordable within the
public finances and fair to taxpayers as a whole. This makes it all the more
important that Pay Review Bodies continue to consider affordability, alongside
wider economic circumstances, when making their recommendations.
Public Finances
11. As usual, it is important that the PRBs take into account the wider fiscal
context when making their recommendations. As set out in the November
Budget, the UK economy has demonstrated its resilience. Gross Domestic
Product (GDP) has grown continuously for 19 quarters and employment has
risen by 3 million since 2010 to a near record high. However, over the last
year business investment has been affected by uncertainty, and productivity -
the ultimate driver of wage growth - has been subdued. Productivity growth
has slowed across all advanced economies since the financial crisis, but it has
slowed more in the UK than elsewhere. The OBR has revised down
expectations for productivity growth over the forecast period compared to
Spring Budget 2017.
12. The government has made significant progress since 2010 in restoring the
public finances to health. The deficit has been reduced by three quarters from
a post war high of 9.9% of GDP in 2009 10 to 2.3% in 2016 17, its lowest level
since before the financial crisis. Despite these improvements, borrowing and
debt remain too high. The OBR forecast debt will peak at 86.5 % of GDP in
2017 18, the highest it has been in 50 years. In order to ensure the UK’s
economic resilience, improve fiscal sustainability, and lessen the burden on
future generations, borrowing needs to be reduced further.
613. The fiscal rules approved by Parliament in January 2017 commit the
government to reducing the cyclically adjusted deficit to below 2% of GDP by
2020 21 and having debt as a share of GDP falling in 2020 21. These rules
will guide the UK towards a balanced budget by the middle of the next
decade. The OBR forecasts that the government will meet both its fiscal
targets, and that borrowing will reach its lowest level since 2001 02 by the end
of the forecast period. Debt as a share of GDP is forecast to fall next year and
in every year of the forecast. These targets will require ongoing discipline in
public spending,
14. Public Sector pay currently accounts for around £1 in every £4 spent by the
government and the public sector pay bill figure for 2016/17 is £179.41bn, up
from £173.19bn in 2015/16. Public sector pay policy necessarily plays an
important role in controlling public spending.
15. Departments are also facing longer-term pressures. The OBR’s Fiscal
Sustainability report highlighted the significant impact that demographic
changes are likely to have on the public finances. Discipline in public spending
remains central to achieving the government’s fiscal targets. The last
Spending Review budgeted for one per cent average basic pay awards, in
addition to progression pay for specific workforces, and there will still be a
need for pay discipline over the coming years to ensure the affordability of the
public service and the sustainability of public sector employment.
16. This makes it ever more important to ensure that our pay bill spending delivers
maximum value for money. Between 2010 and 2016, public service
productivity increased by 3%, an average of 0.5% per year. But although
public service productivity has improved, further improvements are vital in
order to deliver government objectives and meet rising demand. In its
response to the PRBs Government will consider where pay awards can be
agreed in return for improvements to public sector productivity, which also
plays an important role in the UK’s productivity growth overall.
Labour Market
17. The UK labour market necessarily forms an important backdrop to the PRB
process. The OBR forecast that the number of people in employment will
continue to increase to 32.7 million in 2022. The unemployment rate is
forecast to increase slightly over the forecast horizon as it returns to the
OBR’s new estimate of its equilibrium rate, remaining at 4.6% from 2020
onwards.
18. Despite the continued strength of the labour market, weak growth in labour
productivity has been weighing down on wages and, ultimately, the public
finances. As set out in the November 2017 Economic and Fiscal Outlook, the
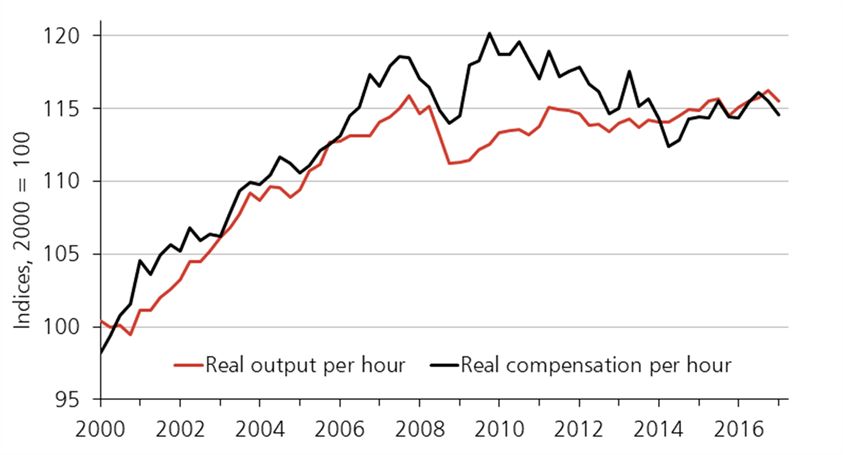
7OBR expects productivity to remain flat in 2017, before increasing 0.9% in
2018 and 1.0% in 2019. Productivity growth is then forecast to increase to
1.3% in later years. This compares to the Spring Budget 2017 forecast of
1.7% on average over the forecast period.
Figure 1: Real output per hour and real consumption per hour, year on year growth (ONS
November 2017)
19. With a lower forecast for productivity growth the OBR expects average
earnings growth of 2.3% in 2017, 2018 and 2019. It then increases to 2.6% in
2020, 3.0% in 2021 and 3.1% in 2022. A pickup in productivity is vital for the
recovery of cross-economy wage growth rates to pre-recession levels. Public
and private sector wages tend to move in similar directions, both because of
pay expectations and the implications of tax receipts on public sector budgets.
The £31 billion National Productivity Investment Fund and our Industrial
Strategy will help to boost productivity and earning power throughout the UK.
20. We recognise that higher inflation is putting pressure on all households as well
as our hardworking public servants. But historically the relationship between
pay and inflation has been a weak one, in part due to the temporary nature of
many inflation fluctuations. Most forecasters expect this period of above target
inflation to be temporary, as inflation has been pushed above the target by the
boost to import prices that had resulted from the past depreciation of sterling .
The OBR and the Bank of England both expect inflation to peak at the end of
this year and then fall again over 2018 and 2019. The appropriate level of
public sector pay award is complex and determined by a variety of factors,
notably retention and recruitment. Rates of price inflation are important, but
not the only consideration.
8Figure 2: Whole economy average earnings growth and inflation (ONS November 2017)
Public Sector Pay and Pensions
21. Specific evidence on the pay of teachers is presented elsewhere in this
document. However, wider trends in pay and remuneration are also relevant.
Following the last recession, public sector wages did not undergo the sharp
fall seen in the private sector, and have since grown at a slower pace than
private sector wages: for the three months to October 2017 private sector total
pay grew by 2.7% on the same period the previous year, compared to 1.8% in
the public sector (excluding financial services). However, the overall
remuneration of public sector employees when taking employer pension
contributions into account remains at a significant premium, as seen in figure
3 below.
9Figure 3: Percentage public sector pay premium, hourly pay for all employees, controlling for
personal characteristics (ONS ASHE)
22. When considering changes to remuneration, PRBs should take account of the
total reward package. Public service pension schemes continue to be
amongst the best available and significantly above the average value of
pension provision in the private sector. Around 17% of active occupational
pensions scheme membership in the private sector is in defined benefit (DB)
schemes, with the vast majority in defined contribution (DC) schemes. In
contrast, over 95% of active members in the public sector are in DB
arrangements.
23. In April 2016, the National Living Wage was introduced at £7.20 for workers
aged 25 and over (increased to £7.50 an hour in April 2017, and will increase
to £7.83 in April 2018). The introduction of the NLW marked an increase in
pay for over a million workers across the UK labour market, including in the
public sector. Estimates indicate that approximately 53,000 public sector
workers were paid the NLW in 2017. In 2018-19, 1.2 million people on low
incomes across the economy will have been taken out of income tax
altogether (compared to 2015-16), and a typical taxpayer will pay £1,075 less
income tax, compared to 2010-11. Overall, since 2015, we have cut income
tax for 31 million people, while freezing fuel and alcohol duty.
Conclusion
24. This chapter summarises the economic and fiscal evidence which is likely to
be relevant to the recommendations of the PRBs. This is intended to inform
their usual consideration of the affordability of specific pay awards, on top of
the workforce specific evidence presented elsewhere in this document.
1025. Much of the evidence presented here will feed into retention and recruitment
across public sector workforces. Retention and recruitment will vary
considerably across geographies, specialisms and grades, where public
sector workers face different labour market structures. We would welcome
specific comment and analysis from the PRBs on any trends and how pay
systems could help address these issues.
11Affordability in schools
26. Following the Chief Secretary to the Treasury’s letter to the chair of the STRB
on 21 September, the government has recognised the need for increased
flexibility in its approach to public sector pay and it is no longer the case that
the STRB is being asked to frame its recommendations within the context of a
maximum 1% average pay award. However, it is clear that affordability and
value for money continue to be key considerations for the STRB in making
recommendations on the 2018 teachers’ pay award.
27. In July, we announced an additional £1.3 billion for schools and high needs
across the next two years, over and above the schools budget set at Spending
Review 2015.
28. As a result of this investment, core funding for schools and high needs will rise
from almost £41.0 billion in 2017-18 to £42.4 billion in 2018-19. In 2019-20 it
will rise again to £43.5 billion. The core schools and high needs budget will
therefore increase by £2.6 billion between 2017-18 and 2019-20, maintaining
the schools and high needs blocks of the dedicated schools grant (DSG) in
real terms per pupil up to 2019-20. Spending plans beyond 2019-20 will be set
out in a future Spending Review.
29. This investment has allowed us to deliver a national funding formula for
schools that provides for a minimum cash increase in funding for all schools of
0.5% per pupil in 2018-19, and 1% by 2019-20 compared to their baselines.
Under the national funding formula, schools will attract £2,747, £3,863, and
£4,386 for each primary, key stage three and key stage four student
respectively. All schools will also attract a lump sum of £110,000. Schools will
attract further funding based on their specific characteristics for additional
needs (deprivation, low prior attainment, English as an additional language
and mobility) and school-level characteristics (sparsity and premises costs).
The formula includes a minimum per-pupil funding level, in 2019-20, of £4,800
for every secondary school and £3,500 per pupil for every primary school. In
2018-19, as a step towards these minimum funding levels, secondary schools
will attract at least £4,600, and primary schools £3,300. Gains will be capped
at 3% per pupil in 2018-19 and a further 3% per pupil in 2019-20.
30. To provide stability for schools through the transition to the national funding
formula, each local authority will continue to set a local formula which will
determine individual schools’ budgets in their areas, in 2018-19 and 2019-20,
in consultation with local schools. This means that the school-level allocations
used within the national funding formula are notional allocations which we will
use to set the total funding available for schools in each area. Schools’ final
12actual funding allocations for 2018-19 and 2019-20 will be based on that local
formula agreed in their area by the local authority. 1
31. At a national level, we have estimated the pressures schools will face on their
budgets from spend which is not on teachers’ pay, including non-pay inflation
and the effect of increases in the National Living Wage and National Minimum
Wage. These pressures come to 0.3% and 0.4% of overall expenditure in
2018-19 and 2019-20 respectively. We assume the costs associated with
staffing numbers will increase in line with published figures from the Teacher
Supply Model , driven by increases in pupil numbers. That means that
nationally and overall, costs could rise a further 2.2% and 1.4% in 2018-19
and 2019-20 respectively before schools would face real terms pressures.
This represents a theoretical absolute upper bound to the impact on schools’
budgets above which increases in teachers’ and school support staff’s pay
would lead to real terms per pupil pressures for schools. Whilst these figures
are calculated and expressed on the basis of financial years, the STRB will
appreciate that its recommendations will affect teachers’ pay for the 18/19
academic year, and therefore overlap between the 18-19 and 19-20 financial
years. It is therefore important to consider the affordability of increases in
teachers’ pay in 2018 on both the 2018-19 and 2019-20 financial
years. Details of the pressures schools will face in both years are available.
32. The overall rise in average pay is determined by individual teachers’
progression and changes in the composition of the workforce, both larger in
magnitude than the rise the STRB makes to the pay range maxima and
minima. Pay rises for teachers in service in consecutive years averaged 4.6%
last year 2, most of that progression concentrated on younger, early-career
teachers who receive pay rises of around 8% as they move up the main pay
scale. Meanwhile, a smaller composition effect - the net effect of older, higher-
earning teachers leaving and younger teachers joining the profession – put a
downward pressure on wages of 2.3%. These are the result of choices
schools make – within the constraints of their local teacher labour market –
regarding the composition of their workforces and the progression they offer
their teachers. While this is an intended consequence of flexibility, it creates
uncertainty regarding the overall pay rise which is determined by the
interaction of the progression effect, the composition effect and the STRB’s
award.
33. However, there are a wide range of other activities and priorities schools could
choose to spend money on. Teachers’ pay is the single largest item in a
school budget and typically represents around 50% of school expenditure. As
such, schools will need to consider teachers’ pay against other important
1
Further information on the NFF is available here.
2
Teacher Analysis Compendium 2
13priorities, such as school improvement, teacher CPD, pastoral support and
teaching resources. It is therefore not the case that any money which our
modelling currently shows to be theoretically ‘uncommitted’ can be considered
to be fully available to fund teachers’ pay increases arising from STRB
recommendations. Whilst the government provides advice and support for
schools to make the most efficient use of their funding, including an improved
benchmarking service for them to compare spend against other, similar
schools, it is for schools themselves to take decisions about how best to
allocate their resources. The current teacher pay framework provides schools
with the flexibility to balance these competing demands within their budget
and to prioritise teachers’ pay, if that is the best use of their resources locally.
The STRB will therefore want to consider the value for money of uplifts to the
statutory salary and allowance ranges against an opportunity cost of reduced
flexibility for individual schools to make decisions to spend this money
elsewhere, if that would be most effective in educating pupils.
34. It is also important to recognise that affordability at a school level will vary
from the national picture. As outlined earlier, the introduction of the National
Funding Formula will provide for up to 6% gains per pupil for underfunded
schools by 2019-20, and, as a minimum, a 0.5% per pupil cash increase in
2018-19, and a 1% increase by 2019-20 compared to their baselines. If every
school was to receive the notional National Funding Formula allocation for
2018-19 published in September, 32% would receive a per pupil budget
increase of more than 2.5%; 22% between 1.5% and 2.5%; and 46% of up to
1.5%. However, while the total sum to be delegated to schools in each local
area will, for the first time, be ring-fenced, local authorities have the flexibility
to transfer up to 0.5% of the schools budget to other education spending (for
example, spending on high needs) with the agreement of the local schools
forum. Local authorities will also continue to set a local formula which will
determine individual schools’ budgets in their areas, in 2018-19 and 2019-20,
in consultation with local schools, and have the ability to diverge from the
national formula if they believe that will help to smooth the transition, or to take
account of specific local circumstances. This means that at a school level, the
affordability of increases in teachers’ pay will be affected by their future
funding trajectory – which will vary from school to school. The deadline for
local authorities to set local formulae for 2018-19 is 28 February 2017, and we
will provide further information on individual schools’ budgets for the coming
year in due course.
35. In Wales gross schools’ expenditure is budgeted to be £2.543 billion in 2017-
18. 3 The funding delegated to schools in 2017-18 is budgeted to be
3
The Welsh schools budget for 2018-19 has not yet been agreed.
14£2.142billion. Further details on school budgets in Wales can be found in
Annex A.
36. Further evidence about affordability in schools is provided in Annex A.
15Maintaining a supply of high quality teachers and
leaders
Teacher Recruitment and Retention
Teacher Recruitment
37. At a national level, we are recruiting the teachers we need. However, we
recognise that teacher recruitment has been a challenge, particularly in some
subjects and for some schools, not least in the context of an improving
economy and a strengthening graduate labour market.
38. We have more teachers in our schools than ever before and the number of
teachers has kept pace with changing numbers of pupils. There are more than
457,000 teachers in state-funded schools throughout England – 15,500 more
than 2010. The number of full time equivalent (FTE) teachers increased by
3.5% between November 2011 and November 2016. The majority of the
increase was in the primary sector, in part due to the growing number of
younger pupils.
39. Teacher vacancy rates have remained low and relatively stable (at around
0.3% or below of all teaching posts) since 2010, and teaching continues to be
an attractive profession for high quality graduates.
40. There were 27,895 new entrants to postgraduate ITT courses in the academic
year 2017/18. Overall, this meant that we reached 90% of our target for
postgraduate trainee recruitment. In the 2017/18 academic year we met 80%
of our total secondary recruitment target, and in primary we recruited 106% of
our recruitment target.
41. ITT performance profiles for 2015/16 (the latest available) show that 95% of
the 2015/16 cohort were in a teaching post within six months of being
awarded QTS, although this figure excludes the trainees for whom information
is not known.
42. The latest figures also show the number of former teachers coming back to
the classroom has risen significantly – from 13,090 FTEs in 2011 to 14,200
FTEs in 2016. 4
43. Further information on recruitment figures can be found at Annex C.
4
School Workforce Census 2016
16Teacher Retention
44. Official statistics 5 show that after gaining QTS and starting teaching, around
70% of teachers teach in state-funded schools for at least five years; 60% for
at least ten years; 50% teach for at least 20 years. These retention rates have
been broadly similar for the last 20 years, as can be seen in table 8 in Annex
B, which shows retention rates by year of QTS.
45. There has been an increase in teacher movements between schools.
Recruitment activity generated by movements between schools now makes
up more of the entrants to schools than the next largest source – NQTs. DfE
published new analysis of schools workforce trends between 2010-2015 in
September 2016. 6
46. Recent analysis by the department 7 found that the probability of leaving the
profession is highest in the first five years of a teacher’s career and falls after
that. This analysis also found that retention varied by teacher’s contract
status, with higher retention rates for those with a permanent contract, and by
region, with retention rates higher outside London. Similarly recent analysis by
the NFER 8 found that system-level retention is more challenging in certain
subjects, particularly science and modern foreign languages, and in certain
areas, particularly London and other large cities. This analysis, in common
with the department’s, found that the probability of a teacher leaving the
profession decreases as their number of years of experience increases.
These retention rates have been broadly similar for the last 20 years.
47. We are actively addressing the issues that teachers cite as reasons for
leaving the profession, for example by supporting schools to reduce
unnecessary workload and improving behaviour management training for new
teachers. Our plans to strengthen Qualified Teacher Status (QTS), discussed
further in paragraph 65, will also support early career retention by ensuring a
strong link between high-quality initial training and effective ongoing
professional development.
48. We know flexible working policies can help to recruit, retain and motivate
teachers. The then Secretary of State hosted a summit on flexible working on
30 October 2017 to support school leaders to provide staff with greater
opportunities for flexible working. The outcomes of the summit were over 60
pledges, made on behalf of the Department, and those present, to take
concrete action to increase the opportunities for flexible working in schools.
5
Schools Workforce Census 2016 – table 8
6
Local analysis of teacher workforce: 2010 to 2015
7
Teachers Analysis Compendium 1
8
NFER research report on teacher retention
17These pledges were published on the flexible working pages on Gov.uk on 11
December 2017.
49. The fundamental changes to teachers’ pay that have been introduced over the
last four years following the STRB’s recommendations have given greater
autonomy to schools to decide how to reward their staff. Schools now have
much greater flexibility to decide what salary to offer to new teachers on
appointment, as well as greater freedom to decide how quickly their pay
progresses over time. This increased flexibility helps schools to attract and
retain the best teachers and to target any school-level recruitment and
retention problems they may have, including addressing teacher shortages in
specific subjects. Additional information on classroom teacher salaries can be
found at Annex B.
Teacher Quality and Routes into Teaching
50. We are focused on attracting more top graduates into the profession,
particularly in those core academic subjects that help children reach their
potential. We have announced a £30million investment in tailored support for
attracting more great teachers into some of the schools that struggle the most
with recruitment and retention.
51. The proportion of new entrants to postgraduate initial teacher training (ITT)
with degree classifications of 2:1 in 2017/18 was 74%, up from 63% in
2010/11. Nearly one in five teacher trainees had a first-class degree in
2017/18 (19%) – up from 17% in 2014/15, and 10% in 2010/11.
52. We have put a range of incentives in place – including training bursaries of up
to £26,000, scholarships of £28,000 and salary grants – to encourage more
top graduates and career changers to train to teach in priority English
Baccalaureate (EBacc) subjects. In addition, we have given schools the
opportunity to recruit and train graduates for teaching careers, giving them an
even greater degree of influence over selecting and training the teachers they
need. We are also piloting a new programme to reimburse student loan
repayments for teachers in the early years of their careers. Around 800 MFL
and 1,700 science teachers a year will be eligible for this pilot scheme.
53. For maths trainees we are offering a £20,000 bursary followed by two
additional early-career payments of £5000 each (£7500 if teaching in an area
of England that needs more great teachers) in their third and fifth year of
teaching, if they have taught in a state-funded school in England since
completing their teacher training course.
54. For the 2018-2019 recruitment cycle we are adopting a permissive approach
that removes recruitment constraints on School Direct lead schools and ITT
18providers in almost all subjects. 9 In a very small number of subjects, we have
set fixed allocations – in some cases by individual route – in order to
safeguard against oversupply. In these subjects, places have been allocated
at the start of the year, so that individual providers have certainty about the
number of trainees they can recruit in those subjects.
55. We have continued multiple year allocations for the top performing ITT
providers; a key recommendation from the National Audit Office’s review of
teacher training published last year. A list of ITT providers that have been
awarded multiple-year allocations was published on Thursday 26 October
alongside the multiple-year allocations methodology for 2018-2019. The
document can be found here.
56. The School Direct programme gives schools the opportunity to identify and
train talented people from their local graduate labour market. It offers schools
the chance to take greater control and attract, train and develop high quality
teachers and potential leaders. In 2017/18, 10,070 teachers began training
through School Direct.
57. The long-term viability of School Direct requires strong local partnerships to be
created and maintained, and the Government encourages schools to work in
broad and sustainable partnerships, particularly in areas where this is not yet
fully established. The School Direct salaried programme allows trainee
teachers to earn a salary as they train.
58. We have continued to accredit new school-led providers (SCITTs), of which
there are 177 in the 2017/18 academic year (compared to 172 in 2016/17 and
89 in 2010/11). 53% of all recruitment to postgraduate ITT starting in 2017/18
was to school-led routes, making it the third year for which more than half of
postgraduate ITT is school-led. This shows that schools have the appetite to
take charge of recruitment to the profession.
59. We will also continue to support the Teach First programme. The programme
is helping to recruit more teachers across England and place them in some of
the most challenging schools, including in Opportunity Areas. Since its
founding Teach First has trained over 10,000 teachers, with 1,300 starting in
England in 2017/18.
60. The quality of teaching is the single most important factor in driving up
standards in our schools. Providing the best possible training is at the heart of
the Government’s drive to improve teaching standards and ensure children
from all backgrounds have the opportunity to achieve academic excellence.
9
Allocation methodology for ITT places in the training year 2018-19 published 14 September 2017.
1961. Following Sir Andrew Carter’s review of the quality of Initial Teacher Training
(ITT) in 2014, the Government commissioned an independent working group
chaired by Stephen Munday CBE to develop a framework of core ITT content.
‘A Framework of core content for Initial Teacher Training’ published in July
2016 sets out clearly what all providers of ITT must require of their trainees
before they can be deemed to be meeting the Teachers’ Standards at the
level appropriate to the end of a period of initial teacher training. Post ITT we
are helping to ensure that teachers continue to access opportunities to
develop and improve their practice throughout their careers, through a range
of support.
62. An expert group of academics, headteachers and teachers produced the
Standard for teachers’ professional development, which was published by DfE
last year. This sets out the characteristics of the most effective professional
development, helping schools to identify the best and most appropriate CPD
for teachers.
63. The new Teaching and Leadership Innovation Fund (TLIF) will be providing
around £75m to improve the quality of teachers’ and leaders’ professional
development, through funding evidence-based projects which can deliver at
scale, particularly in the areas of the country that need it most. The first six
successful bidders were announced on 14 September including the Teacher
Development Trust, Teach First and the Institute of Physics. These will share
a fund worth almost £17million as part of the government’s drive to support
and spread great teaching.
64. The Government has also made available up to £5m to support the
establishment of the Chartered College of Teaching, which will focus on
helping teachers to access high quality professional development and to use
the evidence base on effective practice to inform their own teaching.
65. We believe there is more that we can do to help raise the status of the
teaching profession to take its place alongside other learned professions like
law and medicine. We therefore propose to strengthen Qualified Teacher
Status (QTS) to ensure a strong link between high-quality initial training and
effective ongoing professional development, with a view to ensuring that
teachers continue to develop and improve throughout their careers. The
department is currently consulting on these plans to strengthen QTS,
consultation details can be found here.
66. Further information on teacher quality and routes into teaching can be found
at Annex C.
20School Leaders
67. School workforce data from 2016 also shows that there are 69,500 FTE
headteachers, deputy headteachers and assistant headteachers in state
schools in England and that between 2010 and 2016 the proportion of schools
reporting a headteacher vacancy or the headteacher post being temporarily
filled decreased, from 1.4% to 1.1%. We recognise, however, that some
schools face recruitment challenges.
68. In 2014, new leadership pay arrangements were introduced to give schools
greater flexibility to attract headteachers. Schools are able to pay up to 25%
above the headteacher pay range, and even more in exceptional
circumstances. This gives schools greater flexibility to reward exceptional
headteachers and to attract strong leadership teams to work in the most
challenging schools.
69. We want to support the system to develop a strong and sustainable pipeline of
talented, motivated staff in leadership positions – people who are ready to
meet the challenges of today’s system. Working with top headteachers, MAT
CEOs and other sector experts, we have recently developed a reformed suite
of National Professional Qualifications (NPQs) to better prepare teachers for
the range of leadership roles in today’s school system. This includes a new
National Professional Qualification for Executive Leadership (NPQEL). 41
high-quality, accredited providers will be offering the reformed NPQs from
academic year 2017/2018 with details announced on Friday 20 October, click
here.
70. The Department has funded targeted programmes that aim to boost
leadership capacity in challenging schools. This includes the High Potential
Senior Leaders programme (currently delivered by Ambition Schools
Leadership), which develops aspiring headteachers who want to work in some
of the most challenging schools in the country, and the High Potential Middle
Leaders programme (also currently delivered by Ambition School Leadership),
which develops middle leaders in primary and secondary schools in
challenging contexts. A number of these middle leaders will go on to be the
headteachers of tomorrow.
71. We know that there is more to do to address the disparity in BME
representation in school leadership. This is why we have provided a £1m
Leadership Equality and Diversity Fund, which has supported 58 school led
projects across England, many of which focus on supporting BME teachers.
We are also working with the sector to revise recruitment guidance for schools
and have appointed nine Women Leading in Education (WLE) regional
networks to raise the profile of women in education and to support career
progression.
2172. We have also set up the WLE leadership coaching pledge in direct response
to calls from the sector, and the profiles of over 800 leaders from all
backgrounds are on our coaching directory where women can identify and
access free leadership coaching to help increase their confidence to pursue
and secure leadership roles.
73. Further information about the labour market for school leaders in England and
Wales is provided in Annex D.
22Applying the 2018 pay award
74. Following the Government’s acceptance of the recommendations of the
STRB’s 21st - 27th reports, schools now have a very large degree of flexibility
to differentiate the remuneration they offer to teachers to reflect various
factors, including local recruitment and retention; roles and responsibilities;
and specialist qualifications.
75. The Government’s response to the STRB’s 27th report was to accept the
recommendation for an uplift of 2% to the minima and maxima of the main pay
range and a 1% uplift to all other classroom teacher and leadership pay
ranges and allowances in the national pay framework.
76. In its report last year, the STRB reiterated its expectation that it should be for
schools themselves to decide the extent to which any uplift to pay ranges and
allowances within the national pay framework will apply to their teachers. It
was the STRB’s view that uplifts should not be applied automatically to
teachers and that any individual pay award needed to take account of
performance. The STRB made very clear that it was not intended that the
uplifts to the framework should translate into uniform pay increases for every
teacher within every school. It is for schools to determine at the institutional
level how to take account of the uplifts to pay ranges and allowances in the
light of their individual school’s pay policy. The Government agrees with this
approach and that schools should be using their autonomy and making
decisions on how they will be rewarding individual teachers in accordance with
their pay policies.
77. The Government’s view is that a similar approach should be taken in any
recommendations this year, namely that it will be for schools to use their
autonomy and set out in their pay policies how they intend to deal with any
proposed uplifts to the national framework.
78. In making its recommendations this year, the STRB should consider how best
to target uplifts to the pay ranges and allowances to best support schools with
recruitment and retention.
23Annex A: Affordability in schools
Funding for schools in England
Spending in schools
A1. In the financial year 2015-16 local authority (LA) maintained schools in
England reported gross total expenditure of £27.5 billion. 10 Of the total
expenditure:
• £0.3billion (1.0%) was spent by LA maintained nursery schools;
• £18.0 billion (65.4%) was spent by primary schools;
• £6.9 billion (24.8%) was spent by secondary schools; and
• £2.0 billion (7.2%) was spent by special schools.
A2. Maintained schools spent £20.5 billion, or 74.5% of their total expenditure, on
staffing costs. Of which:
• £12.7 billion (46.1% of total expenditure) was spent on permanent and
supply teaching staff (excluding agency supply teachers and supply
teacher insurance costs);
• £4.7 billion (17.1%) on education support staff; and
• £3.1 billion (11.3%) on other employee costs.
A3. The way in which academies spend their funding is broadly in line with LA
maintained schools. In 2015-16 academies received income of £18.9billion.
They spent £9.6bn on teaching staff (50.1%), around half of total spending,
and £2.3bn (11.8%) on Education Support Staff. 11
School budgets in Wales
A4. In Wales, local authorities are responsible for school funding, through
devolution of education to the Welsh Government. Gross schools’
expenditure is budgeted to be £2.543 billion in 2017-18. The funding
delegated to schools in 2017-18 is budgeted to be £2.142billion. Gross
schools’ expenditure per pupil is budgeted to be £5,628, a year-on-year
increase of 1.0% or £58. Of this £4,740 per pupil is delegated to schools and
£888 per pupil retained for centrally funded school services. The amount of
funding that local authorities delegate directly to schools’ ranges between 77%
10
All maintained school data available from the maintained schools spending data SFR
11
All academies school data available from the academies income and expenditure SFR
24and 89% of overall gross schools budgeted expenditure. Overall, 84.2% of the
total gross schools budgeted expenditure is delegated directly to schools, a
decrease of 0.1 of a percentage point compared to the previous year.
A5. For the period 2011-12 to 2015-16 the Welsh Government committed to
increasing spending on schools services at 1% better than the uplift to the
overall Welsh budget. Over the Assembly term the Welsh Government
provided an additional £106million for schools services. Through the Local
Government Settlement in 2016-17 the Welsh Government made available an
additional £35million for frontline school services. In December 2016 the
Welsh Government published its Final Budget and Final Local Government
Settlement for 2017-18. When compared on a like for like basis, the Welsh
Government’s education budget for 2017-18 has increased by £50.9million or
3.8%.
25Annex B: The teacher labour market
In November 2016 there were approximately 457,300 FTE teachers. Table 2
shows the FTE numbers of teachers in England split by grade and phase. The
majority of teachers are classroom teachers (387,700 FTE). There are
approximately 69,500 FTE leadership teachers and 24,000 FTE unqualified
teachers 12.
Table 2 : Full-time equivalent teachers (FTE) by grade 13 and phase, publicly-funded
schools (England, November 2016) (000s) 14
Nursery
Centrally
and Secondary Special Total
employed
primary
Heads
16.8 3.6 1.4 0.1 21.9
Deputy heads
12.6 5.3 1.3 0.1 19.2
Assistant heads
11.8 13.8 1.8 1.0 28.4
Classroom
teachers 181.1 185.4 18.0 3.2 387.7
TOTAL
222.4 208.2 22.3 4.3 457.3
- of which
unqualified 7.6 12.8 2.8 0.8 24.0
Source: School Workforce Census, SFR November 2016
The teaching workforce 15
18% of all FTE teachers in publicly-funded schools were aged 50 and over,
whilst 25% of teachers were aged under 30. Unqualified teachers have the
largest percentage of teachers under 30 at 41%. Age distributions by grade
are shown in Figure 5.
74% of teachers at all grades are female. For classroom teachers the
percentage is slightly higher at 75%. For the leadership group, the percentage
of female teachers is 69%. Figure 6 shows the percentages of females and
males for each grade.
12 An unqualified teacher in the LA maintained sector is either a trainee working towards QTS; an overseas
trained teacher who has not exceeded the four years they are allowed to teacher without having QRS; or an
instructor who has a particular skill who can be employed for so long as a qualified teacher is not available.
13 Includes advisory teachers therefore may not equal to the sum of the component parts.
14
Where totals appear not to sum, this is due to rounding.
15
All figures taken from the School Workforce Census (SWC) 2016 and are England only unless otherwise
stated.
26Figure 5: Full-time equivalent teachers (FTE) in publicly funded schools by grade and age
(England, November 2016)
Source: School Workforce Census, November 2016
Figure 6: Full-time equivalent teachers (FTE) in publicly funded schools by grade and gender
(England, November 2016)
Source: School Workforce Census, November 2016
Table 3 shows the ethnic background of teachers in England by grade. The
percentage of teachers with a non-white ethnic background decreases as
grade increases. The highest percentages of teachers with a non-white
background are observed for unqualified teachers and the lowest percentage
of teachers with a non-white background is observed for headteachers.
27Table 3: Distribution of full-time equivalent teachers (FTE) by grade and ethnicity in publicly
funded schools. (England, November 2016) 16
Deputy Assistant Classroom Unqualified
Heads Heads Heads Teachers Teachers Total
White 96.8% 95.7% 93.6% 91.5% 85.2% 91.7%
White British 93.1% 92.0% 89.6% 86.1% 73.1% 86.3%
White Irish 1.9% 1.8% 1.6% 1.6% 3.7% 1.8%
Any Other White Background 1.8% 1.9% 2.4% 3.8% 8.4% 3.7%
Black 1.0% 1.3% 1.7% 2.2% 5.3% 2.3%
Black African 0.2% 0.3% 0.4% 0.9% 1.6% 0.8%
Black Caribbean 0.7% 0.8% 1.1% 1.0% 2.9% 1.1%
Any Other Black Background 0.1% 0.2% 0.3% 0.3% 0.8% 0.3%
Asian 1.3% 1.9% 3.1% 4.3% 5.8% 4.0%
Indian 0.7% 1.1% 1.6% 2.0% 2.5% 1.9%
Pakistani 0.3% 0.4% 0.8% 1.1% 1.6% 1.1%
Bangladeshi 0.1% 0.1% 0.3% 0.6% 0.8% 0.5%
Any Other Asian Background 0.2% 0.3% 0.4% 0.6% 1.0% 0.6%
Mixed 0.7% 0.8% 1.0% 1.3% 2.3% 1.2%
White and Black African 0.0% 0.1% 0.1% 0.1% 0.3% 0.1%
White And Black Caribbean 0.2% 0.2% 0.2% 0.3% 0.7% 0.3%
White and Asian 0.2% 0.2% 0.3% 0.3% 0.3% 0.3%
Any Other Mixed Background 0.2% 0.3% 0.4% 0.5% 0.9% 0.5%
Chinese 0.1% 0.0% 0.1% 0.2% 0.3% 0.2%
Any Other Ethnic Group 0.2% 0.3% 0.4% 0.5% 1.1% 0.5%
Source: School Workforce Census, November 2016
Classroom teacher salaries
In 2017-18 the minimum salaries for classroom teachers in the Rest of
England and Wales pay band (the lowest of the four regional pay bands) are
£22,917 for a qualified teacher and £16,626 for an unqualified teacher.
In November 2016 the average (median) gross pay of regular classroom
teachers in publicly funded schools in England was £35,600. This was an
increase of 0.6% compared to November 2015 (£35,400).
Teachers’ salaries are largely driven by the location of the school they work in
and their level of experience. Figure 7 shows median salaries of classroom
teachers by pay band and age. Classroom teachers typically see their salary
rise much quicker in the beginning of their careers than in their later stages.
16
Percentages are out of a total of those with ethnicity information recorded in the census (over 95% of all
teachers)
28Figure 7 : Average (median) salaries of classroom teachers in publicly funded schools, by age
of teacher 17
Source: School Workforce Census, November 2016
However, analysis of the November 2016 School Workforce Census (SWC)
also shows that the overall level of pay varies between phase and sector.
Figure 8 and Figure 9 show that average salaries for classroom teachers are
higher in secondary schools than in primary schools, across both the
maintained and academy sectors.
Average salaries in primary schools (except London fringe) are higher in LA
maintained schools than in converter academies. Meanwhile, in both primary
and secondary schools, classroom teachers in sponsor-led academies
consistently have the lowest salaries in each of the four pay bands. However,
this analysis does not allow for like-for-like comparison of characteristics.
Other analysis suggests that on average academies use allowances less than
in maintained schools.
17
Excludes centrally employed teachers, unqualified teachers and teachers with unreliable salary.
29Figure 8 : Average (median) salaries of classroom teachers in primary schools by region and
school type 18
Source: School Workforce Census, November 2016
Figure 9 : Average (median) salaries of classroom teachers in secondary schools by
region and school type 19
Source: School Workforce Census, November 2016
Figure 10 shows that the median pay of classroom teachers is higher than
private sector graduate professionals in most regions in England (excluding
London, Eastern, and the South East). In the other regions the median pay of
classroom teachers is lower than that of private sector graduate professionals.
18
Excludes special schools, free schools, CTCs, UTCs, studio schools, and centrally employed staff and
teachers with unreliable pay information.
19
Excludes special schools, free schools, CTCs, UTCs, studio schools, and centrally employed staff and
teachers with unreliable pay information.
30Figure 10 : Percentage difference in average (mean and median) salaries - classroom
teachers’ salaries vs. private sector graduate professional salaries 2016/17 20 21
30%
Difference between teaching vs. private
20%
10%
average salary
0%
-10%
-20%
-30%
North Yorkshire
North West (inc and East West South South
Eastern London
East Merseysi Humbersi Midlands Midlands East West
de) de
Median 10% 19% 14% 21% 2% -8% -4% -14% 6%
Mean 2% -5% -8% 1% -10% -24% -19% -28% -11%
Source: School Workforce Census November 2016 (teachers),
Labour Force Survey (graduate professionals)
Classroom teachers are less likely to be paid salaries at very high levels due
to the maximum salary restrictions of the STPCD. The classroom teacher
mean salary is lower than that of a graduate professional in all regions apart
from the East Midlands and the North East, where classroom teacher salaries
are very slightly higher. In general, this can be explained by the existence of
some graduate professionals earning very high salaries, which are inflating
the value of the mean, but have little effect on the median. Classroom
teachers are less likely to be paid salaries at very high levels due to the
maximum salary restrictions of the STPCD.
Pay is only part of the total compensation package and this analysis does not
take into account additional elements offered in the different professions, such
as the pension provision and the offer of healthcare benefits. Graduates would
also base their career decisions on other factors, such as future
career/promotion prospects, job security and work/life balance.
This analysis does not compare workers with like-for-like characteristics and
the comparison would be quite different if factors such as gender and age
were taken into account. Female teachers generally fare better than male
teachers when compared to graduates. The earnings gap between teachers
and graduates of the same age varies but is generally smaller at younger
ages.
20 Graduate cohort includes employees who worked in past week, full-time in main job, with highest qualification a
degree or equivalent, professional occupation or associate professional and technical occupation. The national
total for graduates includes Wales, whereas for classroom teachers it is England only.
21 The 2016/17 average salaries for graduates are estimates based on the latest three quarters of available data
(Q4 2016 and Q1&Q2 2017).
31Figure 11 shows real term earning values 22 of classroom teachers and private
sector graduates 2002/03 to 2016/17 23, not accounting for any regional
variation. All three averages have decreased slightly since 2015/16, and at
very similar rates. This is partly a result of relatively high inflation and partly a
result of the changing composition of the teaching/private sector labour
market. The figures graphed below are averages across the workforce and do
not represent the career salary trajectory of any particular teacher.
From 2002/03 to 2016/17 24 classroom teacher median salaries have seen a
drop of 8% and overall teacher median salaries of 11% in real terms. The
median salaries of private sector graduates have decreased by 10%.
Figure 11 : Average (median) salaries in real terms 25 over time 26
Source: Database of Teacher Records (prior to 2010) and School Workforce Census (from 2010).
Graduates: Labour Force Survey (all years) 27
22
At 2016/17 prices, using CPI as the measure of inflation, consistent with ONS published analysis of changes in
real wages.
23
The 2016/17 average salaries for graduates are estimates based on the latest three quarters of available data
(Q4 2016 and Q1 & Q2 2017). Q3 2017 of the Labour Force Survey is not yet available.
24
Before 2013/14 the classroom teacher figures include ASTs and ETs; from 2013/14 onwards they include
leading practitioners.
25 At 2016/17 prices, using CPI as the measure of inflation, consistent with ONS published analysis of changes in
real wages.
26 Unlike the previous three charts, this analysis is not limited to professional graduates due to inconsistencies in
the time series of the Standard Occupational Classification. Instead, graduates from all occupations are
included in this analysis.
27 Coverage: From 2010: England and Wales, post-2010 onwards: Graduates – England and Wales, Teachers -
England only. The 2014/15 average salaries for graduates are estimates based on the latest three quarters of
available data (Q4 2014 and Q1&Q2 2015). Q3 2015 of the Labour Force Survey is not yet available.
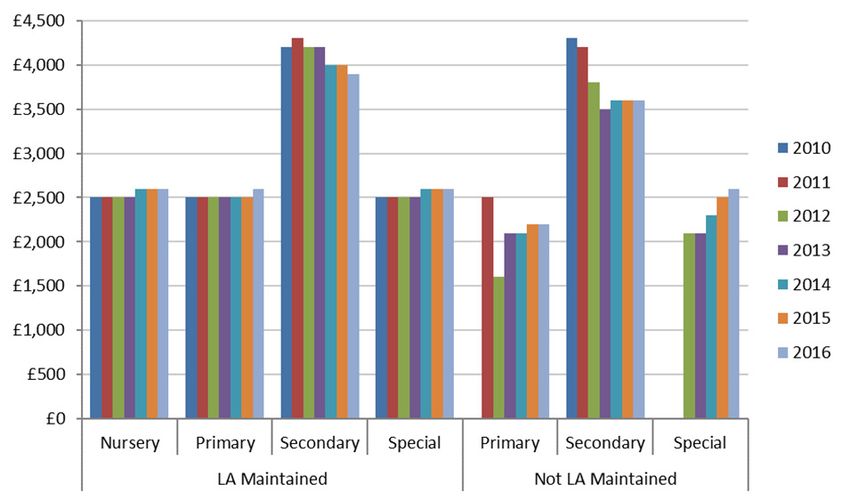
32Use of allowances
Table 4 shows the percentage of schools making use of different allowances
by region. Nationally, 75.2% of schools were using allowances in November
2016. Following an increase from 75.7% in November 2010 to 78.8% in
November 2013, we have observed a decrease between November 2013 and
November 2016. There is considerable variation between the regions as
regards the use of allowances, with additional payments being used most in
inner and outer London (85.2% and 85.3% of schools using them), while only
approximately two in three schools using them in Yorkshire and the Humber.
33Table 4: Use of pay flexibilities, by region (England, November 2016)
Schools using REC Schools using TLR Schools using SEN Schools using Schools using any
Total Number of payments payments payments other payments payments
Region
Schools
Number % Number % Number % Number % Number %
North East 1,154 97 8.4% 827 71.7% 192 16.6% 224 19.4% 895 77.6%
North West 3,176 194 6.1% 2,295 72.3% 566 17.8% 482 15.2% 2,528 79.6%
Yorkshire and the
2,231 160 7.2% 1,341 60.1% 281 12.6% 353 15.8% 1,522 68.2%
Humber
East Midlands 2,035 162 8.0% 1,325 65.1% 344 16.9% 466 22.9% 1,500 73.7%
West Midlands 2,402 280 11.7% 1,393 58.0% 282 11.7% 722 30.1% 1,695 70.6%
East of England 2,543 361 14.2% 1,542 60.6% 656 25.8% 661 26.0% 1,980 77.9%
Inner London 1,011 218 21.6% 808 79.9% 209 20.7% 249 24.6% 861 85.2%
Outer London 1,548 255 16.5% 1,218 78.7% 346 22.4% 505 32.6% 1,321 85.3%
South East 3,333 415 12.5% 1,909 57.3% 775 23.3% 725 21.8% 2,304 69.1%
South West 2,314 123 5.3% 1,230 53.2% 490 21.2% 692 29.9% 1,757 75.9%
England 21,747 2,265 10.4% 13,888 63.9% 4,141 19.0% 5,079 23.4% 16,363 75.2%
Source: School Workforce Census, November 2016 28
28
Classroom teachers in publicly funded schools for whom data is provided. A school is counted if they are paying a pay flexibility to at least one classroom teacher. REC payments
represent Recruitment and Retention payments.
34Teaching and learning responsibility (TLR) payments are the most widely
used form of allowances, used in approximately 63.9% of schools. TLR
payments are made to a teacher for undertaking a sustained additional
responsibility for the purpose of ensuring the continued delivery of high-quality
teaching. London schools make use of these payments most often and this
pattern has been stable over time (since November 2010).
Recruitment and retention payments provide financial assistance, support or
benefits to a teacher if such incentives are considered to be necessary for the
recruitment of new teachers and the retention of existing teachers.
Table 4 shows that Inner London schools use these payments the most often;
this has long been the case. Given the size of the job market in London,
schools may face larger competition for teachers there than elsewhere, which
may in turn drive the higher use of recruitment and retention payments.
The East of England region has the most widespread use of special
educational needs (SEN) payments, but they are also widely used in London
and in the South East. ‘Other payments’, on the other hand, are being used
most widely in Outer London, the West Midlands and the South West. It could
be that schools in some regions tend to record TLR / REC / SEN payments
under ‘Other payments’. These figures should therefore be interpreted with
caution.
Figure 12 shows the percentage of classroom teachers in receipt of TLR
payments each year between November 2010 and November 2016.
Maintained schools were more likely to use TLR payments than academies in
the same phase, and TLR payments were more widely used in secondary
schools than primary schools. The overall percentage of teachers in receipt of
a TLR payment has been generally increasing over time, from 26.7% in
November 2010 to 27.9% in November 2016. However, between 2015 and
2016, there has been a slight reduction of the percentages in nursery, primary
and secondary schools (special schools show no change). It is also worth
noting that full-time teachers are twice as likely to be awarded a TLR payment
compared to part-time teachers, with 32.0% of full-time teachers and 16.0% of
part-time teachers having been in receipt of a TLR payment in November
2016. 29
29
This also holds when controlling for school type
35You can also read