Rise and Fall of Nokia: Impact on the Finnish Economy - Theseus
←
→
Page content transcription
If your browser does not render page correctly, please read the page content below
Katharina Megerle

Rise and Fall of Nokia:
Impact on the Finnish Economy

                                 Bachelor of Business
                                      Administration
                                International Business
                                          Spring 2019
Abstract

Author: Megerle Katharina

Title of the Publication: Rise and Fall of Nokia: Impact on the Finnish Economy

Degree Title: Bachelor of Business Administration

Keywords: Nokia, Finnish economy, Finland

Nokia and Finland have had a special relationship. Nokia’s rise has influenced Finland in such a way as no
other company did. With the company’s downfall, a part of the country was lost as well (Derek, 2015). This
work aimed to examine Nokia’s influence on the Finnish economy over the last three decades. In doing so,
several factors were considered. The history of the company and the country was depicted to better
understand Nokia’s impact on Finland’s economy. This thesis tried to verify the following hypothesis:
Nokia’s rise and downfall strongly influenced the Finnish economy. In order to demonstrate whether the
hypothesis is true or not, literature was reviewed, and several statistics were taken into account. The hy-
pothesis was testified as partly true. Whereas Nokia’s rise had a great impact on the Finnish economy, its
downfall influenced Finland’s economy less strongly due to interventions by the country’s government and
Nokia’s attempts to support dismissed employees concerning their job hunting. Though the company’s in-
fluence on the Finnish economy shrank, it is still one of the most important firms in Finland. Further re-
search could be done regarding the impact of Nokia’s downfall on the Finnish startup scene or about the
extent to which the ICT sector in Finland is still shaped by Nokia's influence.
Table of Contents

1          Introduction .........................................................................................................................1

2          Nokia ....................................................................................................................................3
           2.1        Transferring another text to the template..............................................................3
           2.2        World market leader ...............................................................................................9
           2.3        The downfall ..........................................................................................................12
           2.4        The reinvention of Nokia.......................................................................................22

3          The Finnish economy .........................................................................................................29
           3.1        1985 – 2000 ...........................................................................................................29
           3.2        2000 – 2007 ...........................................................................................................36
           3.3        2008 – today..........................................................................................................38

4          Nokia’s impact on the Finnish economy ...........................................................................42
           4.1        Before the downfall...............................................................................................42
           4.2        During the downfall...............................................................................................50
           4.3        Today .....................................................................................................................52

5          Conclusion and Discussion.................................................................................................58

List of References ...........................................................................................................................60

Appendices
List of Abbreviations ALu Alcatel-Lucent AT Advanced Technologies BERD Business Enterprise Expenditure on R&D CEO Chief Executive Officer CIO Chief Information Officer COMECON Council for Mutual Economic Assistance EC European Community EEA European Economic Area EFTA European Free Trade Association EPO European Patent Office EU European Union GDP Gross Domestic Product GPS Global Positioning System GSM Global System for Mobile Communications HTML Hypertext Markup Language ICT Information and Communications Technology ISB Integration Steering Board KPI key performance indicator NFC Near Field Communication NMT Nordisk Mobil Telefon NSN Nokia Siemens Networks OECD Organization for Economic Cooperation and Development OS Operating System ROI Return on Investment R&D Research and Development SMEs Small and Medium Sized Enterprises UBI Universal Basic Income USSR Soviet Union (officially: Union of Soviet Socialist Republics)
2

List of Figures

Figure 1 Sales of Nokia by industrial group, in % .............................................................................4
Figure 2 Net sales of Nokia, in billion FIM .......................................................................................5
Figure 3 Net sales of Nokia by market area .....................................................................................6
Figure 4 Nokia’s worldwide net sales in billion euros, 1999 – 2012 ..............................................10
Figure 5 Nokia in the Top 100 Ranking of Interbrand, 2000 – 2014 ..............................................11
Figure 6 Global market share held by the leading smartphone operating systems in sales to end
users from 1st quarter 2009 to 2nd quarter 2018.........................................................................14
Figure 7 Company structure of the new Nokia ..............................................................................25
Figure 8 Market share of IT network vendors, 2015 – 2018 .........................................................27
Figure 9 Nokia's worldwide net sales in billion euros, 2012 – 2018 ..............................................28
Figure 10 Nokia's employees in thousands as of the end of each year, 2005 – 2017 ...................28
Figure 11 Unemployment rate (in %), persons aged 15–64 ..........................................................30
Figure 12 GDP year-on-year change in %, 1985 – 1999.................................................................31
Figure 13 Finland's exports by industry in percent of total exports ..............................................32
Figure 14 Structure of an ICT cluster .............................................................................................34
Figure 15 GDP year-on-year change in %, 2000 – 2007.................................................................38
Figure 16 GDP year-on-year change in %, 2008 – 2017.................................................................39
Figure 17 Nokia as a share of exports and GDP, in % ....................................................................43
Figure 18 Contribution of Nokia and the electronics industry to Finnish GDP growth, in % ........43
Figure 19 Share of R&D expenditures by sectors in Finland, in %, 1997 - 2009 ............................45
Figure 20 Nokia's cooperation network in Tekes' ETX and TLX programs .....................................48
Figure 21 R&D expenses as a share of GDP ...................................................................................49
Figure 22 Nokia’s share of EPO patent applications in Finland, 1990 - 2006 ................................50
Figure 23 Nokia’s and Finland’s EPO patent applications and Nokia's share of Finland's EPO
patent applications, 2011 – 2018 ..................................................................................................53
Figure 24 Research and development expenditure by sector, 2010 – 2018 .................................54
Figure 25 Vendors' market share of cell phone unit sales to end users worldwide, 1997 – 2014
.................................................................................................................................. Appendix 1 1/1
3

List of Tables

Table 1 Major global telecommunication companies in 1999 ........................................................7
Table 2 Nokia's share of employment in Finland, 2000 - 2008......................................................44
Table 3 Nokia's R&D expenses, 1998 – 2009 .................................................................................46
Table 4 Nokia employees, 2010 - 2012 ..........................................................................................51
Table 5 Nokia's R&D expenses, 2014 – 2018 .................................................................................53
Table 6 Nokia employees, 2014 – 2018 .........................................................................................55
Table 7 Top ten of the largest companies by turnover in Finland, 2017 .......................................57
Table 8 Top 5 Epo applicants, 2014 -2018 ................................................................ Appendix 3 1/1
Table 9 European patent applications per mio. Inhabitant by country, 2014 – 2018 .......................
.................................................................................................................................. Appendix 3 1/1
1

1    Introduction

Nokia, older than Finland itself, has impacted Finland in such a way as no other company did. The
company was not just any company to Finns. It influenced their national identity and self-confi-
dence. The company was a symbol of economic growth after Finland’s recession in the early
1990s. For more than a decade, Finland and Nokia were tantamount to cell phones. On the
grounds of the company, Finland gained international attention. Its psychological significance for
Finns made it difficult for them to bear Nokia’s decline and sale to Microsoft (Yle, 2013b). Siilas-
maa (2019) depicts how Nokia’s success changed the way he did business dur-ing his time at F-
Secure, a Finnish cybersecurity firm. F-secure tried to hide the fact that it was headquartered in
Finland before Nokia became worldwide successful. After Nokia’s success in the later 1990s, the
company proclaimed that it was Finnish. This small example shows that Nokia made Finns proud
to be Finnish as well as how much the company impact-ed the self-perception of Finnish citizens.

Apart from the psychological influence, how and particularly how strong did Finland’s economy
suffer from Nokia’s fall? According to Wollaston (2018), the annual budget of the Finnish govern-
ment was smaller than Nokia’s. This indicates that Nokia could invest more money than the gov-
ernment, particularly in its booming times. Therefore, the company could boost innovations in
Finland through increased spending on R&D, leading to more patent applications. Patents are not
only a sign of innovation but also of economic growth and knowledge sharing (Phelps, 2015). At
a time, Nokia accounted for more than half of Finland’s EPO pa-tent applications, which implies
that the company had a large impact on the Finnish innovation system (Nikulainen & Pajarinen,
2010). Hence, one might assume that Nokia influenced Fin-land's economy in many ways.

This work aims to examine Nokia’s influence on the Finnish economy over the last three decades.
In doing so, several factors will be considered such as the company’s contribution to Finland’s
employment, Finnish GDP, and R&D spending in Finland. For a better understanding of the com-
pany and the country, their history will be depicted before dissecting Nokia’s impact on Finland’s
economy. Thereby, it tries to verify the following hypothesis: Nokia’s rise and downfall strongly
influenced the Finnish economy. In order to demonstrate whether the hypothesis is true or not,
literature will be reviewed, and several statistics are taken into ac-count. The structure of this
work is as follows: First, the history of Nokia, from its beginning in 1865 over its time as the world
market leader until today, is outlined. The next chapter is concerned with the development of the
2

Finnish economy since the 1980s. Then if and how Nokia has influenced and is influencing Fin-
land’s economy is described. Finally, a conclusion and discussion of this work are given.
3

2     Nokia

This chapter delineates the history of Nokia. Thereby, it focuses on the factors which made Nokia
to a world market leader in the cell phone sector as well as on the reasons for Nokia’s downfall.
Last, the transformation of Nokia to the company it is today will be outlined.

2.1       Transferring another text to the template

Nokia’s history began in 1865 when Fredrik Idestam established a paper mill in Tampere, South-
west Finland. A few years later, he launched another one at the river Nokianvirta – the name giver
of Nokia. During the 1960s there was close cooperation between the paper mill and two other
companies:

      •    Rubber Works: a rubber entity, which produced, for instance, gumboot and raincoats.
           Eduard Polón established it in 1898.

      •    Finnish Cable Works: founded by Arvid Wickström in 1912. The firm operated in electron-
           ics from 1960. Three years later it started producing cordless telephones for the army and
           emergency services.

In 1967, the three companies merged and became the Nokia Corporation. The new corporation
had five business divisions: rubber, cable, forestry, electronics, and electricity generation (bo-
erse.ARD.de, n.d.; Frost, 2013; NZZ, 2013). Nokia started to cooperate with Salora Oy in the 1970s.
Salora, launched as a radio manufacturing company in the 1920s, also produced televisions (since
the 1950s), and radiophones (since the 1960s). Nokia and Salora made an agreement that they
would coordinate and cross-market their branding and promotion activi-ties in 1975. This means
that Nokia merchandised Salora’s cell phones while Salora marketed Nokia’s professional mobile
radio base stations and handsets. The cooperation between those two companies became closer
and resulted in a joint venture, Mobira Oy, in 1979. Three years later, Nokia bought Salora’s share
of the joint venture and renamed it ‘Nokia-Mobira Oy’ (Steinbock, 2001).

With the 1980s, Nokia’s rise to the world market leader as a cell phone manufacturer started.
Several acquisitions of electronics companies strengthened the position of Nokia in the consumer
electronics and telecommunications market. At this time, the cellular market in the United States
4 was behind the one in Europe. When the U.S. market had evolved, Mobira wanted to enter this market. Therefore, it needed a partner who had a distribution network in the United States. Hence, it created a joint venture with Tandy Corporation in the mid-1980s. They started a pro- duction site in South Korea and distributed their cell phones in the U.S. The joint venture taught Nokia lessons about overseas manufacturing activities. This was important for the company’s at- tempts regarding the preparations of the Asian market entry (Steinbock, 2001). Between 1986 and 1988 Nokia had 11 business lines due to its own historical background as well as takeovers. The significance of core business areas shifted throughout the years which can be seen in Figure 1. The cable business line was the most important business segment from the late 1960s until the early 1980s. Then the electronics business line gained increasing significance until it became the only core business area of Nokia in the 1990s. The rubber and forest business lines experienced the same as the cable business line: In 1967 they were more important than the electronics. With the rising primeness of the electronics business segment, they became more and more irrelevant to Nokia. After several acquisitions and divestments, Nokia transformed itself into a telecommunication company (Ali-Yrkkö, Paija, Reilly, & Ylä-Anttila, 2000). Figure 1 Sales of Nokia by industrial group, in % Source: Ali-Yrkkö, Paija, Reilly, & Ylä-Anttila, 2000, p. 37.
5

While Nokia undertook changes regarding its major businesses, there were also shifts concerning
sales: Whereas approximately one-half of Nokia’s sales were domestic sales until 1980, Nokia
started to increase its international activities in the 1980s. The company did not only increase its
exports also it acquired production units abroad and foreign subsidiaries (most operating in the
electronics industry and producing goods directed to consumers). Those acquisitions were part
of Nokia’s strategy: fast growing and expansion concerning operations to new business lines. Con-
sequently, Nokia’s net sales and workforce increased rapidly. In the Nordic countries, the com-
pany became the second biggest electronics enterprise. Figure 2 shows the development of
Nokia’s exports, production abroad and domestic sales during 1980-1998. Production abroad is
obtained by subtracting exports from foreign sales (Ali-Yrkkö, Paija, Reilly, & Ylä-Anttila, 2000).
The figure illustrates that Nokia’s exports and production abroad increased more and more, while
domestic sales declined.

Figure 2 Net sales of Nokia, in billion FIM

Source: Ali-Yrkkö, Paija, Reilly, & Ylä-Anttila, 2000, p. 38.

Nokia had made large investments when the Finnish Economy experienced a serious recession in
the early 1990s. As a result, the company faced a crisis and had to sell several business groups,
which led to 15,000 layoffs between 1989 and 1993. Nokia’s competitor Ericsson saw the struggle
of the enterprises due to the crises and tried to acquire it in 1991. The deal failed because Ericsson
6

wanted to buy the company without its consumer electronics business line (Ali-Yrkkö, Paija, Reilly,
& Ylä-Anttila, 2000; Milne, 2013).

The next major strategic decision was made in 1992 when Jorma Ollila became CEO of Nokia. He
decided that the company should focus increasingly on the telecommunications industry. Conse-
quently, future sell-offs took place. During 1995 and 1999 Nokia’s average yearly growth rate was
more than 30% due to a booming telecommunication business. In contrast to the rapid growth in
the 1980s, Nokia grew mostly internally during the 1990s. With the growth, there also arose chal-
lenges for the company. Over the years, Nokia outsourced more and more operations. Therefore,
it had to enlarge their own as well as their suppliers’ capacity to satisfy the demand. As a result,
Nokia’s workforce increased by a few thousand (Ali-Yrkkö, Paija, Reilly, & Ylä-Anttila, 2000). The
third generation mobile systems required an expansion of Nokia in its R&D operations in order to
develop new models and technologies made for these mobile systems. Besides the new mobile
systems, the tighter competition was another reason why Nokia had to raise its R&D efforts. Net
sales by market area experienced a change as well: While Europe remained the major market
area with more than 50%, the Asia and Pacific area, as well as the North and South America area,
gained more importance. This can be seen in Figure 3, which shows Nokia’s net sales by market
area in the years 1994 and 1999 (Ali-Yrkkö, Paija, Reilly, & Ylä-Anttila, 2000).

Figure 3 Net sales of Nokia by market area

Source: Ali-Yrkkö, Paija, Reilly, & Ylä-Anttila, 2000, p. 41.
7

Nokia’s major competitors at that time were Ericsson and Motorola, which are both larger than
Nokia measured by net sales. Nokia focused more on cell phones than its core competitors that
produced semiconductors instead of buying them (as Nokia did). Nokia Mobile Phones grew on
average about 50% yearly between 1997 and 1999 due to an increased demand for Nokia cell
phones. Consequently, Nokia gained market share. Based on those reasons, Nokia’s growth rate
was substantially faster than the ones of its competitors. Moreover, at this time, Nokia was more
profitable than Ericsson and Motorola measured by the ROI ratio and operating profit (Ali-Yrkkö,
Paija, Reilly, & Ylä-Anttila, 2000). This can be seen in Table 1, which shows a comparison of the
three enterprises.

Table 1 Major global telecommunication companies in 1999

Source: Ali-Yrkkö, Paija, Reilly, & Ylä-Anttila, 2000, p. 45.

In contrast to the company’s competitors, Nokia understood customers’ needs, which was one
reason for its success. It spent many efforts in the product design and user experience. Another
reason was a prosperous marketing strategy. In fact, Nokia changed its marketing strategy for cell
phones in the early 1990s. Up until then, Nokia advertised them as a status symbol. The new
marketing style promoted them as a regular consumer product. Nokia left the idea behind, that
cell phones had to be linked to luxury. As a result, the company’s sales rose not only to business
but also to private persons. Marketing and an understanding of customer needs helped Nokia to
increase its brand value (Ali-Yrkkö, Paija, Reilly, & Ylä-Anttila, 2000). For the company, it was im-
portant to improve its worldwide attention due to its lack of brand recognition. Nokia’s products
8

were either sold by the company’s competitors under their names or almost exclusively used in
larger systems. Only a few products with Nokia’s name on it were sold by dealers. Therefore,
Nokia seemed to be invisible (Steinbock, 2001). That is why it was crucial for Nokia to attain world-
wide attention. It achieved this by offering innovative products or features of its products such
as:

      •   The ‘Mobira Cityman’, Nokia’s first handheld cell phone. It was launched in 1987 and be-
          came famous through a call by the Russian president Michail Gorbatschow.

      •   The ringtone ‘Nokia Tune’ (1998), which was first launched in 1994 under the name
          ‘Grande Valse’.

      •   The ‘Nokia 9000 Communicator’, launched in 1996, was a combination of a computer and
          a cell phone. Thus, it was the first cellular, which was able to send and receive emails and
          fax, as well as open websites that are HTML-based. Moreover, it had an entire keyboard
          and users could open it like a laptop.

      •   The ‘Nokia 6110’, which was launched in 1997, quickly became one of the most sold cell
          phones. Its multifunctional plug enabled the users to connect the Nokia 6110 with a com-
          puter, headset, car handsfree or computer modem card. (boerse.ARD.de, n.d.; Curtis,
          2013; Frost, 2013).

Furthermore, Nokia had a huge advantage over other competitors in the late 1980s due to its
support in developing the GSM, which became the mandatory standard for all European cellular
networks. Before the GSM was developed, wireless carriers did not support all communication
standards. Therefore, it was a crucial step to evolve a unified mobile communication standard for
cell phone vendors. Due to the company’s influence in the developmental process of the GSM, it
had a head start regarding the development of GSM devices and equipment. Moreover, Nokia
had a leadership role (through memberships of the enterprise’s engineering and technical em-
ployees) in key standard-setting committees within the European Telecommunications Standards
Institute, which is responsible for further development of mobile communications standards and
cellular specifications. In addition, the company was part of other standards-setting groups, that
helped Nokia to become the world market leader in cell phones in 1998. It holds its positions for
more than a decade (Cronin, 2014; Frost, 2013).
9 2.2 World market leader As described in the previous subsection, Nokia became the world market leader in the cell phone market due to right strategic decisions, high profitability, a smart marketing strategy, increased brand value, investments in R&D (innovative products, understanding and meeting customer needs) and participation in standards-setting groups, which gave the company the opportunity to influence further developments in the cellular industry. In 1998, Nokia started a joint venture with other handset manufacturers, Ericsson, Motorola and Matsushita (Panasonic), and Psion Computers, which ‘brought EPOC, its latest PDA [Personal Dig- ital Assistants] operating system, into the group and the new OS was renamed Symbian’ (Cronin, 2014, p. 45). Since Nokia was the dominant cell phone producer, it was the largest licenser for Symbian. Furthermore, it could put pressure on its partners to focus on features and develop- ments which favored Nokia. Later the Symbian OS will become a problem for Nokia due to its complicated structure, which it had because it was not designed for internet access. The Symbian OS became a nightmare for developers since they had to adjust each app to every single cell phone model on the basis of Symbian’s complex structure. This made app development for the Symbian OS costly (developers needed to test their apps for each Symbian phone model) espe- cially after the entrance of iPhone AppStore and Android Marketplace into the market (Cronin, 2014). During the years, Nokia’s main competitors lost market share (measured by sold units to end users), whereas Nokia managed to increase its market share up to almost 40% in 2008, which is a rise of about 20% in 11 years. In 2008, Motorola and Ericson, both coming from a double-digit share of the world market in 1997, had each less than 10% of the world market share. Four years later, both companies’ share of the world market is less than 2% each. Besides Nokia, Samsung managed to gain market share as well. In 2012, Samsung overtook Nokia and became the leader of the cell phone world market (Gartner, Mobile phone vendor's market share in sold units to end users worldwide from 1997 to 2014. In Statista - The Statistics Portal., n.d. b). This is depicted in Figure 25 (see appendix 1). Nokia’s growth of market share worldwide is also reflected in the company’s net sales, which are illustrated in Figure 4. Nokia sold its billionth cell phone in 2005. Net sales peaked in 2007 (€51,06 billion), the world market share in 2008 (38,6%). Both declined in 2009. Although it seemed that Nokia had recovered a little bit when looking at net sales in 2010, the company’s market share fell about 7,5%, and it continued to decrease. Also, net sales of the enterprise will not rise again until the selling of Nokia’s Device and Service unit to Microsoft
10

in 2013 (Cronin, 2014; Nokia, Nokia's net sales from 1999 to 2018 (in billion euros). In Statista -
The Statistics Portal., n.d. a).

                  50

                  40
  billion euros

                  30

                  20

                  10

                  0
                       1999 2000 2001 2002 2003 2004 2005 2006 2007 2008 2009 2010 2011 2012

Figure 4 Nokia’s worldwide net sales in billion euros, 1999 – 2012

Source: Nokia, Nokia's net sales from 1999 to 2018 (in billion euros). In Statista - The Statistics
Portal., n.d. a.

The company spent much money on R&D expenses due to rising revenues. Hence, the enterprise
had advanced technology, which made it successful and kept it on its position as a world market
leader. At a time, Nokia had 40,000 issued patents in its portfolio. This demonstrates how crucial
it was for Nokia to be an innovative company. However, this stood in contrast with the interest
of the company’s primary customers, the wireless carriers, which had a huge impact on the deci-
sion about which innovations of the company would make it to commercial production. The de-
pendence of Nokia’s annual growth on GSM mobile phones demand as well as the GSM networks
expansion worldwide resulted in not bringing many of the enterprise’s innovations to the market.
Wireless carriers wanted low price products in order to gain new customers. Therefore, expensive
innovative products were out of their interests. Nokia wanted to meet the requirements of its
customers (wireless carriers) to gain further market share (Cronin, 2014). This reliance resulted
in problems for Nokia. For instance, although Nokia developed NFC and Wi-Fi enabled prototypes,
it decided not to launch them to not disgruntle its wireless carriers. Furthermore, the company
had no data about how their customers used their phones. Consequently, Nokia underestimated
how crucial third party mobile applications in terms of customer preferences were. For keeping
cost low and quality high, it focused on efficiency, automation, and innovation for internal pro-
cesses. At a time, the company attained the utmost gross margin in the industry. For instance, in
11
2006 Nokia’s production costs for its most popular cell phone were about €69, but the enterprise
sold it on average for €102 (Cronin, 2014). Up until that year Nokia manufactured over 325 million
wireless phones annually in its nine production plants worldwide. The enterprise’s factories had
to handle more than 100 billion parts due to a large number of phone models. In addition, Nokia
had to adjust the phone models according to the requirements of its cell phone provider custom-
ers, which means that some features needed to be turned off because wireless carriers did not
want that their customers can use them (for instance, Bluetooth, Wi-Fi or GPS, which are all al-
ternatives to mobile telephony connections). Cell phone providers had made large investments
to upgrade their networks to the new 3G standard. Therefore, they feared a decline of their av-
erage revenue per user, if they intensively use those unregulated networks. Moreover, Nokia
lacked flexibility in the design during its peak of success. This can be seen on the fact that the
company was slow in adopting the folding clamshell designs, which was very popular at this time
(Cronin, 2014).
An American enterprise, Interbrand, ranks companies according to their brand value. Nokia
achieved to be the first non-American business ranked on position 11, whereas the top positions
are taken by American companies such as Coca-Cola, Microsoft and IBM (Ali-Yrkkö, Paija, Reilly,
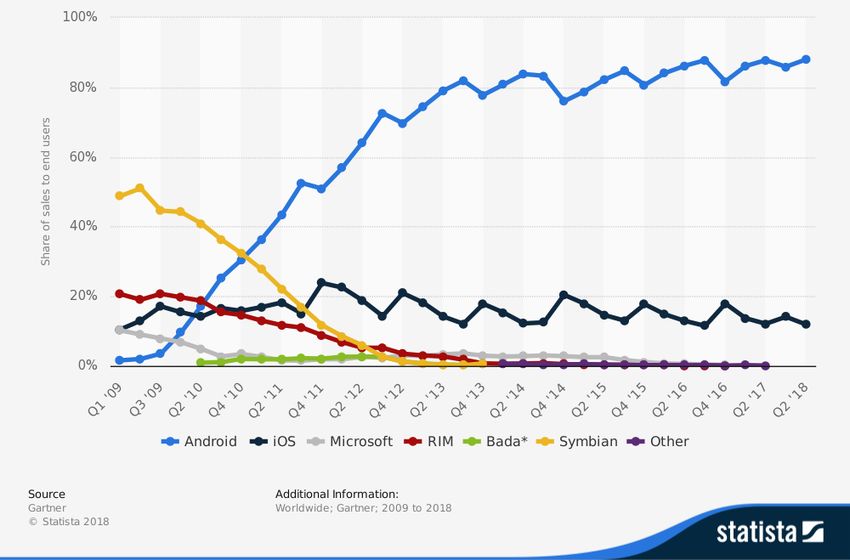
& Ylä-Anttila, 2000). Figure 5 illustrates how Nokia’s position in the Top 100 Ranking changed
during the years 2000 and 2014. The enterprise managed to stay under the Top 10 for more than
ten years. Then in 2011, it dropped to the 14th place, and three years later it declined to position
98 (Best Global Brands Previous Years, n.d.).
Year
2000 2001 2002 2003 2004 2005 2006 2007 2008 2009 2010 2011 2012 2013 2014
0
10
5 5 6 6 6 6 5 5 5
Position in ranking
20 8 8
14
30 19
40
50
60
70 57
80
90
100
98
Figure 5 Nokia in the Top 100 Ranking of Interbrand, 2000 – 2014
Source: own depiction. Data: Best Global Brands Previous Years, n.d.12 On June 19, 2006, the public was informed about a joint venture of Nokia Networks and Siemens COM Carrier, which was named NSN. The 50/50 joint venture was favorable for both companies because they could split up R&D costs. Together they had a global distribution organization (pre- sent in more than 100 countries) as well as the usage of synergy effects with savings of €1,5 bil- lion. Both companies assumed a reduction of the workforce by 10-15%. To ensure that the joint venture would not fail, both enterprises decided to create the NSN Integration Steering Board, which consisted of six members, three from each company. In addition, they launched a large integration program in order to make the joint venture successful. The CIO soon became the sev- enth member of the ISB (Novák, 2010). The planned Day 1 for the joint venture was January 1, 2007, but the date had to be postponed to April 1, 2007, due to the events regarding the Siemens bribe scandal. Complicated about this joint venture was the point of finding an own identity and corporate culture so that it is clearly distinguished from Siemens and Nokia. NSN, Ericsson, and Alcatel/Lucent were three global operating companies, each twice as big as all other remaining companies in the industry (Novák, 2010). In autumn 2007, Nokia announced that it would acquire the US-company Navteq for $8.1 billion. Navteq was one of the largest providers of electronic maps, especially those used in navigation systems for cars. With the acquisition, Nokia wanted to increase its supply of cell phones with which its user can use a navigation system (Nokia steigt bei Navteq ein, 2007). Navteq and NSN played an essential role in Nokia’s future, which will be depicted in the next two subsequences. 2.3 The downfall Nokia’s downfall started with the introduction of the iPhone in June 2007. Although the company was still on top of the world at this time, it neglected to find the right answer to the newly intro- duced smartphone by Apple over the next years (Siilasmaa, 2019). The cell phone market changed with Apple’s iPhone: It was no longer a market in which hardware, developing the best device, was important. Having the best ecosystem, i.e., ‘a combination of hardware, operating system, and applications’ (The Economist, 2012) was the key to success. One of Nokia’s major weaknesses was its operating systems. Like mentioned earlier, the Symbian OS was a nightmare for develop- ers due to its complex structure. According to Risto Siilasmaa (2019), chairman of Nokia’s Board of Directors and founder of F-Secure, a Finnish cybersecurity company, Nokia put the hardware before the software. This led to the complexity of Symbian which often had to be customized for a new Symbian device. Moreover, the customized versions of the OS had many incompatibilities.
13

For instance, changing the screen resolution might lead to customization of each application. Fur-
thermore, the user experience with Symbian was not good, especially after there were other op-
erating systems on the market: Microsoft’s Windows Mobile, Apple’s iOS and Google’s Android.
All three were led by a single firm so that each of them could focus on making it innovative and
beneficial for themselves. In contrast to them, Symbian was a joint venture, which was dominated
by Nokia. Nokia’s partners saw an advantage in hurting the company in order to strengthen their
position in the market. Therefore, Nokia decided that it wanted to buy out its partners by estab-
lishing a foundation. The Symbian Foundation guaranteed that the Symbian OS code was open-
sourced, so everyone had the same access to the OS. With this argument, Nokia persuaded its
partners to sell their shares to it. However, the company lost already much time in the fast-chang-
ing industry (Siilasmaa, 2019).

Another problem was Nokia’s wireless carriers: They would not have liked it if the company re-
duced the number of prompts in order to improve the user experience of Symbian. The Symbian
OS required many command prompts due to the fear of the company’s operator customers that
their clients will complain about extra billing. Nokia’s weakness was the strength of its competi-
tors: Apple’s OS was simple. It was compatible with previous OS versions meaning developers
created applications for the latest version of the OS and the application would still work on de-
vices with an older OS. Additionally, it provided a good user experience that led to a rise in buyers.
Thus, Apple’s iOS became attractive for developers of third-party software because a rise in the
number of iPhone buyers meant an increased number of potential buyers of their software. Fi-
nally, more applications that are available for a device make it more attractive for buyers, which
makes the OS only more attractive for developers leading to more third-party software obtaina-
ble for the devices running with this OS (Siilasmaa, 2019). The global market share held by the
leading smartphone operating systems measured in sales to end users is depicted In Figure 6. It
is clearly visible that Symbian still dominated the marked in the late 2000s, but Apple’s iOS and
Google’s Android as well as other operating systems gained market share. Today, Android is the
number one OS, followed by iOS (Gartner, Global market share held by the leading smartphone
operating systems in sales to end users from 1st quarter 2009 to 2nd quarter 2018. In Statista -
The Statistics Portal., n.d. a).
14

Figure 6 Global market share held by the leading smartphone operating systems in sales to end
users from 1st quarter 2009 to 2nd quarter 2018

Source: Gartner, Global market share held by the leading smartphone operating systems in sales
to end users from 1st quarter 2009 to 2nd quarter 2018. In Statista - The Statistics Portal., n.d. a.

The structure was not the only problem with Symbian: The OS was the reason why many launches
fell behind schedule. Furthermore, Nokia used older (= cheaper) components to increase its gross
margins. The shipping delays made it even worse for Nokia because on the day the new device
was shipped it was ‘practically ready for the dust bin’ (Siilasmaa, 2019, p. 40). Moreover, Nokia
started to lack quality. Thus, the return rates for its N97 were very high. Customers had a bad
experience with Nokia, and it was likely that they turned away from the company. In addition,
the cell phone’s launch was delayed by six months. Hence, its components were only ordinary
and not outstanding as at its announcement in December 2008 (Siilasmaa, 2019). At this time,
Nokia had high hopes on its upcoming N900 which ran with an early version of Maemo, which
was based on Linux. Although the new OS’s Appstore could not offer many apps, the firm was
confident that this would change over time. In 2010, Nokia made a deal with Intel: They merged
their Linux based operating systems (Maemo and Moblin) to one OS (MeeGo). Both companies
hoped that their new expanded OS would be more attractive for app developers. MeeGo’s flag-
ship smartphone, Dali, should be shipped in the second half of 2012, but it was delayed by a full
year. Additionally, Nokia’s competitiveness was weakened by another delay of the new Sym-
bian^3, which should increase the user experience and reduce Nokia’s developmental gap to
other operating systems. This delay was bad not only because it meant product launch delays,
15

but also since the workers who should work on the next update needed to work on the delayed
launch. Moreover, future devices were automatically late as well (Siilasmaa, 2019). The situation
became even worse when Nokia’s board heard of Symbian’s developmental problems. As Siilas-
maa (2019) wrote in his book ‘Transforming Nokia - The Power of Paranoid Optimism to Lead
Through Colossal Change”, the overall build time (build = a program version (Definition of build
in English, n.d.)) was two weeks and the process of compilation, translating the developer lan-
guage into machine language, was reduced from 48 hours to 24 hours. This means that any ad-
justments to the software version took a long time and the people who had worked on it, worked
already on something else when they received the results. Furthermore, the outcomes of the
tests were two weeks old. The technological problems were not the worst problem that Nokia
had: The board members learned that the top management was not informed about that issue in
time. The top management heard about this problem only slightly earlier than the board. This
implies that the company had a cultural problem: Obviously bad news was not communicated to
the superior, which were in turn not able to discover the problems (Siilasmaa, 2019).

The Symbian issues resulted in more and more companies, also Nokia’s former partners of the
Symbian joint venture, that had abandoned the OS and moved to Android. 2010, became the year
of Android. Its global market share was 9,6% in the first quarter of 2010. In the fourth quarter, its
market share was 30,5% - almost as high as the one of Symbian (32,3%). In 2011, Android over-
took Symbian as the global leader which put the company on top of chipset vendors’ priority list.
Samsung, which was the greatest manufacturer for Android devices, increasingly caught up to
Nokia until it became the world market leader in cell phones in 2012. (Gartner, Global market
share held by the leading smartphone operating systems in sales to end users from 1st quarter
2009 to 2nd quarter 2018. In Statista - The Statistics Portal., n.d. a; Gartner, Mobile phone ven-
dor's market share in sold units to end users worldwide from 1997 to 2014. In Statista - The Sta-
tistics Portal., n.d. b; Siilasmaa, 2019).

The discovery of the cultural issues resulted in a new CEO in September 2010. Nokia had their
first non-Finnish CEO with Stephen Elop, who previously worked for Microsoft. At this time, the
company was divided into three businesses:

    •   Devices and Services (D&S): smartphones and mass-market phones

    •   Location and Commerce: comprising among others Navteq and NSN

    •   Nokia Technologies: storehouse of patents that generated revenues (Siilasmaa, 2019).
16 Mr. Elop tried to understand the company and its culture, as well as uncover the current problems within it. Therefore, he sent an email to every employee and asked what they wanted to be changed, remain as it is as well as what they are afraid that he would not understand. Although this way of communicating was new for Nokia’s workforce, more than 3% answered. He contin- ued to use direct communication with employees via SharePoint, so the conversations were ac- cessible to others. Furthermore, the newly announced CEO launched ‘Project Sea Eagle’. It should reveal insights about the company’s capabilities and competitiveness. Additionally, he hired a management consulting firm, McKinsey, for an outsider perspective regarding the project. He also decided to rename the Group Executive Board, which consists of the top management, to the Nokia Leadership Team, because he heard that it was associated with negative connotations (Si- ilasmaa, 2019). Problems with Nokia’s operating systems did not decline. Symbian became apparent to be not competitive, and the company was not able to launch more than three devices over the next three years with MeeGo. This was not a good strategy for Nokia, who tried to catch up. One device per year was not enough to be an attractive platform for app developers due to an insufficient volume number. For developers, it was distinct that they support Android and iOS. They were not happy about supporting another one or even a fourth OS. If they had to choose between MeeGo and Windows Phone, it was likely that they would have picked Windows Phone instead of MeeGo. Furthermore, other manufacturers did not endorse MeeGo. There was just Samsung, the leader of Android phones, who considered it as an option. Therefore, MeeGo could not survive. Another problem for Nokia was the fact that it had no salespeople. The company delivered its devices to operators who sold them to customers. In addition, ‘Nokia dictated the number of phones each operator was allowed to sell” (Siilasmaa, 2019, p. 86) during the good time of Nokia up until 2009. This practice led to the operators’ disfavor regarding Nokia which became a problem for the com- pany (Siilasmaa, 2019). Mr. Elop wrote a memo and sent it to all employees within Nokia on February 8, 2011. He de- scribed was happened to Nokia and the cell phone market since the introduction of the iPhone, as well as about the reasons why the company was performing poorly: ‘The first iPhone was shipped in 2007, and we still don’t have a product that is close to their experience, Android came on the scene just over 2 years ago, and this week they took our lead- ership position in smartphone volumes. Unbelievable.
17

We have some brilliant sources of innovation inside Nokia, but we are not bringing it to market
fast enough. […] Symbian is proving to be an increasingly difficult environment in which to de-
velop to meet the continuously expanding consumer requirements, leading to slowness in prod-
uct development and also creating a disadvantage when we seek to take advantage of new hard-
ware platforms. As a result, if we continue like before, we will get further and further behind,
while our competitors advance further and further ahead. […]

And the truly perplexing aspect is that we’re not even fighting with the right weapons. […] The
battle of devices has now become a war of ecosystems […]. Our competitors […] are taking our
market share with an entire ecosystem. This means we’re going to have to decide how we either
build, catalyze or join an ecosystem. […]

I believe we have lacked accountability and leadership to align and direct the company through
these disruptive times. We had a series of misses. We haven’t been delivering innovation fast
enough. We’re not collaborating internally.’ (Ziegler, 2011).

As the memo implies, the management team was in the process of understanding that the firm
was slowly running out of time and needed a breakthrough in order to survive. The other part of
the company was officially still not realizing it because nobody told them. However, Nokia’s em-
ployees knew that there were issues. The memo obtained positive feedback because someone
was telling them the truth (Siilasmaa, 2019).

As Mr. Elop wrote in his memo, Nokia’s management level had recognized that the company
needed to offer a good ecosystem. Since neither Symbian nor MeeGo would be successful, it had
to discuss other options regarding the OS: Android or Windows Phone. Android offered access to
the whole Android ecosystem, which was not limited to phones. On the other hand, for Android
Nokia was late and lacked experience with the OS. More importantly, Google did not need Nokia
to become the world market leader in OS. There were no signs that Google would have developed
Android in favor of Nokia. Moreover, Nokia had to sell Navteq if it wants to become a part of the
Android family because Google already had a navigation software (GoogleMaps) (Siilasmaa,
2019). On the contrary, Microsoft would adjust its OS to Nokia’s wishes. It needed, as well as
Google, manufactures for their OS since Microsoft did not produce devices for its Windows Phone
OS. However, Microsoft was not a big player in the world market. It was uncertain if the Windows
Phone would be successful. Its failure signified the end of Nokia. As opposed to this, with Android,
a failure was far less likely to happen. In the end, Nokia chose the Windows Phone which was
announced on February 11, 2011. The deal between the two companies had a duration of ten
18

years with an option for Nokia to terminate it after three and five years. It was not an exclusive
deal, meaning that Nokia was allowed to launch devices with other operating systems than Win-
dows Phone – with one exception: Android (Siilasmaa, 2019).

Although Microsoft and Nokia respected the strengths of each other, their collaboration had its
first problems shortly after the deal was made. Nokia realized that Microsoft had not as much
experience with the design of products that shall be shipped globally than the company hoped.
Nokia needed support for many languages and local applications, but the initial version of Win-
dows phone was only designed for a support of eight languages. Therefore, Microsoft was not
happy about Nokia’s demand to support more languages. However, Nokia could have known
about those issues, if it checked it thoroughly before signing the agreement. Furthermore, it ap-
peared that it was difficult to obtain the latest and thus fastest chips for the company’s new de-
vices because chip vendors preferred Android. The change of the OS was not the only major one
in 2011: Nokia’s chairman of the board, Jorma Ollila, announced to resign from his position. Risto
Siilasmaa became his successor and holds this position until today (Siilasmaa, 2019).

China was one crucial market for Nokia. The company received subsidies, which are essential in
the industry in which Nokia was operating, from Chinese cell phone operators. This changed when
China shifted from the GSM to the TD-SCDMA standards (both are radio standards which have an
impact on cellular phone modifications). Due to efforts to save costs Nokia’s management de-
cided not to invest in the TD-SCDMA standards. Consequently, the company lost a large portion
of the market to which it could sell. Moreover, the competition in the remaining market was very
tough. With the change of the standard, the mobile phone operators also changed their criteria
for subsidizing products at different price points. Whereas the Chinese manufacturers managed
to offer products which met the subsidies criteria, Nokia was not able to do the same. Therefore,
the company could no longer benefit from subsidies (Siilasmaa, 2019).

All these circumstances ended in layoffs and cost cuttings in order to survive. Already in 2009,
there were layoffs at Nokia. The D&S revenues dramatically declined, and the company searched
for ways to save costs (such as closing factories or cancel projects). Furthermore, Nokia was ‘com-
pletely surprised by the magnitude of the drop’ (Siilasmaa, 2019, p. 30). Thus, it was not prepared
to deal with the situation which made the situation worse. At this time, the company missed the
understanding why it was in this situation, why revenues were dropping and what seriously
caused its crisis. Within one year, Nokia lost 70% of its stock market value. In 2011, there was
another round of dismissals (7,000 people) that represented 12% of its workforce. Most people
who worked for Symbian were released due to its termination (Kalb, 2011; Siilasmaa, 2019). Nokia
19

introduced the so-called Bridge program which should help its laid-off employees to find new
employment opportunities. It offered five paths:

    •   Transition:

            o   attain training for a new job,

            o   study at a university or another educational institution or

            o   doing something distinctly different such as founding a nonprofit organization

    •   Innovation: establishing their own business

    •   Finding a job at another company (Siilasmaa, 2019).

The result of the Bridge program was that 60% of dismissed employees knew their next steps on
their last day at Nokia. One thousand companies were started by former Nokia employees. Those
newly founded firms helped to reduce unemployment in communities where Nokia was the major
employer by providing new jobs (Sucher & Winterberg, 2015).

Nokia also faced problems with its cash flow: The company paid its suppliers after it received the
money from its distribution channel. Since sales declined, the money came no longer from the
firm’s distributors. Nevertheless, the company needed to pay its suppliers. Therefore, Nokia’s
cash flow was negative. In January 2012, there were first rumors about Nokia declaring bank-
ruptcy. Later in that year, the rumors were no longer about if Nokia would declare but when. The
company declared its second negative profit warning within a year in April 2012. A month later,
it announced additional 10,000 layoffs and the third reduction of its earnings forecast in a little
bit more than a year (Ante, Grundberg, & Troianovski, 2012; Blodget, 2012; Siilasmaa, 2019).
Moreover, the company’s credit rating was downgraded by three rating agencies in spring 2012.
First Fitch Ratings downgraded Nokia from BBB- to BB+ in April (Savitz, 2012). Shortly after its
announcement, Standard and Poor’s did the same (Cox & Virki, 2012). One month later, Moody’s
downgraded Nokia to BA1 (Duronio, 2012). In May 2012, the firm’s share price on the New York
Stock Exchange dropped to the lowest point since March 1996 (Yahoo! Finance, n.d.). The decline
of Nokia’s share price had an impact on the share prices of its subcontractors and suppliers, mean-
ing that they sank as well (Siilasmaa, 2019).

Furthermore, the Lumia phones had quality issues, and their rump-up was still slow. Even though
the Lumia 900 had positive feedback, overall sales for Lumia were not good. When Microsoft
20 announced that the upgrade from Windows Phone 7.5 to Windows Phone 8 would mean that all apps needed to be adjusted to the new OS, the situation became worse. Applications developed for Windows Phone 8 did not work on phones with an older Windows OS. Thus, app developers decided to no longer support older operating systems than Windows Phone 8. When Microsoft announced that it would launch the Surface tablet on June 18, 2012, it forced Nokia to think about their future cooperation. There was no announcement in advance for Nokia, so the company had no heads-up. Nokia did not expect this move from Microsoft which is the reason why there was no restriction for Microsoft to manufacture devices for its OS in their agreement (Siilasmaa, 2019). Therefore, the company’s management team generated four scenarios of Nokia’s future in the smartphone market. The first scenario was about renegotiating with Microsoft in order to keep the cooperation alive. Introducing a cloud device platform based on HTML5 (an open web plat- form for which developers can create apps that are used by all browsers so they can be utilized by all operating systems) was the next scenario. Nokia had thought about this already in 2011. At that time, the company estimated it would need less than three years until such a platform was developed. Consideration of other non-Android options was the third scenario. The first three scenarios did not exclude each other, so all three could have happened at the same time. The last scenario was about moving to Android and included two options. The first option was about cre- ating an Android device internally which would have taken about 9 to 12 months. However, this was almost impossible to do for Nokia due to their agreement with Microsoft: It was not allowed to develop any Android devices for the duration of their agreement. Also, if the company had tried to develop them in secret, it was most likely that it was discovered by Microsoft or anyone else sooner or later. The other option was buying an enterprise which did already ship smartphones that are running with Android. This option would have meant automatically losing control because Nokia’s cash flow was low and its share price down (Siilasmaa, 2019). At the beginning of 2013, Microsoft and Nokia started to talk with each other about their coop- eration and its future. For this purpose, Nokia’s management level created some scenarios about the future of this cooperation and the company. Roughly summarized the first scenario plan was about Microsoft acquiring Nokia (partly or completely). The next two were about Microsoft be- coming a handset manufacturer either externally (by acquiring another handset manufacturer than Nokia) or internally (by launching a smartphone production). During the conversations the two companies had, it became clear that Microsoft did not want to start their own handset pro- duction because it would have taken too much time. However, it wanted to buy either Nokia’s
21

D&S division or another company. On April 22, 2013, there was the first round of four merger and
acquisitions discussions between Nokia and Microsoft. This first round failed due to opinions
about the valuation that were too different (Siilasmaa, 2019). With the next negotiating round,
they changed the way of how those discussions had proceeded. Instead of having a room full of
people, they decided to first discuss everything in small groups. This helped to create trust be-
tween the two companies. However, also this round was not successful. Nevertheless, both com-
panies managed to negotiate a deal in June. The deal only needed to be approved by the enter-
prises’ boards. This time the deal was off because Microsoft’s board rejected it. At the same time,
Microsoft informed Nokia that it would not buy another handset manufacturer. So, the only op-
tion was to start another round of negotiations. On July 21, 2013, there was a deal containing the
sale of Nokia’s D&S division together with all required licenses for €5.44 billion (Siilasmaa, 2019).
The deal was announced on September 3, 2013, and the global press reacted positively about it.
Stephen Elop decided to move to Microsoft after the deal was closed. Except for one, all top
leaders of the D&S department followed him. The day before the announcement of the deal, Mr.
Siilasmaa was appointed interim CEO of the new Nokia. Additionally, to the approvals of the
boards of both companies, the major countries, in which they operated, had to give their con-
sents. The deal should have been closed on January 31, 2014. Due to problems in China regarding
the receipt of approval for the deal, it finally was completed on April 25, 2014 (Siilasmaa, 2019).

Besides the Microsoft deal, Nokia made another deal with Siemens about NSN. In spring 2013,
after the joint venture contract ended, Siemens announced that it wants to sell its share. In the
beginning, NSN was a money-losing company, but at the time of the announcement, it seemed
like NSN turned the corner. In 2009, Nokia and Siemens spent €250 million each to NSN in order
to ensure its survival. Three years later, both companies agreed to invest another €500 million
each. Together with the €1.5 billion from a revolving credit facility, they approved the plan to
restructure NSN. In the same year, Nokia’s board constituted a committee which analyzed NSN.
It developed several plans for selling NSN. All of them involved to buy out Siemens for which
Nokia needed an investor. The next step was about merging with ALu, a French publicly listed
company, which is one of NSN’s competitors in the wireless infrastructure industry. In June 2013,
Nokia’s board and management decided to buy Siemens’s shares if they are willing to sell it at a
reasonable price. They agreed that Nokia would pay €1.2 billion in cash for the shares. In addition,
Siemens loaned the missing €0.5 billion to Nokia. So, NSN was entirely owned by Nokia. The deal
with Siemens had a positive impact on Nokia’s share price: it increased by 5%. Later, Nokia man-
aged to persuade Microsoft to finance its deal with Siemens. NSN will become the core of the
You can also read