"Natural" New Products and Brand Distribution - Marketing ...
←
→
Page content transcription
If your browser does not render page correctly, please read the page content below
Marketing Science Institute Working Paper Series 2020
Report No. 20-132

"Natural" New Products and Brand Distribution

Mitchell C. Olsen, Frank Germann, Meike Eilert

 "Natural" New Products and Brand Distribution” © 2020
 Mitchell C. Olsen, Frank Germann, Meike Eilert

MSI working papers are distributed for the benefit of MSI corporate and academic members
and the general public. Reports are not to be reproduced or published in any form or by any
means, electronic or mechanical, without written permission.

Marketing Science Institute Working Paper Series
"Natural" New Products and Brand Distribution

                                                Mitchell C. Olsen*
                                            Mendoza College of Business
                                             University of Notre Dame
                                            Notre Dame, IN 46556 USA
                                                 molsen2@nd.edu

                                                 Frank Germann
                                            Mendoza College of Business
                                             University of Notre Dame
                                            Notre Dame, IN 46556 USA
                                                fgermann@nd.edu

                                                 Meike Eilert
                                   Gatton College of Business and Economics
                                            University of Kentucky
                                          Lexington, KY 40506 USA
                                               mei224 @uky.edu

                                                   July 31, 2020

*Corresponding Author

The authors are thankful for the constructive comments and suggestions provided by Peter
Ebbes, Shankar Ganesan, Rajdeep Grewal, John Sherry, Joel Urbany, and Rich Williams. They
also thank Natalie Chisam, Jake Eberhart, Erin Jackson, Daniel Kilcullen, and Melanie Langan
for their research support. The authors appreciate data from Information Resources Inc. All
estimates and analyses in this paper based on Information Resources Inc. data are by the authors
and not by Information Resources Inc.

Marketing Science Institute Working Paper Series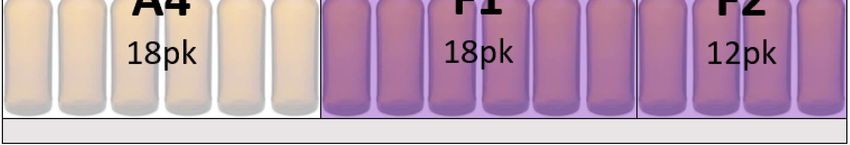
"Natural" New Products and Brand Distribution

Research Summary
Grocery retailers are investing in "natural" product offerings to compete for shoppers. At the
same time, many brands' new product offerings claim to be "natural." Such new products appear
to be congruent with retail customers' goals. However, the term "natural" is not regulated by any
U.S. government agency. Uncertainty remains regarding what "natural" implies to the
marketplace and the value it brings to interorganizational exchange between brands and their
retail customers. We investigate these issues with a multimethod approach involving in-depth
qualitative interviews with 30 managers possessing extensive category management experience,
secondary data compiled from 628 brands' new product introductions across 18 consumer
packaged goods categories over 11 years, and primary data from a survey-based experiment
collected from 101 managers involved with category management.

Results indicate the extent to which a brand is using retailer shelf space productively can
determine whether the relationship between a brand's "natural" new product introductions and
brand distribution is positive or negative. Category managers find the term "natural" is difficult
to evaluate - especially in non-food categories. They navigate this uncertainty by turning to
brands' "shelf space productivity" (i.e. the brand's category sales contribution relative to its
share of in-store shelf space) as a critical decision-making heuristic. If a non-food brand is using
its shelf space productively, it is in position to gain access to greater overall distribution by
focusing on "natural" new products. However, if a non-food brand is underutilizing its shelf
space, category managers perceive the brand's focus on "natural" new products as more
opportunistic, which lowers their trust in the brand's use of the claim. This distrust ultimately
results in a larger withdrawal of the brand's access to retailers' distribution resources than had
the brand focused more on non-"natural" new products.

These results suggest non-food brand managers should proceed with caution when considering
whether their new products will focus on "natural" (vs. non-"natural") offerings. It may seem
"natural" products can only help -- 0r at least not hurt-brand distribution. However, we find
"natural" claims can be detrimental to distribution if the brand underutilizes its in-store shelf
space. It is difficult for brands to escape downward performance spirals, and emphasizing
"natural" claims seems to accelerate the descent for unproductive non-food brands.

As part of our analyses, we also propose, validate, and use a novel and straightforward measure
that category managers and brand managers will find useful for estimating brand shelf space and
shelf space productivity.

Keywords: Natural new products, natural claims, shelf space, productivity, brand distribution

                                            Olsen, Germann, and Eilert 12
Marketing Science Institute Working Paper Series
Many consumers say they look for products specifically labeled "natural" while grocery
shopping (Consumer Reports 2016; Schmansky 2019). Consumers expect natural offerings to be
available wherever they shop, and grocery retailers of all formats consider "natural" products a
necessary component of their strategy to compete effectively in the marketplace (Research and
Markets 2017; Sweeney 2019). Evidence suggests "natural," "all natural," or "100% natural"
(hereafter "natural") is a widely-encountered claim in supermarkets (e.g., Rock 2016; Rozin et
al. 2004). For instance, prominent in-store signage touting the availability of "natural" product
options is readily observed in mainstream grocers such as Publix and Kroger, as well as price-
focused supercenters like Walmart. The "natural" claim, specifically, is unique among product
claims given its widespread use across product categories (e.g., Levinovitz 2020).
Grocery retailers' interest in "natural" products offers a seemingly promising opportunity
for their brand partners to supply new products explicitly making the claim. Suppliers are
dependent on distributors for access to scarce resources (e.g., Lusch and Brown 1996), and
research suggests no retailer-supplied1 resource is more valuable to brands' overall performance
than distribution (e.g., Hanssens, Parsons, and Schultz 2001; Srinivasan, Vanhuele, and Pauwels
2010; Wilbur and Farris 2014). Interorganizational exchange tends to increase when a supplier's
efforts are congruent with the buying organization's goals (e.g., Wathne and Heide 2000). For
brands looking to increase overall distribution, the decision to focus on "natural" (vs. non-
"natural") new products2 therefore may offer an appealing opportunity to engage in a behavior
congruent with a goal shared across retailers.
However, despite its broad usage, the term "natural" is not regulated by any U.S.
government agency, and uncertainty and skepticism remain regarding what "natural" implies to
1
We will often refer to supermarket or grocery retailers simply as "retailers" in the remainder of the manuscript.
2
We examine the degree to which a brand's new products are composed of " natural" products relative to the rest of
the category. For instance , we measure ''Natural New Product Prevalence" in Study 2 as the proportion of"natural"
new products launched by the focal brand relative to other brands in the category.
Olsen, Germann, and Eilert 13
Marketing Science Institute Working Paper Seriesthe marketplace (e.g., Dewey 2017). Retailers make their own evaluation of brands' use of the
"natural" claim to avoid misleading their shoppers. Moreover, "natural" products still comprise
only a minority of sales in most categories (IRI and SPINS 2020; Nielsen 2019), possibly
discouraging retailers from increasing distribution to all brands touting natural product offerings.
The aforementioned issues motivate our investigation into three research questions:
1) Does a brand's focus on "natural" (vs. non-"natural") new products relate positively
to brand distribution?
2) Can focusing on "natural" (vs. non-"natural") new products relate to higher levels of
distribution for some brands and lower levels of distribution for others?
3) Why may some brands' "natural" new product introductions result in lower overall
distribution (i.e., what is the underlying mechanism)?
We investigate these questions in three studies using a multimethod approach involving
qualitative interviews , secondary data, and an experiment. In Study 1, we conduct in-depth
qualitative interviews with 30 managers possessing extensive category management experience
in the U.S. grocery industry to understand how category managers (i.e., the retail employees
directly responsible for making brand-level distribution decisions) make distribution decisions
and whether they view "natural" new products differently than those not marked "natural."
Findings indicate "natural" new products are viewed as uniquely important to retailers and are
associated with distinct evaluations and brand distribution outcomes. Category managers suggest
the "natural" claim is more difficult to evaluate for new products in non-food categories than
food categories. To aid decision-making, they consider the non-food brand's category sales
contribution relative to its share of in-store shelf space (i.e., shelf space productivity).
We examine the interviews through the lens of exchange theory to propose formal
hypotheses, which we investigate in Study 2 by analyzing new product introductions from 628
brands across 18 categories in the U.S. grocery channel over an 11-year period. Results from
Study 2 demonstrate that if a non-food brand uses retailers' shelf space resources productively, it
is in position to gain more overall distribution by focusing on "natural" (vs. non-"natural") new
Olsen, Germann, and Eilert 14
Marketing Science Institute Working Paper Seriesproducts. However, managers of unproductive non-food brands face a paradoxical challenge: By
focusing on the kind of new products their retail customers presumably want (i.e., "natural"
products), they risk losing more access to distribution resources than they would if they focused
more on non-"natural" new products. Thus, although it may seem that "natural" products are
congruent with retailer goals and can only help-or at least not hurt-brand distribution, we find
evidence of a "dark side" to emphasizing the "natural" claim.
Study 3 examines why shelf space productivity plays a significant role in determining
whether a non-food brand's "natural" new product efforts ultimately prove beneficial or
detrimental to brand distribution. We conduct an experiment with 101 managers involved with
category management to examine the underlying mechanism driving distribution outcomes for
brands making "natural" offerings prevalent among their new product introductions. We find
category managers perceive unproductive non-food brands focused on "natural" new products as
more opportunistic, which lowers their trust in the brand's use of the claim. This distrust
ultimately results in a larger withdrawal of the brand's access to retailers' distribution resources.
Our research makes three primary contributions to marketing theory and practice. First,
our findings contribute to the literature on "natural" products by examining their association with
an interorganizational-level outcome. Research on the "natural" product claim tends to examine
its consumer-level effects (e.g., McFadden and Huffman 2017; Rozin 2005), which is consistent
with the consumer-level focus of the broader literature on "green," or environmentally friendly,
claims (e.g., Lin and Chang 2012; Luchs et al. 2010; Olsen, Slotegraaf, and Chandukala 2014).
However, outcomes related to interorganizational exchange, such as brand distribution, have
received little attention. For brands relying on external channel partners, it is critical to
understand how retailers may react to brands' "natural" new product strategies. We demonstrate
there are unique channel-level considerations influencing whether, how, and why the "natural"
claim influences brand distribution - both positively and negatively.
Olsen, Germann, and Eilert I 5
Marketing Science Institute Working Paper SeriesSecond, we add to distribution research by examining how "natural" new products serve
as an antecedent to brands' overall distribution. Among the four pillars of the marketing mix-
product, price, place, and promotion-place (i.e., distribution) is arguably the most important
contributor to sales and market share (e.g., Wilbur and Farris 2014). Yet, distribution's
antecedents are "substantially under-researched" (Ataman, Mela, and van Heerde 2008, p. 1051).
Understanding drivers of retailer distribution decisions is particularly important when new
product performance is uncertain (Kaufman, Jayachandran, and Rose 2006), as it is for "natural"
new products. Our multimethod approach includes in-depth qualitative interviews with retail
category managers, thereby providing a rare first-person perspective from managers who exert
significant influence in industry. The interviews shed light onto category managers' decision-
making process, including the finding that shelf space productivity is one of the most important
factors category managers consider when making brand-level distribution decisions.
Third, we contribute to research and practice relying on estimations of brands' shelf
space productivity. The calculation of shelf space productivity is straightforward with access to
internal store planograms and sales data. However, obtainining store-specific planograms from
all stores in a trading area, including competitive retail banners, is typically unrealistic for
researchers. We propose, validate, and use a novel measure for estimating shelf space and shelf
space productivity. Our measure relies only on store scanner data and a common size metric
(e.g., ounces) within a category.
In the balance of the paper, we first provide further background on the "natural" claim
and the role of distribution in the brand-retailer exchange. We then present results from our
qualitative interviews (Study 1) to better understand the "natural" phenomenon from category
managers' perspective. We consider insights from the interviews through the lens of
interorganizational exchange theory before investigating our hypotheses with secondary data
Olsen, Germann, and Eilert 16
Marketing Science Institute Working Paper Series(Study 2) and an experiment (Study 3). We conclude with a discussion of our findings'
contribution to marketing theory and practice.
CONCEPTUAL BACKGROUND
The meaning of the term "natural" is open to interpretation. Consumers tend to assume
"natural" products are more environmentally friendly, healthier, and better than products without
the designation (Levinovitz 2020; Rozin 2005). However, definitions vary (Evans, de
Challemaison, and Cox 2010; Rozin, Fischler, and Shields-Argeles 2012), and confusion remains
when the "natural" claim is encountered on products in daily life (Anstine 2007). Researchers
argue the confusion results at least partially from companies' use of the claim across a variety of
products and with a diverse set of definitions (McFadden and Huffman 2017).
Manufacturers are not restricted to a narrow use of the word "natural." Since 1991, the
U.S. Food and Drug Administration (FDA) has maintained an informal policy stating "natural"
means "nothing artificial or synthetic (including colors, regardless of source) is included in, or
has been added to, the product that would not normally be expected to be there" and notes "the
term 'natural' is used on a variety of products to mean a variety of things" (US-HHS-FDA
2015). Retail category managers therefore must form their own evaluations of individual brands
claiming to offer "natural" products.
The "natural" claim has been consistently observed over many years (e.g., Rock 2016;
Rozin et al. 2004). Natural products are a specific focus within the grocery retail industry, where
market research firms consider them a unique class of products worth examining across all
category types (e.g., IRI and SPINS 2020) and retailers view them as distinctively important to
store-wide assortment decisions (e.g., Johnsen 2018).
We confirm the "natural" claim's wide use in our sample of secondary data (see Study 2)
by conducting a descriptive analysis across food and non-food product categories (see Appendix
1 for results). While its prevalence varies across categories, "natural" is the most frequently
Olsen, Germann, and Eilert 17
Marketing Science Institute Working Paper Seriesinvoked among the 32 green claims identified by Olsen and colleagues (2014) in the Product
Launch Analytics (PLA) database . "Natural" is the most widely used green claim across both
food and non-food categories, with 34.56% and 22.02% of all new products in the categories
making the claim. Indeed, "natural" is a product claim that deserves specific examination
because it (1) appears to be the most common route to going green at the product level, (2) is
commonly used across virtually all types of product categories, unlike other claims, and (3) is
not a clearly defined term, thereby presenting brands and their customers with a claim that is
simultaneously flexibile and ambiguous.
While several studies examine the consumer-level implications of green products (e.g.,
Lin and Chang 2012; Luchs et al. 2010; Olsen et al. 2014), little research examines green new
products' association with access to key resources in a business-to-business exchange. Vertical
exchange relationships, such as between retailers and brands, can be economically significant for
both parties (e.g., Jap and Anderson 2003). By examining how a brand's emphasis on "natural"
(vs. non-"natural") new products is associated with brand distribution, we focus on an exchange
outcome of significant importance for both retailers and brands. For retailers, distribution
decisions are critical, as allocation can determine the success or failure of a retailer (e.g., Bloom,
Gundlach, and Cannon 2000). For brands, distribution is arguably the most valuable resource to
which a retailer can provide access (e.g., Wilbur and Farris 2014).
While all four elements of the marketing mix are critical, researchers contend distribution
(i.e., place) is the most important determinant of brand sales and market share (e.g., Hanssens et
al. 2001; Srinivasan et al. 2010). Ataman et al. (2008) report 63% of a new brand's market
potential is explained by distribution. Still, research remains scarce on distribution relative to the
other marketing mix elements, especially with respect to the antecedents of distribution. Extant
research examines retailer adoption of individual new products (Kaufman et al. 2006;
Montgomery 1975; Rao and McLaughlin 1989). At the brand level, prior work examines the
Olsen, Germann, and Eilert 18
Marketing Science Institute Working Paper Seriesrelationship between distribution and market share (e.g., Wilbur and Farris 2014) as well as how
new brands' distribution evolves over time (Bronnenberg and Mela 2004).
While it is critical to understand how new brands survive infancy, it is also important to
consider how brands thrive as marketplace incumbents. A significant portion of managers work
with established (i.e., incumbent) brands and must navigate extant exchange relationships with
retail customers. Our research context therefore focuses on a relevant exchange outcome (brand-
level distribution) between incumbent brands and retailers and how it is associated with the
brand's decision to emphasize "natural" (vs. non-"natural") new products.3
STUDY 1: CATEGORY MANAGER PERSPECTIVE ON "NATURAL"
Design and Execution
To gain a greater understanding of the brand-retailer exchange and how "natural" new
products may influence the level of that exchange in the form of brand distribution, we first
identified the issue's key components from a managerial perspective (e.g., Ulaga and Eggert
2006; Flint, Woodruff, and Gardial 2002). We conducted semi-structured in-depth interviews,
allowing respondents to more fully share their opinions and idiosyncratic experiences (Belk,
Fischer, and Kozinets 2013). The results formed a basis for identifying relevant theory,
developing hypotheses, and conducting quantitative analyses.
Employing a triangulation approach, we conducted 30 semi-structured, in-depth
interviews with U.S.-based informants possessing extensive experience in at least one of the
following areas:4 category management responsibilities for a grocery retailer (20 respondents),
senior executive with direct or indirect oversight of category management for a grocery retailer
3
Although luxury brands usually pursue an exclusive distribution strategy where only a select number of retailers
are allowed to carry the brand (e.g., Rolex watches) , most CPG brands (e.g., Heinz ketchup) pursue an intensive
distribution strategy, where they seek to maximize availability across retailers.
4
The total across the three areas of experience, 43, was greater than the number of interviews, 30, because some
individuals had experience in multiple areas. For example, one manager we spoke with was formerly a category
manager at a grocery retailer before moving into her current role as a category captain for one of her manufacturer's
retail customers.
Olsen, Germann, and Eilert I 9
Marketing Science Institute Working Paper Series(11 respondents with positions at the director, vice president, or C-suite level), and brand
partners working with category management teams to make distribution decisions, primarily
from a "category captaincy" position (12 respondents). The approach enabled us to cross-check
responses from different perspectives, providing a more complete and accurate understanding of
retailers' brand-level distribution decision-making processes. Table 1 provides an overview of
participant characteristics.
Participants were identified and contacted in one of two ways. The first involved
searching for managers on Linkedin with experience in one of the three areas described and
sending them interview requests. The approach yielded 18 phone interviews. For the second, we
attended a major North American grocery industry trade show and approached attendees with
relevant experience, yielding 12 face-to-face interviews. Across both efforts, we ensured a
nationally representative sample of firm sizes, headquarters locations, and product category
perspectives. Collectively, our respondents had direct responsibility managing virtually all
categories found in a typical supermarket. Across the sample, respondents had direct experience
working for at least 35 different grocery retailers. Interviews were recorded with handwritten
notes and lasted an average of 0.75 hours (range: 0.25-1.75 hours).
Each interview consisted of three sections. We first asked respondents to describe their
current and past work responsibilities, functions, and product category experience. The purpose
was to understand the individual's relevant experiences and inform subsequent questioning. In
the second section, we asked respondents about the most important factors influencing whether
and to what extent a brand's overall distribution level would increase or decrease at their retailer.
The purpose was to determine critical brand-level distribution drivers as well as the formal and
informal processes used to make distribution decisions.
Each interview's third section asked respondents about their thoughts on new products
making the "natural" claim and brands focused on "natural" new product introductions.
Olsen, Germann, and Eilert 110
Marketing Science Institute Working Paper SeriesParticular attention was given to whether category managers evaluate "natural" new products
differently than non-"natural" new products and why, the role "natural" products play in the
store, and whether "natural" new products are evaluated differently in some categories compared
to others. The purpose was to understand managers' genuine thoughts and opinions about the
"natural" claim and how they evaluate brands when "natural" (vs. non-"natural") new products
are prevalent. In all sections, questions were carefully phrased in a nondirective and unobtrusive
manner to avoid influencing responses through "active listening" (McCracken 1988, p. 21).
Our interview analysis was guided by a grounded theory approach (Glaser and Strauss
1967) and involved a constant comparative method (Spiggle 1994). After each interview, we
assessed thematic patterns and, following a hermeneutic circle of understanding (Dilthey 1957;
Schleiermacher 1998 I 1838), compared subsequent responses to previous interview data and
interpreted the results. We report results and thematic patterns from the qualitative interviews in
an order and structure germane to our research context.
Findings
Evaluating "natural" new products. In our interviews, managers indicated they typically
conduct a full review of any category once per year. Retailers scrutinize each brand's
assortment-level during the reviews and make new brand allocation decisions that are
implemented in a full category reset across their stores following the review. The reviews are
usually months-long, intensive exercises in which category managers forecast how well each
brand will perform going forward. Managers said brands' new products play an important role in
the forecasts. They also stressed new product performance is difficult to assess. New products
generally are risky, as evidenced by their high failure rates (e.g., Urban and Hauser 1993).
Managers unanimously said "natural" new products are more difficult to evaluate than
non-"natural," or conventional, new products. Several managers said products making the
Olsen, Germann, and Eilert 111
Marketing Science Institute Working Paper Series"natural" claim are considered "specialty items" and undergo different evaluations than
equivalent non-"natural" products. As one category manager stated,
"Natural products are evaluated differently ...[they} demand an extra consideration
compared to other types of products. "
Respondents gave two separate reasons for "natural" new products' special consideration.
The positive and negative considerations were counterbalanced against each other when retailers
made distribution decisions: (1) "natural" product offerings are important to the store, but (2a)
"natural" products are difficult to evaluate because their market saturation point is unknown and
(2b) the claim's meaning is undefined.
All respondents said "natural" offerings play an important role in their stores' strategy.
One C-level executive said "natural" offerings are a "big priority, " while a category manager
with experience at five different retailers said:
"I can say with 100% certainty ...'Yes!' Huge trend overall ...all categories are trying to
hit on it to some degree...Everyone [referring to grocery retailers] is trying to hop on the
'natural' trend in some way or form. "
Many managers said the "natural" segment has been a source of growth across their
stores for some time. This common theme was articulated by an executive:
"'Natural' is still a relatively small portion of most category sales, but it's a very fast
growing segment. Therefore, retailers see this as an area where they need to lean in and
invest ."
Several managers used similar phrasing regarding the "need to lean in" and "get ahead"
of the trend on "natural" products, indicating the items may offer an opportunity for brands to
expand distribution by aligning themselves with a retailer goal. Indeed, exchange theory asserts
goal-congruent activities are beneficial for channel relationships (e.g., Wathne and Heide 2000).
Category managers in our sample also stressed the need to tread carefully on where and
to what degree their retail outlets' assortment leans into "natural" in a given category. One
category manager explained,
Olsen, Germann, and Eilert 112
Marketing Science Institute Working Paper Series"['Natural'] is where trends are going...[However] as much as we want to bring those
['natural 'products] in, we only have so much shelf space and have to consider the
opportunity cost with what they'd replace ...There 's just a ton of those ['natural'] options
out there, so we need to be selective ...they're riskier ...what their longterm presence will
be [in terms of their market potential] is still unknown ...There's a lot of risk involved in
determining how big of a bet you should place on 'natural'. "
Retail managers consistenly said they were uncertain about the degree to which they
should invest in "natural" offerings, and category managers were skeptical of the term itself.
Virtually all (95%) category managers indicated awareness that the "natural" claim is
unregulated, and the FDA allows it to be used in a variety of ways. According to one category
manager, " There are no guidelines given for 'natural, 'so those products are more difficult to
evaluate. Other claims are more clearcut. " Another category manager said, "It's a marketing
ploy on their [i.e., the brand's] side." Several others offered similar sentiments: " [' Natural ' is] a
tough one. It's not regulated. "
Food and nonfood categories. Our interviews indicated retailers view "natural" offerings
as a source of opportunity and frustration. Category managers believe "natural" products are
important for their stores' marketplace strategies, but they are also wary of "natural" products
and brands' use of the claim. A category manager for a large regional grocer groaned when
asked her thoughts about the "natural" claim before saying, "That one really gets me. That's
where the claims can really get crazy ...I've seen a lot [of products claiming to be 'natural']
come in...I think that 's a very loose term. " The manager then referred to her past experience in
food and non-food categories as context for a clarification question indicating a distinction
should be made between food and non-food categories. "Are you talking about food or nonfood
categories? Because that makes a difference. When I managed [food categories], I really paid
attention to the ingredients [which helped me determine the validity of the claim]. In nonfood,
it's more difficult. It's tough to understand what's meant by that claim. " In other words, whether
Olsen, Germann, and Eilert 113
Marketing Science Institute Working Paper Seriesthe "natural" claim is made in a food or non-food category plays a central role in the extent to
which it can be verified and understood by the retailer.
The sentiment was echoed in other interviews. A category manager from a large grocer
based in the U.S. South said, "For consumers, 'natu ral ' is a vague term, so their expectations
are important, and ...those expectations vary between food and nonfood categories when it
comes to products being 'natural. '"
Several managers expressed confidence in their ability to diagnose the validity of a food
product's "natural" claim. In line with research finding individuals think of food and beverages
as inherently natural (Rozin et al. 2012), respondents said food products are expected to be
natural whether they carry the claim or not.
In contrast, research shows non-food items do not necessarily carry the same connotation
(Luchs et al. 2010; Rozin et al. 2004). Andre and colleagues (2019) note "naturalness" represents
the absence of human intervention, which aligns poorly with scientifically developed and
manufactured non-food product categories. Indeed, it is difficult to visualize products like
window cleaners in a state free of human intervention. Due to the ambiguity surrounding the
"natural" claim in non-food categories, we focus our subsequent reporting on how category
managers engage in sensemaking of non-food brands' use of the claim while evaluating the level
of distribution resources they will lend the brands going forward.
Our interviews further indicated category managers use additional information when
evaluating non-food brands' "natural" new product emphasis. The responses were consistent
with research finding decision makers are averse to uncertainty (Kahneman and Tversky 1979)
and will apply decision heuristics to grapple with the uncertainty of another organization's future
behavior and performance (Montgomery, Moore, and Urbany 2005). One category manager
offered a representative explanation, saying she relies on the brand's "performance to make the
call" when evaluating a non-food brand's "natural" new products.
Olsen, Germann, and Eilert I 14
Marketing Science Institute Working Paper SeriesWhile brand performance can be measured in a number of ways, our interviews found
category managers believe one metric is most important when adjusting a brand's overall
distribution level-specifically, how well is the brand using its current in-store shelf space?
Shelf space productivity and nonfood brands' "natural" new products. Respondents
across the board said how well a brand contributes to overall category sales, given the relative
amount of shelf space it occupies, is a key consideration for brand-level distribution decisions.
The metric was commonly referred to as "shelf space productivity" and "space to sales"
(hereinafter "shelf space productivity" or "productivity"). An overwhelming majority of
respondents volunteered the metric as critical to category assortment decisions, saying: "Number
one is the brand's 'shelf space productivity'" and "[Shelf space productivity} is the driving force
behind how we set storelevel planograms. "
Respondents suggested shelf space productivity is used as a standardized performance
measure for comparing brands in a given category. Unproductive brands hold a greater
percentage of category shelf space than sales, and our interviews suggested the brands' overall
assortment would likely be lowered to resolve this type of imbalance. Conversely, brands with a
relatively low share of category shelf space relative to sales would see an increase in overall
assortment, ceteris paribus. To maximize overall category performance, adjustments are made to
a typically "zero sum game" with respect to the category's total allowable assortment size within
stores. A category manager explained, "There's only so much shelf space, so you really have to
prioritize [brands based on how well they are doing on the metric}. " Another category manager
said: "It's very important, because that shelf space is very costly. Your category is landlocked. "
Our interviews suggested category managers rely heavily on shelf space productivity
when evaluating a brand's overall distribution going forward. We therefore hypothesize:
H1: A brand's shelf space productivity is positively associated with overall brand distribution.
Olsen, Germann, and Eilert I 15
Marketing Science Institute Working Paper SeriesQualitative Insights through Exchange Theory
The language used by respondents strongly suggested exchange theory as an appropriate
lens for providing structure to their comments in our research context. Interviews suggested
category managers may be wary of opportunistic behavior among brands launching "natural"
new products. The observation points toward a key issue in interorganizational exchange theory,
where opportunism is defined as "self-interest seeking with guile" (Williamson 1975, p. 255).
While retailers can expect all brand partners to be self-interest seeking, their behavior extends
into opportunism only when their actions are perceived to be the result of calculated efforts to
mislead. Transaction cost economics often conceptualizes opportunistic behavior in "blatant" or
"strong form" manifestations (Masten 1988; Wathne and Heide 2000) clearly violating explicit
contracts. However, emergent conceptualizations argue opportunism can occur in weaker forms,
such as violations ofrelational contracts (e.g., Wang, Kayande, and Jap 2010; Wathne and Heide
2000). Moreover, brands can engage in active and passive forms of opportunism, characterized
as opportunism by commission or omission (e.g., Seggie, Griffith, and Jap 2013).
Our interviews indicated "natural" new products potentially constitute active
opportunism, but they are not a blatant or strong form. Introducing new products and making the
"natural" claim are self-interest seeking acts. However, due to information asymmetry between
brands and their retail customers, it is difficult for retailers to identify active attempts to mislead.
Category managers are often unsure if a brand is using the undefined, and hence ambiguous,
"natural" claim in a way the retailer and its customers may perceive as misleading if all
information from the brand were available. Our interviews made clear "natural" new products
are especially difficult to evaluate in non-food categories. In exchange relationships, the focal
organization (e.g., the retailer) assesses its suppliers' (e.g., brands') performance to determine
how the relationship will expand or contract going forward (e.g., Williamson 1979, 1993). As
Olsen, Germann, and Eilert I 16
Marketing Science Institute Working Paper Seriesdetailed previously, category managers rely on the brand's shelf space productivity as a decision-
making heuristic for evaluating non-food brands' "natural" new products.
Respondents indicated category managers may be wary of brands opportunistically
claiming their new products are "natural" to exploit retailers' marketwide goal of providing
natural offerings to shoppers. If the retailer perceives a brand to be opportunistic, its trust in the
brand's use of the claim is expected to erode, resulting in a reduction of access to scarce
distribution resources. Per Coleman (1990, p. 91), "situations involving trust constitute a
subclass of those involving risk. They are situations in which the risk one takes depends on the
performance of another actor."
Interview respondents suggested "natural" (vs. non-"natural") new products from
unproductive non-food brands can amplify the distribution loss otherwise experienced based on
unproductive use of retailer shelf space. When unproductive brands focus on "natural" new
products, their relatively poor stewardship of retailers' shelf space resource is expected to
increase suspicions of opportunistic behavior. In tum, the category manager's treatment of the
brand going forward may be especially harsh, as illustrated by a category manager with
extensive non-food category experience:
"If I have a brand that isn't meeting my performance expectations come to me with a
bunch of 'natural' new products, I'd think, 'C'man, it 's time to cut the crap.'I need them
to focus on actions that will start turning around their performance in my stores first. "
If a category manager evaluates a brand poorly using its shelf space resources and
perceives the brand to be engaged in opportunistic behavior, the manager may reduce exposure
to the brand with relatively drastic cuts to the offending brand's distribution. Our interviews
indicated a retailer's decision to extend distribution resources to a brand partner exposes the
retailer to vulnerability and risk. When opportunism arises in an existing channel relationship,
the offended firm holds back valuable resources from the exchange, reducing its exposure to
further opportunism from the offending firm (e.g., Jap and Anderson 2003; Williamson 1985).
Olsen, Germann, and Eilert 117
Marketing Science Institute Working Paper SeriesAs Ganesan et al. (2010) argue, opportunistic seller behavior is likely to damage a buyer's trust,
ultimately motivating the buyer to take punitive action.
However, retailers may be less likely to perceive a productive (vs. unproductive) non-
food brand's "natural" new product efforts as opportunistic, because the brand has proven itself a
good steward of a valuable retailer-owned resource. As wariness of opportunism subsides,
retailer trust in the brand's use of the claim is expected to increase, thereby increasing the
likelihood the retailer will reward the brand's goal-congruent behavior with expanded
distribution. Indeed, exchange also benefits through trust in actions taken by the other party
(Anderson and Weitz 1989; Kronman 1985). In an effort to fulfill the retailer's goal of providing
"natural" products, category managers may reward productive non-food brands' "natural" new
product efforts with distribution beyond what would have been received for non-"natural" new
products. We therefore expect productive non-food brands to benefit most from retailers'
selective investment in "natural" offerings.
In summary, productive non-food brands may benefit from "natural" new products, but
we expect to find a converse to the action for unproductive non-food brands:
H2A: For non-food brands with high shelf space productivity, emphasizing "natural" (vs. non-
"natural") new products is more positively associated with brand distribution.
H2B: For non-food brands with low shelf space productivity, emphasizing "natural" (vs. non-
"natural") new products is more negatively associated with brand distribution.
ff3: When a non-food brand emphasizes "natural" new products, high (low) brand shelf space
productivity (a) reduces (increases) perceptions of opportunistic behavior, which (b)
increases (decreases) trust in the brand's use of the "natural" claim, thereby (c) increasing
(decreasing) brand distribution.
We test H1 and H2A/B via an empirical analysis using secondary data from brands' new
product introductions (Study 2). We then conduct an experiment involving grocery industry
managers to investigate the mechanism hypothesized in H3 (Study 3).
Olsen, Germann, and Eilert I 18
Marketing Science Institute Working Paper SeriesSTUDY 2: "NATURAL" NEW PRODUCTS AND BRAND DISTRIBUTION
Data
We collect the secondary dataset from three sources. It includes new product
introductions from 628 consumer packaged goods (CPG) brands across 18 categories in the U.S.
grocery channel from 2001 to 2011. The dataset is an aggregation of scanner data from
Information Resources, Inc. (IRI), new product launch information from Product Launch
Analytics (PLA), and advertising expenditures from Kantar Media's Ad$pender database. 2,929
brand-year observations are included in our final analysis. The CPG industry offers a relevant
context, as it invests significantly in new products (Nielsen 2015). Furthermore, grocery retailers
represent a significant portion of the U.S. economy, employing about 4.8 million workers and
generating more than $363 billion in annual economic activity (Food Marketing Institute 2017).
We capture store-level activity via the IRI scanner database described by Bronnenberg,
Kruger, and Mela (2008). The dataset has been used by previous marketing researchers (e.g.,
Datta, Ailawadi, and van Heerde 2017; van Lin and Gijsbrechts 2014) and allows us to capture
weekly distribution, sales, and pricing information at the stock keeping unit (SKU) level within
individual stores. These characteristics are essential for capturing robust distribution measures
and other focal variables in our model, such as shelf space productivity and control variables.
To combine IRI and PLA data, we examine all categories tracked by both databases from
2001 to 2011. Following Datta et al. (2017), we separate ketchup and mustard into distinct
categories. The condiments are treated as separate categories in retail stores, each with its own
clearly defined shelf space - an important consideration for our research. We exclude cigarettes.
While it is a non-food category, cigarettes are inherently different from the other non-food
packaged goods categories in the dataset. We ensure all narrowly defined IRI brand names (e.g.,
Charmin Ultra Soft, Charmin Ultra Strong, Charmin Sensitive) are coded as the parent brand
(e.g., Charmin). Because we investigate antecedents to distribution among incumbent brands, we
Olsen, Germann, and Eilert I 19
Marketing Science Institute Working Paper Seriesinclude only brand-years when the focal brand records at least two years of continuous weekly
sales in the IRI dataset (Datta et al. 2017). We do not impose a market share cutoff, creating a
mix of large national brands and small niche incumbents in our study of "natural" new products.
We then collect information on new products and their claims from GlobalData's PLA,
formerly known as Productscan by Datamonitor. PLA, a subscription database tracking CPG
brands' new product introductions across a variety of categories, has previously been used in the
marketing literature (e.g., Lamey et al. 2012; Olsen et al. 2014; Sorescu and Spanjol 2008). For
category-years tracked in PLA, GlobalData offers comprehensive coverage of all brands,
regardless of market share and distribution. PLA tracks product introductions considered new
and unique by consumers. PLA does not record instances when new universal product codes
(UPCs) are issued for pre-existing products undergoing a size change (e.g., price increases are
passed along via a 'down-count'), a minor packaging update, etc. Therefore, it offers a record of
truly new additions to a brand's product line. Because PLA data are merged with IRI data, we
focus on new products introduced in the United States. Finally, we gather information on each
brand's total annual U.S. advertising expenditures via Kantar Media's Ad$pender database.
Our research focuses on the extent to which a brand's new products are composed of
"natural" (vs. non-"natural") offerings. We include brand-years meeting the following criteria:
(1) two years of continuous weekly sales, (2) new products recorded by PLA, and (3) advertising
expenditures tracked by Kantar during the study's time period. If no advertising expenses were
recorded in the focal year, we assume the brand did not advertise that year. In addition to
excluding the cigarette category, we drop two outliers. We exclude Campbell's Soup because its
product line is about two times longer than the next largest brand. We also drop Utz from 2007,
when it atypically launched more than 300 new products. We conduct robustness checks
including cigarettes, Campbell's, and Utz and obtain consistent results.
Olsen, Germann, and Eilert I 20
Marketing Science Institute Working Paper SeriesOur final dataset includes brand-year observations across the following 18 categories:
Bath tissue, beer, blades and razors, butter, cereal, coffee, deodorant, facial tissue, household
cleaners, ketchup, laundry detergent, milk, mustard, salty snacks, shampoo, soup, toothpaste, and
yogurt. See Appendix 2 for a complete list of brands in each category.
Our unit of analysis is the brand-year (i.e., annual) level, following extant research on
new product strategies (e.g., Olsen et al. 2014; Sorescu and Spanjol 2008) and our qualitative
results, which indicated the annual level is most appropriate for our context. Category managers
strategically evaluate each brand's overall distribution and the extent to which they will increase
or decrease each brands' relative distribution levels during full category reviews. Respondents
overwhelmingly indicated full reviews typically occur once per year in any given category. They
are followed by total category resets where brand-level distribution changes manifest in stores.
Table 2 provides a summary of our measures and data sources. Appendix 3 presents the
sample's descriptive statistics and correlation matrix.
Focal Variables
Brand distribut ion. We capture the full breadth and depth of brand distribution within the
dataset's trading area using IRI scanner data and a measure called total distribution points
(TDPs) (see Ailawadi and Farris 2017 for a comprehensive review of distribution measures). We
make TDPs more managerially relevant by following an emergent trend in the CPG industry, re-
expressing the measure as "equivalized SKUs" (e.g., TABS Analytics 2016). Equivalized SKUs,
essentially the weighted average number of products a brand sells in a typical store within a
market, provides a single managerially intuitive number capturing distribution breadth and depth.
Appendices 4 and 5 illustrate how it is measured and why it is conceptually preferable to
alternative measures. We measure each brand's distribution via the following formula:
.t "b _
(1) D IS n it- "n
L..k=l
(PCVitk)
100 '
Olsen, Germann, and Eilert I 21
Marketing Science Institute Working Paper SeriesWhere:
Distribit = equivalized SKUs of brand i during year t and
PCV = quarterly average% product category volume for brand i's product k over year t.
Product k is defined as a unique UPC in brand i's product line. We capture annual
distribution as the average equivalized SKU value for brand i across the year's four quarters (i.e.,
the "quarterly average"). We utilize this quarterly average during year t, as opposed to the sum or
maximum distribution achieved for any single week or quarter. By counting a product as being in
distribution if it records in-store sales during the quarter, we account for the distribution of
slower-moving SKUs in lower volume stores.
"Natural" new product prevalence (NNPP). To capture the degree to which an
incumbent brand's new product offerings consist of "natural" new products, we measure the
percentage of its new SKUs in year t making the "natural" claim. We make the calculation based
on PLA information, where the database captures a claim if it is specifically observable on the
product's packaging and/or in communications surrounding the product.
As shown in Appendix 1, "natural" claims are more common in some categories. To
account for the variation, we calculate the prevalence of "natural" new products relative to the
focal brand's category, measured as the difference between the percent of brand i's "natural"
new products and the percent of the rest of the category's "natural" new products. Potential
opportunistic behavior is evaluated relative to group norms in interorganizational exchange
relationships (e.g., Ganesan et al. 2010; Jap and Anderson 2003), and the NNPP measure
captures the extent to which a brand is emphasizing the "natural" claim more or less intensely
than the rest of the category. If 50% of a brand's new products contain a "natural" claim,
compared to 30% of new products across the rest of the category, the brand's NNPP for the year
would be .20 (i.e., .50 - .30 = .20). The focal brand's products are removed from the category
number so the naturalness of brand i's new product introductions are compared to the prevalence
of "natural" new products in the rest of the category in year t.
Olsen, Germann, and Eilert I 22
Marketing Science Institute Working Paper SeriesCategory type. We indicate whether the focal brand's product category is a food or non-
food category with a categorical dummy variable set to 1 for food categories and O for non-food
categories. Appendix 1 lists the categories by type.
Shelf space productivity. We measure how effectively a brand is utilizing its in-store shelf
space as the degree, expressed as a percentage, to which the brand over- or under-contributes to
total category sales volume given the brand's percentage of in-store shelf space, weighted by
each store's PCV.5 We use the following formula, which converts an index value of productivity
into a percentage (e.g., an index of 1.154 becomes .154; an index of .846 becomes -.154):
(2) ShelfProd-= In_Store_Category_Sales_Shareit _ l
It In_Store_Category_Shelf_Shareit '
Where:
ShelfProdit = shelf space productivity of brand i during year t;
In_Store_Category_Sales_Shareit = quarterly average% share of in-store category
volume sales for brand i over year t, weighted by each store's PCV; and
In_Store_Category_Shelf_Sharei1= quarterly average% share of total category in-store
shelf space for brand i over year t, weighted by each store's PCV.
The measure's validity is contingent on an accurate estimate of each brand's in-store
share of category shelf space. The ideal data source for the measure would be category
planograms for each store in the trading area during the 44 quarters forming the annual measures
of the time period we study. However, detailed planograms across the individual stores are
inaccessible. Therefore, we consider two alternative measures for estimating a brand's in-store
share-of-shelf using scanner data through in-store audits.
We first estimate in-store category shelf-share by calculating a brand's share of a11 unique
UPCs sold in a store over a quarter. This "share-of-SKUs" measure has previously been used to
measure brand distribution depth (e.g., Ataman et al. 2008). Our audits extend this work by
demonstrating it is also a relatively accurate estimate of actual in-store shelf space. However, we
5
We follow best practices in the U.S. grocery industry by weighting all stores by PCV whenever individual stores'
relative differences should be taken into account (e.g., not all stores are equally valuable to a brand or retailer).
Olsen, Germann, and Eilert I 23
Marketing Science Institute Working Paper Seriesargue this approach has a conceptual shortcoming, because it assumes all SKUs occupy the same
amount of space on the shelf. This is rarely, if ever, the case in actual stores. While we do not
know the number of facings each product has in each store, we can account for relative size
differences among SKUs ifwe have a common unit of measurement in each category. The IRI
scanner dataset provides a volume-equivalent measurement unit for each SKU based on size
units common to a category (e.g., all UPCs in the yogurt category are compared to a standard 16-
ounce unit, so an 8-ounce yogurt has a volume-equivalent value of .5). We can therefore account
for size differences under the assumption larger items will generally occupy more shelf space.
Consequently, we also estimate a brand's share-of-shelf by dividing the sum of its UPCs'
volume-equivalent measurement units by the sum of volume-equivalent values across all
category UPCs sold in a store during time t. We use the following equation to calculate the
quarterly average share-of-shelf for brand i across all stores g where the brand is sold in year t:
"n (L =l Vol_Eqikgt) PCVgt
(3) In_Store_Category_Shelf_Shareit = L..g=i((._,n )x--),
L..k=l Vol_Eqmkgt PCVit
Where:
In_Store_Category_Shelf_Shareit = quarterly average share of category shelf space in
stores where brand i is sold during year t;
Vol_Eqikgt = quarterly average of the sum of brand i's volume-equivalent measurement
units for all unique products k sold in store g over year t;
Vol_Eqmkgt = quarterly average of the sum of category m's volume-equivalent
measurement units for all unique products k sold in store g over year t;
PCVgt = quarterly average of the% product category volume for store gin year t; and
PCVit = quarterly average of the % product category volume for brand i in year t.
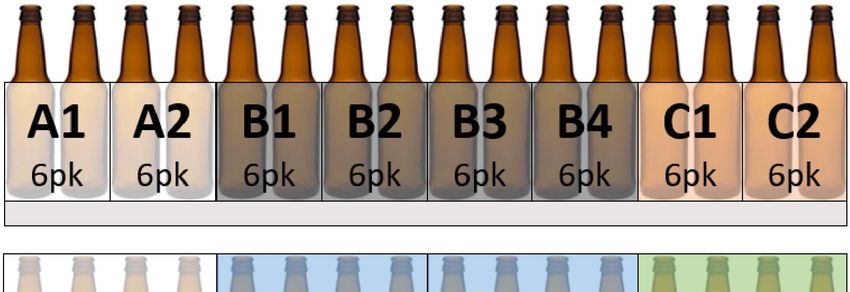
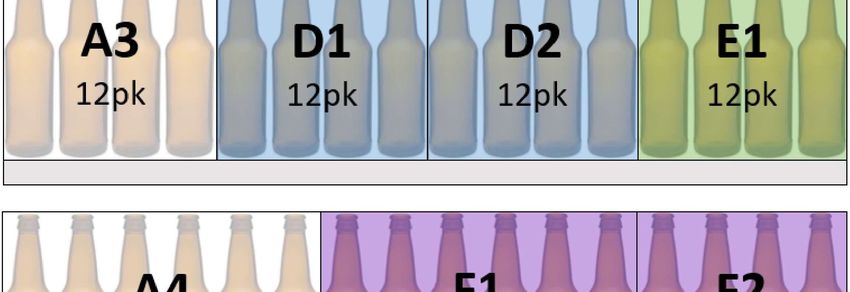
Figure 1 provides an overview for measuring the two variables in the context of an
example. The figure compares the volume-equivalent measurement approach to our alternative
share-of-SKUs estimation . In the hypothetical example, a six-pack of 12-ounce bottles is equal to
1.0 volume-equivalent measurement unit. In this category context where all SKUs also have a
single shelf facing, we have perfect alignment between the volume-equivalent measure and each
Olsen, Germann, and Eilert I 24
Marketing Science Institute Working Paper SeriesYou can also read