3RD GLOBAL CRYPTOASSET BENCHMARKING STUDY - Apolline Blandin, Dr. Gina Pieters, Yue Wu, Thomas Eisermann, Anton Dek, Sean Taylor, Damaris Njoki ...
←
→
Page content transcription
If your browser does not render page correctly, please read the page content below
3RD GLOBAL CRYPTOASSET
BENCHMARKING STUDY
Apolline Blandin, Dr. Gina Pieters, Yue Wu, Thomas Eisermann,
Anton Dek, Sean Taylor, Damaris Njoki
September 2020

                                                                supported by
Disclaimer: Data for this report has been gathered primarily from online surveys. While every reasonable effort has been made
to verify the accuracy of the data collected, the research team cannot exclude potential errors and omissions. This report should
not be considered to provide legal or investment advice. Opinions expressed in this report reflect those of the authors and not
necessarily those of their respective institutions.
TABLE OF CONTENTS

FOREWORDS...................................................................................................................................................4
RESEARCH TEAM...........................................................................................................................................6
ACKNOWLEDGEMENTS.............................................................................................................................7
EXECUTIVE SUMMARY............................................................................................................................ 11
METHODOLOGY......................................................................................................................................... 14
SECTION 1: INDUSTRY GROWTH INDICATORS.......................................................................... 17
Employment figures...............................................................................................................................................................................................................17
High-growth enterprises.....................................................................................................................................................................................................18
Financial performance of service providers...............................................................................................................................................................19

SECTION 2: MINING, THE BACKBONE OF THE INDUSTRY.................................................... 21
Hashing as a business............................................................................................................................................................................................................21
Where are we on PoW’s energy consumption?........................................................................................................................................................26
Mining pools...............................................................................................................................................................................................................................28
Mining hardware manufacturing.....................................................................................................................................................................................32
The financialisation of mining............................................................................................................................................................................................34

SECTION 3: THE OFF-CHAIN STORY.................................................................................................36
On-chain and off-chain stories ........................................................................................................................................................................................36
Off-chain cryptoassets and fiat currency support................................................................................................................................................. 37
Off-chain activity providers...............................................................................................................................................................................................39

SECTION 4: PROFILING CRYPTOASSET USERS............................................................................44
User number and activity................................................................................................................................................................................................... 44
User geography........................................................................................................................................................................................................................45
User types...................................................................................................................................................................................................................................46

SECTION 5: REGULATORY AND COMPLIANCE........................................................................... 49
Compliance benchmarks.....................................................................................................................................................................................................49
Authorisation of service providers.................................................................................................................................................................................52
AML and KYC procedures..................................................................................................................................................................................................54
Regulation impact: redefining geographies................................................................................................................................................................56

SECTION 6: IT SECURITY......................................................................................................................... 59
The development of best market practices................................................................................................................................................................59
Resources allocation to IT security.................................................................................................................................................................................60
Security audits.......................................................................................................................................................................................................................... 61
Insurance.....................................................................................................................................................................................................................................62

SECTION 7: BALANCING BETWEEN INTEGRATION AND INNOVATION........................64
Enhanced transparency and compliance.....................................................................................................................................................................64
A decoupling of functions across the value chain ...................................................................................................................................................65
The growth of ‘decentralised finance’...........................................................................................................................................................................65

APPENDIX....................................................................................................................................................... 67
Miners’ influence.....................................................................................................................................................................................................................67
Operational risks for miners..............................................................................................................................................................................................67
Additional risks for miners..................................................................................................................................................................................................68
Operational risks for service providers........................................................................................................................................................................69
Future developments............................................................................................................................................................................................................70

3rd Global Cryptoasset Benchmarking Study

FOREWORDS
     The rapid pace of innovation and increased investment in the cryptoasset industry
     is increasing the need for information analysing these developments. With the
     publication of the first edition of the Global Cryptoasset Benchmarking Study
     three years ago, the CCAF set out to progressively track and take the pulse of
     this nascent industry by transparently collecting, analysing and disseminating
     knowledge about cryptoassets. Similarly, the 3rd Global Cryptoasset
     Benchmarking Study seeks to shed light on the market dynamics of the
     cryptoasset industry since late 2018.

     The report collates data from entities operating in four main segments of the
     industry: exchange, payments, custody, and mining. A total of 280 entities
     from over 50 countries across various regions responded to the surveys. This
     benchmarking report is compiled using data from one of the most comprehensive
     and robust databases currently available in the cryptoasset industry.

     The research findings suggest that the industry has entered a growth stage
     despite the notable headwinds the cryptoasset markets had encountered since
     2018. Additionally, regulators’ collaborative dialogue and regulatory interventions
     in the industry appear to be supporting its growth by providing regulatory clarity
     and harmonisation on the treatment of cryptoassets and related activities. This
     is an important development that has had immediate effects. For instance, the
     publication of updated AML and CFT standards by the Financial Action Task Force
     (FATF) in June 2019 encouraged compliance by industry participants, with an
     increased share of the surveyed service providers performing KYC & AML checks
     on their customers.

     Nevertheless, our analysis has identified several hurdles – ranging from regulatory
     compliance, IT security, and insurance – which need to be addressed for the
     industry to grow to scale.

     Our hope is that the findings captured within this study will offer insight into the
     evolution of the industry and inform the decisions that industry stakeholders
     will face as the space matures. As with all of our research projects, we appreciate
     that our ability to produce high quality research is highly dependent on the
     cooperation of industry players and we extend our thanks to all the entities that
     have contributed towards the publishing of this report. Finally, I want to gratefully
     acknowledge the financial support of Invesco as a long-standing supporter of
     CCAF’s research and whose support made this study possible.

     Dr. Robert Wardrop
     Director
     Cambridge Centre for Alternative Finance

                                   4
3rd Global Cryptoasset Benchmarking Study

Despite the uncertainty and economic rollercoaster ride that 2020 has brought
us with the introduction of the global Covid-19 pandemic, we have learned that
even in trying times, businesses and markets have reached a critical point where
operations can sustain even a majority of their employees working remotely. Even
as the pandemic continues forward, finance still moves, and specifically alternative
finance has its place in a post-pandemic world and the research and analysis of
trends in emerging still press forward.

2020 brings us the Cambridge Centre for Alternative Finance (CCAF) third
edition of its Global Cryptoasset Benchmarking Study. In this study the CCAF
gathered data points from approximately 280 entities including representation
from 59 countries across four main market segments: exchanges, payments,
custody, and mining. While most of the data was collected prior to the pandemic,
the aggregated learnings and insights from the report remain relevant in current
times.

This year’s cryptoasset benchmarking study comes at a particularly appropriate
time for Invesco as we completed a successful asset tokenization proof of concept
(POC) this year that explores various facets of the token lifecycle including the
creation and custody chain of real asset backed tokens and how they may be
distributed and exchanged in practice in the real world. The results of the POC
validate key findings uncovered in the study in the areas of industry growth,
service providers, regulatory standards, and future outlook of cryptoassets. Our
own journey in token economics provided us with experience with third party
providers of token creation, digital token exchanges, token custodianship, and
navigating the complex legal and regulatory requirements for such an endeavor.

As we read through the study, a few highlights stood out in confirmation of our
own experiences. One notable observation was the growth patterns of full-time
equivalent (FTE) employees within the cryptoasset industry and at the firm level.
The industry saw overall slowdown in growth in employment; whereas individual
firms saw growth in FTEs indicating that while overall opportunities are shrinking,
the existing players are gaining traction and prominence within their area of
expertise. This is something we have witnessed ourselves firsthand through
the disappearance or consolidation of industry consortiums as the cryptoasset
industry sees increased participation from institutional investors and traditional
players in the financial sector.

Invesco is proud to provide sponsorship to enable the Cambridge Centre of
Alternative Finance to continue their research in alternative finance industry
including this cryptoasset benchmarking report. We’d like to thank all of the
contributors in the research team who made this report possible through
collecting and analyzing data. These ongoing reports provide valuable insights
for benchmarking in emerging financial markets and trends and scenarios that we
monitor to enable our own growth and the growth of alternative finance models in
general around the globe.

Dave Dowsett
Global Head of Technology Strategy, Emerging Technology,
and Intentional Innovation
Invesco

                             5
3rd Global Cryptoasset Benchmarking Study

RESEARCH TEAM

AUTHORS
Apolline Blandin: is a Research Associate at the Cambridge Centre for Alternative Finance and leads the
Centre’s cryptoasset research programme.
   a.blandin@jbs.cam.ac.uk                  @ApollineBlandin

Gina Pieters (Dr.) is a Lecturer at the Kenneth C. Griffin Department of Economics, University of
Chicago, and a Research Fellow at the Cambridge Centre for Alternative Finance.
   gcpieters@uchicago.edu                   @ProfPieters

Yue Wu is a Data Scientist at the Cambridge Center for Alternative Finance and helps to manage the
database and develop digital tools at the CCAF.
   y.wu@jbs.cam.ac.uk                  @ClaireYueWu1

Thomas Eisermann is a Cryptocurrency and Blockchain Research Administrator at the Cambridge
Centre for Alternative Finance and assists with the data collection process.
   t.eisermann@jbs.cam.ac.uk

Anton Dek (Dr.) is a Research Associate at the Cambridge Centre for Alternative Finance and leads
on the development of digital tools at the CCAF, such as the Global Alternative Finance Benchmark
Dashboard.
   a.dek@jbs.cam.ac.uk                  @dektox

Sean Taylor is a Research Intern at the Cambridge Centre for Alternative Finance and is currently
pursuing a B.A in Entrepreneurship and Innovation at Lund University School of Economics and
Management.

Damaris Njoki is a Research Intern at the Cambridge Centre for Alternative Finance and a PhD student
at the University of Huddersfield.
   d.njoki@jbs.cam.ac.uk

Other contributors include Felipe Ferri de Camargo Paes, Hatim Hussain, Steven Edwards,
Karim Nabil, Sean Stein Smith, Michel Rauchs, Bryan Zheng Zhang, and Nikos Yerolemou.

                                                   6
3rd Global Cryptoasset Benchmarking Study

ACKNOWLEDGEMENTS
The Cambridge Centre for Alternative (CCAF) would like to thank Invesco for sponsoring the research
study, and specifically Dave Dowsett, Kevin Lyman, Henning Stein, Bradley Bell, and Heather Wied for
their continuous support throughout the research process.

We would also like to extend our gratitude to our research partners from the different regions. Without
the help of these industry associations, our survey dissemination would not have been possible. These
research partners were: Association pour le Developpement des Actifs Numeriques (ADAN), Asociación
Bitcoin Chile, Asociación FinTech Paraguay, Asociación FinTech Uruguay, Associação Brasileira de
Criptoeconomia (ABCripto), Association of Cryptocurrency Enterprises and Startups Singapore
(ACCESS Singapore), Bitcoin Argentina, Blockchain Nigeria User Group, Blockchain Ukraine Association,
Coin Center, Colombia Fintech, Crypto Valley Association, Fintech Mexico, Global Digital Finance (GDF),
German Blockchain Association, MinerUpdate, National Association of Blockchain and
Cryptotechnologies, SA Crypto, Thai Fintech Association, The Bitcoin Association of Hong Kong.

                                              C

We greatly appreciate the help of the following media organisations, whose role was instrumental to
successfully disseminate our surveys and research: 8btc, ChainNews, CoinDesk, MinerUpdate and the
CryptoTool podcast.

We are also grateful to CryptoCompare for supplementing our survey data with additional data that
underpin their annual Exchange Benchmarking Report. We acknowledge their contribution wherever
applicable throughout the report.

We would also like to thank the entire CCAF team, especially Robert Wardrop, Raghavendra Rau, Hunter
Sims and Herman Smith, for their support. Special thanks go to Louise Smith for her fantastic design
work, as well as Kate Belger, Yvona Duncan, and Neil Jessiman for their hard work behind the scenes.

                                                  7
3rd Global Cryptoasset Benchmarking Study

In addition, we wish to thank Philippa Coney and Charles Goldsmith from the Cambridge Judge Business
School for their assistance in producing and publishing the report.

Finally, we would like to express our utmost gratitude to all survey respondents from across the globe
who participated in the surveys. Their contribution is core to the realisation of this study.

Note: some survey respondents prefer not to publicly disclose their participation.

                                                                                       RGB

                                                                           сhilkoot

                                                        8
3rd Global Cryptoasset Benchmarking Study

MININGSTORE

              9
3rd Global Cryptoasset Benchmarking Study

10
3rd Global Cryptoasset Benchmarking Study

EXECUTIVE SUMMARY
Over the past three years, the Cambridge Centre for Alternative Finance (CCAF) at the University of
CambridgeJudge Business School, has tracked and analysed the development of the global cryptoasset
industry. Since the publication of the 2nd Global Cryptoasset Benchmarking Study in December 2018,
the industry has undergone significant changes: the 2017-2018 initial coin offering (ICO) bubble
has sparked closer scrutiny from regulators resulting in greater efforts with regards to regulatory
compliance, while new professional infrastructure and services have emerged to serve the increased
interest from institutional investors. Mining analysts, for their part, have suggested that financial
engineering is underway in the mining sector.

This report reviews some of these market trends and provides insights into the state of the cryptoasset
industry. For the 3rd edition of its Global Cryptoasset Benchmarking Study, the CCAF gathered data
from 280 entities from 59 countries and across four main market segments, namely exchange, payments,
custody, and mining. The sample consists of 175 service providers, 75 mining companies and 30
individual miners. Data was collected between March and May 2020.

The key findings from this global cryptoasset benchmarking study are as follows:
Analysing growth indicators of the cryptoasset industry
Full-time equivalent (FTE) employee growth slowed considerably following the late-2017 market
frenzy. Respondents across all market segments, reported year-on-year growth of 21% in 2019, down
from 57% in 2018.

Industry-wide, the growth in FTE employment declined by 36 percentage points between 2017 and
2019, whereas the median firm reported a 75-percentage point downward change in employment
growth. The difference in the industry-level and the firm-level employment growth figures reflects the
rise of large firms within each industry group that dominates in the aggregate change in employment and
suggests that a few large players are dominating the industry.

However, not all firms are equal: individual firm employment data shows that a notable proportion
of companies (26%) have sustained an annualised growth in employment level above 10% over the
past three years. Using established definition and criteria, which sets the size threshold of a firm at
the beginning of the growth period at 10 FTE employees, these companies qualify as “high-growth
companies”.1

A deep dive into mining: from its environmental impact and the financialisation of the sector to
centralisation concerns
The survey findings estimate that on average 39% of proof-of-work mining is powered by renewable
energy, primarily hydroelectric energy. Understanding the energy source of mining is important because
electricity costs account for the majority of hashers’ operational expenditures - albeit with some
variability across world regions - and hashers have long competed on accessing the cheapest energy
source.

Faced with increased competition and tight profit margins, miners with access to sophisticated
financial products, such as hashrate or cryptoasset derivatives, have begun using them to hedge their
risks (between 12% to 14% of all miners). This is paving the way for the financialisation of mining.

1   Eurostat Glossary (2014) Glossary: High-growth enterprise. European Commission. Available from: https://ec.europa.eu/eurostat/
    statistics-explained/index.php/Glossary:High-growth_enterprise [Last accessed: 20 August 2020].

                                                                11
3rd Global Cryptoasset Benchmarking Study
Significant differences arise when comparing the cost structure of American and Chinese hashers:
capital expenditures - primarily constituted of mining equipment purchase - take up to 56% of
American hashers’ costs, compared to 31% for Chinese ones. This suggests that Chinese hashers
have a competitive edge in the acquisition of mining machines explained mostly by the concentration
of hardware manufacturers in China, leading to a shorter supply chain, easier business conduct (e.g.
language, working culture, local connections), and absence of international shipping fees and import
tariffs. Aligned with this, the study found that 52% of ASIC manufacturers total sales go to Chinese
hashers in 2019.
23% of surveyed hashers report receiving support from governments, primarily in the form of locally-
focused support, such as electricity subsidy for users within a region. Nearly two-fifths of those receiving
local governmental support are based in China.
Off the chain story: understanding service providers’ internal flows
Aligned with 2018 findings, new survey data shows that off-chain transactions, both in terms of
volumes and numbers, continue to be dominated by fiat-cryptoasset trades (and vice-versa), meaning
that users primarily interact with ‘gateway’ service providers, such as exchanges, to enter and leave the
cryptoasset ecosystem.
Usage seems to vary with the geographic location of the service provider. For instance, exchanges
based out of APAC record the highest share of cryptoasset-cryptoasset trades (40%) and most
transactions initiated at these exchanges are directed to the open-market (i.e. exchange’s order-book).
This suggests that APAC exchanges are primarily used for trading purposes.
Stablecoins are becoming increasingly available. The share of service providers supporting Tether grew
from 4% to 32% between 2018 and 2020, compared to 11% to 55% support growth for non-Tether
stablecoins. This is aligned with the rising value of transactions denominated in stablecoins.
Demographics of service providers’ customer base
An updated estimate of the number of cryptoasset users indicates a total of up to 101 million unique
users across 191 million accounts opened at service providers in Q3 2020. In 2018, the 2nd Global
Cryptoasset Benchmarking Study estimated the number of identity-verified cryptoasset users at about
35 million globally.
While firms continue to serve users from their region of operations, North American, Middle Eastern
and African companies appear to have a more geographically diversified clientele. Service providers
in both regions report that 42% of their customers are from other regions - primarily in Europe for MEA
firms and Latin America for North American ones.
Service providers operationally headquartered in North America and Europe indicate that business
and institutional clients make up 30% of their customers. This figure is much lower for APAC and Latin
American firms at 16% and 10% respectively.
The composition of business and institutional clientele differs from region to region. While North
American and European firms primarily serve cryptoasset hedge funds and traditional institutional
investors, Middle Eastern and African service providers that cater to non-retail clients focus on online
merchants (50%). Meanwhile, a notable share of APAC service providers deals with miners (41%), in part
explained by the high level of mining activities in the region, especially in China.
Regulatory and compliance standards across the industry and geographies
Just over two out of five surveyed firms are licensed or in the process of obtaining a license; these
firms are primarily located in Europe. However, the remaining 58% should not be perceived as the share
of entities conducting unregulated activities or evading regulations: some surveyed service providers are
engaged in activities that do not yet warrant any authorisation process (e.g. non-custodial functions) or
are operating in jurisdiction(s) where no regulatory framework or guidance has been put forth.
123rd Global Cryptoasset Benchmarking Study
Compliance with KYC/AML obligations is heterogeneous across regions. Nearly all customer accounts
at European and North American service providers have been KYC’ed, whereas this is the case for only
one out of two accounts at MEA-based service providers.
The share of cryptoasset-only companies that did not conduct any KYC checks at all dropped from
48% to 13% between 2018 and 2020, most likely resulting from the progressive harmonisation of
KYC/AML standards across jurisdictions, such as initiated by the Financial Action Task Force (FATF).
The inclusion of firms exclusively supporting cryptoassets featured in FATF’s updated standards and
recommendations is believed to have spurred greater compliance among this group of firms. However,
this should not be interpreted as these companies becoming fully KYC compliant as some KYC checks
are only applied to a subset of consumers.
54% of surveyed custodial service providers indicated that they performed an externally-led audit of
their cryptoasset reserves over the past 12 months. This is a 24-percentage points decline compared to
our 2018 sample. Firms that have undergone an independent audit are most likely to be operating out of
Europe or the APAC region.
The development of best industry practices for IT security, security audits, and insurance coverage
plans
Regardless of their location or size, the vast majority of surveyed cryptoasset service providers keep
cryptoasset funds in cold storage (90%). To a lesser extent, they make use of multi-signature approaches
to secure their cold (81%) and hot (70%) storage systems.
Nevertheless, enhanced IT security measures do not automatically come alongside robust insurance
plans: 46% of service providers report not being insured against any risks. Those who do have
insurance plans are primarily insured against cybercrimes, professional errors, hazards, and loss or theft
of private keys.
The median non-custodial service provider usually spends a greater share of its resources, both
financial and human, on IT security, between 11% to 20% compared to 6% to 10% for custodians.
This is partially explained by the fact that non-custodial systems are generally associated with greater
development costs and timeline.
Future outlook: striking the balance between integration and innovation?
A decoupling of duties, such as between custody, clearing and settlement responsibilities, appears to
be underway and may lead to greater resemblance with traditional financial market infrastructure.
For instance, 45% of respondents indicate using a third-party, primarily crypto-native custodians, as part
of their cold storage system.
However, further intertwining with the traditional financial system and greater institutional adoption
are conditional on enhanced compliance with international standards, such as those laid out by the
FATF. Survey data found that cryptoasset service providers legally incorporated in a jurisdiction member
of FATF are more likely to serve traditional institutional investors.
More risky and experimental innovations, such as in the realm of decentralised finance (“DeFi”), might
also come to fruition in the near future. Service providers, particularly large ones, expect that future
developments in the DeFi space will have considerable impact on their business operations and model in
the next 12 months.
133rd Global Cryptoasset Benchmarking Study
METHODOLOGY
For the third edition of the Global Cryptoasset Benchmarking Study, four market segments were
surveyed: (i) mining, (ii) payment, (iii) custody, and (iv) exchange. Two separate surveys were constructed
and distributed to respondents between March and May 2020, via secure web-based questionnaires.
1. The Cryptoasset Service Providers Survey was sent to entities active in one or more of the
payments, custody and exchange segments. The breakdown of respondents per market segment
is shown in Figure 1.
Figure 1: The exchange market segment is the most represented in the survey sample with more than two in three
surveyed respondents offering exchange services
Respondents Breakdown by Market Segment
Share of service providers
6% 29%
10%
Payment services Exchange services
18%
5%
17%
15%
Storage services
2. The Cryptoasset Mining Survey was sent to individuals and organisations involved in the mining
industry, such as hashers, hardware manufacturers, and pool operators. The breakdown of mining
respondents is shown in Figure 2.
Figure 2: Nearly one in two respondents mine as part of a pool
Respondents Breakdown by Mining Activity
Share of mining actors
Mining as part of a pool 44%
Mining hardware manufacturer and/or reseller 34%
Remote hosting services (central administrator) 32%
Solo mining 24%
Cloud mining services (central administrator) 21%
Mining pool operator (central administrator) 20%
Other 14%
143rd Global Cryptoasset Benchmarking Study
The surveys were globally distributed to ensure a representative sample of geographic dispersion
across market segments. Both surveys were made available in English, Spanish, Portuguese, Chinese,
Japanese, Russian, and Korean. In addition, the Cryptoasset Mining Survey was translated into Arabic.
Respondents were able to choose their preferred language for the web-based questionnaire.
Over 500 invitations to complete the surveys were disseminated by email to known industry contacts
and to other participants whose email addresses were obtained through desktop research. Members
of relevant industry groups on different messaging platforms, such as Telegram and WeChat, were sent
invitation links to complete the surveys. Information and open invitations to complete the surveys were
posted on social media platforms, including Twitter, LinkedIn, Reddit, and BitcoinTalk. News outlets (e.g.
Coindesk, 8btc, ChainNews) assisted with distribution of the survey. Finally, the research team worked
and partnered with 26 national cryptoasset associations to ensure local and national distribution of the
surveys, thereby increasing wider global participation.
This study also saw the contribution of a third-party data provider: CryptoCompare provided the CCAF
with selected data underpinning their Annual Exchange Benchmarking Report to supplement data
collected via our own online surveys. 2
All collected data was encrypted, safely stored and made accessible only to the CCAF research team
responsible for the production of this study. The privacy of all individual and company respondents was
ensured by anonymising all the data gathered from the surveys. In addition, the data was only analysed in
aggregate, using a range of categories that include industry segment, organisation size, supported assets,
custody types, and region.
Data was collected from 280 entities globally across 59 countries
In some instances, the survey data was supplemented by desktop research. This included web scraping
using manual techniques as well as Python scripts which were then verified and augmented through
a manual search process. Data from company websites, research reports, media outlets, and other
public sources was used to gather additional complementary data. If survey responses required
clarification, follow-up phone calls were made, or emails were sent to respondents. Where required, and
if feasible, additional checks were made by comparing survey results with other publicly available data
and responses on prior surveys. All responses were anonymised before the data was processed and
analysed.
280 entities across 59 countries and five continents contributed to the surveys. 175 firms participated
in the Cryptoasset Service Providers Survey and 105 entities (75 organisations and 30 individuals)
completed the Cryptoasset Mining Survey.
Figure 3 provides a breakdown of survey participants by geographic region. European countries make up
more than a third of the Service Provider Survey sample. Compared to the previous study, respondents
from the Middle East and Africa (MEA) now make up 12% of global respondents, doubling the number
from last year. Latin America and the Caribbean (LAC) has also seen an increase from respondents, up
from 9% to 15% this year. This change in geographical distribution of respondents helps to provide a
more balanced dataset globally.
2 CryptoCompare Research (2020) Exchange Benchmark Report - July 2020. Available from: https://www.cryptocompare.com/
media/37072188/cryptocompare-exchange-benchmark-july-2020.pdf [Last accessed: 24 August 2020].
153rd Global Cryptoasset Benchmarking Study
Figure 3: APAC and European respondents constitute the majority of surveyed entities
Geographic Breakdown of Respondents
Share of service providers Share of mining actors
5%
12%
8%
12%
38% 38%
24%
15%
23% 25%
Asia-Pacific Europe Latin America and the Caribbean Middle East and Africa North America
Asia-Pacific (APAC) respondents still dominate the Mining Survey sample. The proportions of
respondents from Europe and North America remain approximately the same as 2018, with a 3%
increase from the MEA region and a 4% decrease from LAC. The three most represented countries in
our mining sample were China (24%), USA (16%), and Russia (8%).
The distribution of respondents in terms of age is relatively similar across both samples (Figure 4). Half
of surveyed firms have been in operation for up to 3 years. The other half of surveyed service providers
have been operating for between 3 and 10 years, compared to 3 to 8 years for the second half of
surveyed mining actors. Further, we observed a significant difference in age distribution across regions.
In MEA, the majority of firms are young (less than 2 years old), whereas in Europe and North America
almost a fifth of firms are almost as old as the industry itself (7+ years old).
Figure 4: For both samples, the median firm has been operating for three years
Age Distribution of Respondents
First quartile: 2 years Third quartile: 6 years
Service providers
Outlier: 13 years
Median: 3 years
First quartile: 2 years Third quartile: 4 years
Mining actors
Outlier: 7 years
Outlier: 8 years
Median: 3 years
0 1 2 3 4
5 6
7 8
9
10 11 12 13 14
163rd Global Cryptoasset Benchmarking Study
SECTION 1: INDUSTRY GROWTH
INDICATORS
EMPLOYMENT FIGURES
The growth of the cryptoasset ecosystem has conventionally triggered a corresponding surge in job
opportunities. However, throughout 2018, employment growth decelerated as the effects of the late-
2017 market frenzy abated. The mining industry was particularly impacted by the slowdown: with a 37
percentage points (pp)3 decline in the segment aggregated employment level, compared to 36 pp for
service providers (Table 1).
The difference in the industry-level and the firm-level year-on-year (YoY) growth figures reflects the rise
of large firms within each industry group that dominate in the aggregate. Larger companies appear to be
less affected than individual firms, which may suggest that a few large players dominate the industry.
Table 1: Global patterns of employment levels at the industry- and firm-level
YoY 2017-2018 YoY 2018-2019
Industry aggregate Firm-level (median)4 Industry aggregate Firm-level (median)
All market segments 57% 88% 21% 13%
Service providers 55% 100% 19% 0%
Mining 65% 60% 28% 0%
Cryptoasset industries in the different regions have not been impacted equally by this slowdown.
Employment growth in Europe decreased by 14 pp, from 32% between 2017-2018 to 18% between
2018-2019. This is roughly half as much as in Latin America (from 45% to 6%) and MEA (from 69%
to 35%). Figures from the APAC and North American cryptoasset industries reveal a sharp decline
in employment growth - from 73% to 21% for APAC and from 134% to 33% for North American,
amounting to a fall of 52 and 111 pp respectively (Table 2).
Firm-level figures point to other interesting patterns. In contrast to industry-wide figures, firm-level
data shows that individual firms in North America and Europe, alongside MEA companies, have been the
most impacted with a 110 and 55 pp negative change in employment growth. This difference between
the experience at the aggregate industry employment and the experience of the median firm is another
potential indication that large companies are growing ever larger as a share of the industry.
Table 2: Employment growth is uneven across region, both at the industry and firm levels
YoY 2017-2018 YoY 2018-2019
Industry-level Firm-level (median) Industry-level Firm-level (median)
APAC 73% 78% 21% 41%
Europe 32% 88% 18% 33%
LAC 45% 43% 6% 15%
MEA 69% 83% 35% 0%
North America 134% 100% 33% -10%
3 “Percentage points (pp)” is the standard unit to express the difference between two percentages. For instance, at the aggregate
level year-on-year growth was 57% between 2017-2018 and 21% between 2018-2019: this is a decline of 57%-21%=36
percentage points (pp) decrease, but a 36/57 = 63% decrease in year-on-year growth .
4 Firm-level data is usually long-tailed in most industries (i.e. composed of many small firms and a few very large ones), which results
in significant discrepancy between the mean and the median. From a firm-level perspective, using the median rather than the mean
is therefore more representative of the sample.
173rd Global Cryptoasset Benchmarking Study
Despite being one of the two most impacted regions by this decline, FTE figures for 2019 show that the
median APAC firm reports a larger workforce size, with a median of 40 FTE employees, than the median
companies from other regions. We also note greater variability in staff numbers for APAC companies,
which suggest that the regional industry is greatly diversified, with a mix of small and large entities.
Figure 5: Larger firms tend to operate from APAC and North America
Number of Full-time Equivalent (FTE) Employees
Capped to 210
200
180
160
140
Number of FTE
120
100
80
60
40
20
0
Asia-Pacific Europe Latin America and Middle East North America
the Caribbean and Africa
HIGH-GROWTH ENTERPRISES
The share of high-growth companies in an industry is often used as an indicator to assess the
development stage of the sector. A high-growth enterprise may be determined by its workforce size or
profits generated. From an employee figure perspective, an enterprise qualifies as “high-growth” if the
average annualised growth in number of full-time employees (FTE) is greater than 10% p.a. over a three-
year period and having at least 10 employees at the beginning of the growth. 5
According to our study sample and using established criteria, high-growth companies accounted for
more than one out of every four enterprises active in the cryptoasset ecosystem in 2019. This figure is
slightly above the share of high-growth firms in other industries. By comparison, in 2017, the European
Commission reported that high-growth firms represented respectively 17% and 13% of European
companies in the Information and Communication, and Professional, Scientific, and Technical Activities
sectors. 6
The median YoY employment growth rate for high-growth
firms was 53% for the period 2017-2018 and 43% for 2018-2019
The share of high-growth firms as a proportion of the number of surveyed firms that provided FTE
figures for three consecutive years, is almost equal across the service providers and mining actors with
27% of surveyed service providers qualifying as high-growth firms compared to 25% of surveyed mining
actors.7 From a geographic standpoint, the majority of these firms are in APAC, where 39% of surveyed
5 Eurostat Glossary (2014) Glossary: High-growth enterprise. European Commission. Available from: https://ec.europa.eu/eurostat/
statistics-explained/index.php/Glossary:High-growth_enterprise [Last accessed: 20 August 2020].
6 Eurostat (2019) 1 in 10 enterprises in the EU classified as high-growth companies. European Commission. Available from: https://
ec.europa.eu/eurostat/web/products-eurostat-news/-/DDN-20191210-1 [Last accessed: 20 August 2020].
7 Based on the total of respondents that provided FTE figures for three consecutive years, from 2016 to 2019.
183rd Global Cryptoasset Benchmarking Study
enterprises active since at least 2017 can be defined as high-growth firms (Figure 6). The lowest share
of high-growth enterprises was found in LAC, where only 13% of surveyed firms in that region met the
criteria.
Figure 6: In 2019, APAC recorded the highest share of high-growth enterprises
High-Growth Enterprises by Region (2019)
Share of surveyed enterprises active since at least 2017
39%
27%
World = 26%
23%
18%
13%
Asia-Pacific Europe North America Middle East Latin America and
and Africa the Caribbean
Higher growth firms account for a larger part of employment in the industry relative to small growth
firms. In 2019, more than two in three employees of surveyed enterprises that have been active since at
least 2017 were employed by a high-growth company. These firms, on average, more than doubled their
workforce over the three-year period. In 2017-2019, high-growth cryptoasset firms experienced on
average a positive growth in the number of employees from approximately 84 employees in 2017 to 200
employees in 2019. This minority of high growth firms appear to account for higher employment levels
across the industry.
A commonly shared view is that high-growth firms are typically young (but at least three years old).
Although survey data shows that 3-4 years-old firms represent 49% of high-growth enterprises, the
median high-growth firm in the cryptoasset industry is 6 years old (Figure 7).
Figure 7: High growth is primarily a young firm phenomenon
Age Distribution of High-Growth Firms
Share of high-growth firms
49% 30% 19% 2%
3 to 4 years old 5 to 6 years old 7 to 8 years old 9+ years old
FINANCIAL PERFORMANCE OF SERVICE PROVIDERS
To perform a longitudinal assessment of the financial performance of service providers over the years,
we collected data on the operating revenues and pre-tax profits. Majority of the surveyed entities that
have been active since 2017, indicate that they have generated operating revenues over the past three
years (Figure 8).
193rd Global Cryptoasset Benchmarking Study
Despite the growth in the number of firms reporting operating revenues between 2017 and 2019,
from 10% to 16%, the number of firms that realised pre-tax profit stagnated between 2017 and 2018.
2018 corresponds to the year when the market experienced a sharp drop in prices and total market
capitalisation, which may have had a debilitating effect on some service providers and their ability to
generate profits.
Figure 8: Surveyed service providers report increased profitability in 2019 in comparison to the preceding years
Operating Revenues and Pre-Tax Profit
Share of surveyed service providers active since at least 2017
89%
80%
75%
66%
59% 57%
2017 2018 2019
Operating revenues Pre-tax profit
Unsurprisingly, the older the company, the more likely it is to be profitable. 80% of firms aged 7 years old
or older report having earned profits in 2019, compared to 60% for the 3-4 years old age group and 64%
for firms that are 5-6 years old.
203rd Global Cryptoasset Benchmarking Study
SECTION 2: MINING, THE BACKBONE
OF THE INDUSTRY
With mining operations reaching industrial scale, the ecosystem has morphed into a complex network
of interdependent actors, 8 often opaque and hard to understand for external observers and the general
public. In particular, the crucial role of miners in the functioning and the security of proof-of-work (PoW)
systems, such as Bitcoin, is often underappreciated and overlooked. This section intends to address this
complexity by delving into the role of hashers, pool operators, and hardware manufacturers.
HASHING AS A BUSINESS
Hashers’ raison d’être is the existence of PoW, a consensus mechanism to produce a commonly-agreed
history of transactions without relying on a central coordinating authority.9 There are other consensus
mechanisms that exist, such as proof-of-stake, but given PoW’s predominance at the time of writing this
report, this section exclusively focuses on PoW mining.
COIN SELECTION
The entry cost into cryptocurrency mining has been on the rise since 2013, partly attributable to
increasing computational difficulties that necessitate the utilisation of specific-purpose hardware.
Figure 9: Financial parameters primarily guide hashers’ choice of coins to mine
Coins Selection Criteria
Share of hashers
Large Small
Daily reward amount 70% 68%
Price of cryptoasset 70% 51%
Market capitalisation 52% 51%
Energy requirement 30% 47%
Proof system 48% 47%
Reputation 57% 47%
Ideology/personal affection 13% 32%
Large number of miners/mining pools 30% 26%
Friends/colleagues recommendation 4% 11%
Low number of other miners/mining pools 4% 8%
Other 30% 15%
8 For an introduction to the mining industry please see Rauchs et al. (2018) 2nd Global Cryptoasset Benchmarking Study. Cambridge
Centre for Alternative Finance. Available from: https://www.jbs.cam.ac.uk/wp-content/uploads/2020/08/2019-09-ccaf-2nd-
global-cryptoasset-benchmarking.pdf [Last accessed: 24 August 2020].
9 In proof-of-work cryptocurrencies, “hashers” provide computing power and are commonly known as “miners”. For further
discussion on the role of hashers, see Rauchs et al. (2018) 2nd Global Cryptoasset Benchmarking Study. Cambridge Centre for
Alternative Finance. Available from: https://www.jbs.cam.ac.uk/wp-content/uploads/2020/08/2019-09-ccaf-2nd-global-
cryptoasset-benchmarking.pdf [Last accessed: 24 August 2020].
213rd Global Cryptoasset Benchmarking Study
Hashers must therefore carefully select the coin(s) to mine against a set od criteria to break even. For the
majority of hashers that are driven by profit motives and returns, coin selection is generally guided by
financial criteria, such as daily reward amount or cryptoasset prices (Figure 9).
Conversely, the remaining portion of hobbyist hashers, believed to be mostly located in Europe and
North America,10 are likely to be driven by more subjective criteria, such as ideology and personal
affection.
Interestingly, energy requirement seems to be a much more determining factor for small hashers than
large ones. This difference is also reflected at the regional level: hashers operating out of Europe (56%)
and LAC (63%) more often base their coin choice on this criteria than those from APAC (37%) or North
America (35%). This might be an indication that hashers, and particularly large ones, from APAC and
North America are more confident in their ability to secure stable access to energy sources.
Bitcoin is the most popular coin mined, with 89% of surveyed hashers indicating that they mine it,
followed more distantly by Ethereum (35%) and Bitcoin Cash (30%). Interestingly, while Bitcoin mining
is predominant across all regions, other coins seem more popular in certain areas than others (Figure
10). For instance, Ethereum mining appears to be particularly popular among Latin American hashers,
whereas Bitcoin Cash is more popular in APAC and North America. The mining of privacy coins in
Western regions also differs from the global average: 28% and 19% of European and North American
hashers report mining ZCash, and as many North American hashers also engaged in Monero mining.
Figure 10: Beside global consensus on Bitcoin, the popularity of other PoW coins varies across world regions
Coins Mined by Region
Share of hashers
Asia-Pacific Europe Latin America North America
and the Caribbean
Bitcoin (BTC) 94% 100% 88% 86%
Ethereum (ETH) 34% 22% 63% 33%
Bitcoin Cash (BCH) 34% 22% 25% 38%
Litecoin (LTC) 25% 33% 25% 24%
Ethereum Classic (ETC) 16% 6% 14%
ZCash (ZEC) 16% 28% 19%
Other 16% 28% 25% 14%
Digital Cash (DASH) 13% 6% 13% 10%
Monero (XMR( 9% 6% 19%
COST OF HASHING
Hashers’ costs comprise capital expenditures (e.g. purchase of mining equipment, infrastructure
development and allied costs), which represent on average 45% of hashers’ total costs. The remaining
55% fund operational expenditures (e.g. electricity bills, maintenance, workforce), of which 75% is utilised
towards the payment of utilities. This figure varies slightly based on the type of coins mined. For instance,
for hashers exclusively focusing on cryptocurrencies that employ the SHA-256 mining algorithm,
10 Genesis Mining (2020) State of Crypto Mining 2020. Genesis Mining. Available from: https://www.genesis-mining.com/state-of-
mining2020?download=confirm [Last accessed: 20 August 2020].
223rd Global Cryptoasset Benchmarking Study
utility costs correspond to 79% of their operational expenditures. This is in part explained by diverging
production costs of the different PoW coins.
Utility costs represent on average 79% of SHA-256 hashers’ operational expenditures
Differences also arise at the regional level (Figure 11): hashers operating in LAC reported the lowest
share of utilities cost as part of their total cost structure. The clustering of respondents at the bottom
part of the distribution for North and Latin American hashers suggests that a select few hashers in these
regions are able to drastically minimise their utilities costs.
Importantly, Latin American hashers registered the highest share of capital expenditures - although
we note a relative variability across them - possibly explained by a lack of robust supply chains to ship
equipment to the region. In contrast, easy reach of hardware manufacturers is reflected by a lower share
of capital expenditures as part of their total costs for APAC miners (37%).
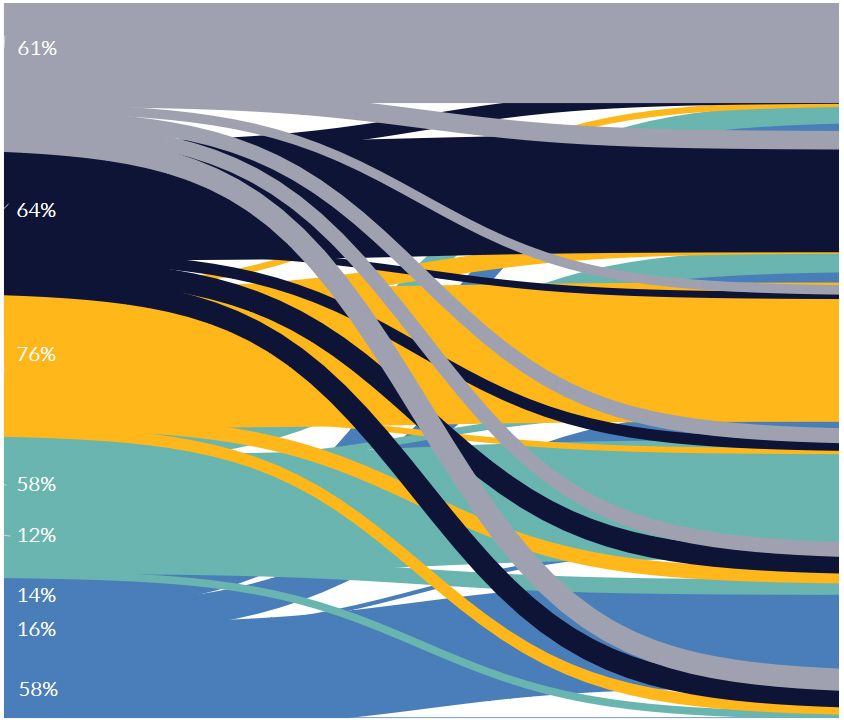
Figure 11: Most of North and Latin American hashers’ costs go to capital equipment
Cost Breakdown of Hashers per Region
Share of hashers’ cost structure
Asia-Pacific 37% 49% 7% 7%
Europe 43% 41% 9% 6% 1%
Latin America and the Caribbean 52% 21% 6% 16% 5%
North America 52% 38% 5% 5%
Capital equipment Utilities Maintenance Employees or contractors Other
A focus on the two most represented countries in our study sample offers additional insights. Cost
structure data from Chinese and American hashers seems to confirm that Chinese hashers have a
competitive edge in the acquisition of mining machines (Figure 12). The concentration of hardware
manufacturers in China implies well-connected and shorter supply chains to Chinese hashers, simplified
business conduct (e.g. language, working culture), and absence of additional overseas shipping fees.11
Unexpectedly, the share of labour and maintenance costs do not seem to differ significantly between
the two mining regions, despite common belief that cheaper workforce in China would necessarily lead
to labour contributing less to their overall expenditures. Cost of labour is indeed cheaper in China, but
Chinese hashers tend to rely on a larger workforce size to run their operations. In contrast, most North
American facilities have deployed sophisticated ASIC management software that reduces the need for
technicians.
Figure 12: Chinese hashers allocate more than half of their total expenditures to utilities
Cost Breakdown of Chinese and American Hashers
Share of hashers’ cost structure
China 31% 55% 7% 6% 1%
United States 56% 31% 5% 7% 1%
Capital equipment Utilities Maintenance Employees or contractors Other
11 For instance, since the introduction of new tariffs on Chinese imports, US hashers have to pay 28% tariffs on ASICs shipped to the
USA.
233rd Global Cryptoasset Benchmarking Study
ELECTRICITY PRICE
Utilities, primarily composed of electricity costs, take the lion’s share of hashers’ operational
expenditures. Contrary to the popular assumptions found in academic papers and mainstream media12 ,
the vast majority of hashers no longer pay residential electricity prices, but often access preferential/
industrial pricing by entering contractual agreements with power generators. The median electricity
price is comparatively higher in North America - albeit significantly variable across hashers from the
region - and APAC at USD 0.05/kWh, whereas Latin American hashers report the lowest median
electricity price (USD 0.025/kWh) of all regions (Figure 13).
Globally, electricity price paid by miners averages USD 0.046 per kWh13
There is a notion that electricity surplus in some APAC areas, such as the province of Sichuan in China,
gives hashers who relocate their operations there during the rainy season a competitive advantage in
minimising their running costs. However, survey data demonstrates that this seasonal advantage appears
to be offset by less affordable electricity prices throughout the rest of the year when hashers migrate
back to other provinces, such as Xinjiang or Inner Mongolia in China.
Figure 13: The median Asian and North American hasher pay the same electricity price
Electricity Price per Region
9
8
7
USD cent/kWh
6
5
4
3
2
1
0
Asia-Pacific Europe Latin America and North America
the Caribbean
GOVERNMENT SUPPORT
Hashers’ operational costs may be reduced through government support, which may take the form
of subsidies or tax exemptions. Government interventions through subsidies and tax exemptions are,
however, still relatively uncommon in most regions. Only 23% of the surveyed hashers report receiving
support from governments (Figure 14). This aid primarily takes the form of locally-focused support, such
as electricity price subsidy for users within a region. 38% of surveyed hashers who receive government
support operate in China, followed by Kazakh (19%) and Canadian (12%) hashers.
12 See for instance, Malfuzi, A. et al. (2020) Economic viability of bitcoin mining using a renewable-based SOFC power system to supply the
electrical power demand. Energy. Available from: https://doi.org/10.1016/j.energy.2020.117843 [Last Accessed: 20 August 2020];
Benetton, B., Compiani, G. and Morse, A. (2019) Crypto Mining: Local Evidence from China and the US. University of Berkeley.
Available from: https://faculty.haas.berkeley.edu/morse/research/papers/BenettonCompianiMorse_CryptoMining.pdf
https://doi.org/10.1016/j.energy.2020.117843 [Last accessed: 21 August 2020].
13 The weighted average was calculated by combining survey data on electricity price and the estimated monthly share of total Bitcoin
hashrate per country for the period September 2019 to April 2020, according to the CBECI mining map. See Cambridge Bitcoin
Electricity Consumption Index. Cambridge Centre for Alternative Finance. Available from: https://cbeci.org/mining_map
[Last accessed: 21 August 2020].
24You can also read