THAILAND INDUSTRY OUTLOOK 2020-2022
←
→
Page content transcription
If your browser does not render page correctly, please read the page content below

2020-2022

THAILAND
INDUSTRY OUTLOOK
              January 2020

        Krungsri Research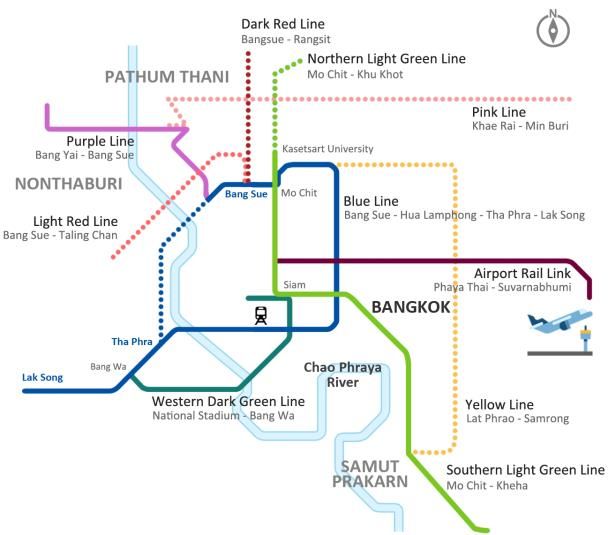
2020-2022 THAILAND INDUSTRY OUTLOOK
Challenges and opportunities
The outlook for Thai industries in the next three years takes into consideration the challenges and
opportunities. They include looking at the attractiveness of the businesses or industries, which are based
on several factors including the general macroeconomic environments and sector-specific conditions.
Macroeconomic environments
Global economy in 2020-2022: Sporadic recovery as growth diverges
After a marked slowdown in 2018 and 2019 with growth grinding to the slowest pace since the Great Financial
Crisis, the global economy is forecast to recover and grow by 3.4-3.6% p.a. over 2020-2022. The headwinds
which had caused the 2-year streak of slower growth will dissipate. Global financial conditions have eased
considerably largely due to the dovish pivot at most central banks. There are still many bumps on the road ahead
but trade tensions will continue to ease. We are unlikely to see an immediate rollback of tariffs, but the removal of
some tariffs would be a positive development. However, unlike the expansion in 2015-2017 that was
characterized by synchronized growth, the next global upswing will create a growth divergence between advanced
economies and emerging markets & developing economies, which suggests more fragile growth on the horizon.
The US economy is likely to see slower growth but on a firmer ground. Looser financial conditions usually bode
well for growth and would support the continued recovery in rate-sensitive sectors such as housing and durables
consumption. That will greatly reduce odds of a recession. Labor market and consumer spending have continued
to defy headwinds at home and abroad, underlining strong economic fundamentals. In Europe, contraction in the
manufacturing sector could have ended with the auto sector bottoming out. Easier credit conditions and
stronger demand for loans offer economic reassurance. Many countries in the eurozone are likely to roll out
looser fiscal policies as monetary policy is losing potency. The structural budget deficit is estimated to reach 0.9%
of GDP in 2020, the highest since 2015.
China’s economy is tipping towards stabilization. The industrial sector is bottoming out amid a friendlier global
economic environment. Monetary policy has generally remained supportive. Fiscal policy has been eased
significantly; the augmented budget deficit is on track to reach nearly 12% of GDP in 2020-2022, a bigger deficit
than during the Great Recession. Policy makers are sticking to a structural reform policy to strengthen private
sector confidence. In Japan, the Olympic Games will stimulate consumption, which could offset the negative
impact of the expiry of temporary counter-measures to the tax hike. Capex trends should remain firm, driven by
(i) investments to combat labor shortage, and spending to upgrade aging facilities; and (ii) a recovery in external
demand, which would encourage exporters to invest.
Figure 1: GDP growth (%)
8.0 8.0
Emerging market and developing economies
7.0 7.0
6.0 6.0
World
5.0 5.0
4.0 4.0
3.0 Advanced economies 3.0
2.0 2.0
1.0 1.0
Shaded areas indicate the GDP growth differential between Emerging market & Developing economies and Advanced economies
0.0 0.0
2010 2011 2012 2013 2014 2015 2016 2017 2018 2019 2020 2021 2022
Source: IMF World Economic Outlook (October 2019), Krungsri Research
2020-2022 Thailand Industry Outlook | Krungsri Research 2 Global trade downswing is at inflexion point
Given that a global trade down cycle historically lasted an average of 16 months, global trade is now halfway
through a downswing that started in February 2019. As such, it is seemingly tipping towards a cyclical revival in
mid-2020. The US ISM Manufacturing PMI new export orders subcomponent has surged to expansion territory.
In China, while the official NBS Manufacturing PMI new export orders subcomponent remained in contraction
territory, it is clearly on an upward trend.
Figure 2: World trade volume Figure 3: Manufacturing PMI sub-index
% deviate DI New Export Orders
% YoY from trend DI
10 15 65 56
US (LHS)
8 12
Trend growth 60 54
6 9
4 6 55 52
2 3
50 50
0 0
-2 -3 45 48
-4 -6 China
Cycle (RHS) 40 46
-6 -9
-8 -12 35 44
Jul-11
Jul-12
Jul-13
Jul-14
Jul-15
Jul-16
Jul-17
Jul-18
Jul-19
Jan-01
Jan-02
Jan-03
Jan-04
Jan-05
Jan-06
Jan-07
Jan-08
Jan-09
Jan-10
Jan-11
Jan-12
Jan-13
Jan-14
Jan-15
Jan-16
Jan-17
Jan-18
Jan-19
Jan-11
Jan-12
Jan-13
Jan-14
Jan-15
Jan-16
Jan-17
Jan-18
Jan-19
Source: Netherlands Bureau for Economic Policy Analysis, Institute for Supply Management, National Bureau of Statistics of China, Bloomberg, Krungsri Research
The manufacturing downturn may end soon as excess inventories continue to drop
Manufacturing cycles normally last about three years based on past data, with 19 months of upcycle followed by
17 months of downcycle. The current downturn started in January this year, which means we should be
approaching the trough of the downcycle. Growth of industrial inventories has continued to slow and the level is
now low by historical standards, offering reassurance there would not be massive destocking ahead. Despite
uncertainty in US-China trade negotiations, there is limited downside risk to manufacturing sector activity.
Figure 4: World Industrial Production Volume Figure 5: Industrial Inventories
% deviation
% YoY from trend % YoY % YoY
5 10 12 30
Trend growth
4 8 10 25
3 6
8 20
2 4
US (LHS)
1 2 6 15
0 0 4 10
-1 -2
2 5
-2 -4 China
Cycle (RHS) 0 0
-3 -6
-4 -8 -2 -5
Jul-11
Jul-12
Jul-13
Jul-14
Jul-15
Jul-16
Jul-17
Jul-18
Jul-19
Jan-01
Jan-04
Jan-07
Jan-10
Jan-13
Jan-16
Jan-19
Jan-02
Jan-03
Jan-05
Jan-06
Jan-08
Jan-09
Jan-11
Jan-12
Jan-14
Jan-15
Jan-17
Jan-18
Jan-11
Jan-12
Jan-13
Jan-14
Jan-15
Jan-16
Jan-17
Jan-18
Jan-19
Source: Netherlands Bureau for Economic Policy Analysis, U.S. Census Bureau, National Bureau of Statistics of China, Bloomberg, Krungsri Research
2020-2022 Thailand Industry Outlook | Krungsri Research 3 Structural changes in the world economy will have an impact on businesses and industries in
the near future
Structural changes are rippling through the world
economy as dependence on industrial output gives way
Figure 6: Share of Services Sector in GDP
to greater economic dependence on the services sector.
This process was visible between 2008 and 2017, when
contribution from the services sector rose from 62% of 66
world GDP to 65%. In Thailand, the contribution had risen World
from 55.8% in 2008 to 62.6% in 2018. The transformation 64
will deepen with time and as more countries try to gain a
62
competitive edge by increasingly employing modern
technology to offer more innovative services. For 60
instance, in the tourism sector, the increasing number of
online platforms will improve access to tourist attractions 58
Thailand
worldwide. In healthcare, the development of tele-
robotics is facilitating contact between doctors and 56
patients and allowing specialists to carry out surgical
54
operations remotely, sometimes across international
1997 2000 2003 2006 2009 2012 2015 2018
borders, as is happening in China. At the same time, the
industrial sector in developed economies are adding
Source: World Bank, Office of the National Economic and Social Development Council
value to their products by offering innovative services (NESDC)
(known as servitization), for example by using big data
analytics and artificial intelligence to offer design and
consultancy services. In addition to helping to boost sales,
these allow companies to offer better products and that
meet current demands in the market. This is happening in
the US where contribution of services to the value of the
industrial sector (i.e. servicification) had risen from 35%
in 2008 to over 39% in 2018.
The latest trade protectionism trends worldwide have accelerated decisions to relocate investment targets in
many industries. In particular, the unresolved US-China spat with started in 2018 has prompted some investors to
move production facilities from China to countries with attractive infrastructure and labour components such as
Vietnam and Thailand, to circumvent the tariffs. Thailand is competitive in electronics, electrical appliances,
automobile & auto parts, petrochemicals and agro-processing, because of easy access to raw materials and parts.
The value of BOI applications from foreign investors jumped 129% in 9M19, the majority from corporations in
China, Japan and Hong Kong that plan to invest in the electronics and electrical appliances, auto parts, agro-
processing and petrochemical industries. However, competitiveness of other countries in the region is rising
rapidly, especially Vietnam which has a skilled workforce and notable ability in innovation (WEF, 2019), as well as
the advantage of more favorable trading terms following the signing of the FTA with EU. This is a potential threat
to Thailand’s position and the country will need to improve its competitive advantages if it wants to retain its
ability to attract FDI.
2020-2022 Thailand Industry Outlook | Krungsri Research 4 Rapid changes in technology is also precipitating structural changes in the global economy. As a number of
global mega-trends play out, the digital age is becoming more entrenched and the spread of new technologies is
altering both consumer behaviour and industrial production, changes that are being seen at both the global level
and in Thailand. In response to these changes, the Thai government will develop the 4.0 economy by introducing
policies to develop the high-tech sector. This will lead to structural changes in Thailand to help entrepreneurs and
investors, and through the entire length of supply chains. Several new technologies will be particularly disruptive
and will have widespread impact on industry. These are described below:
The Internet of Things (IoT): One application involves managing production processes by automatically
connecting information through the internet and then using this data to manage the supply chains of smart
factories and industries that are technologically-intensive, such as automobile, electronics, retail stock
management and even tracking patient health in new, connected hospitals. The IoT will use 5G wireless
technology to support massive machine-to-machine communication links to be able to rapidly receive, respond
and transmit greater quantities of data.
Cloud technology: The cloud is a form of low-cost IT infrastructure used to store and analyze big data via the
internet. It is an important tool that allows corporations to maintain their competitiveness in the digital era.
3D printing: By using new digital technology to rapidly design and produce goods at lower costs, 3D printing is
a way of meeting the needs of middle-income consumers, who require a greater degree of customization in
their purchases. This technology may find a role in the supply chains of some industries, for example in fashion,
auto parts, electronics, and machinery & equipment.
Automation of knowledge: Artificial intelligence and machine learning (ML) can now replicate skilled human
work. By combining these with technologies that form part of the toolset of big data analytics, such as the
cloud and the IoT, it is possible to develop decision-making systems. These are now beginning to find a role in
applications such as carrying out basic diagnosis in hospital and healthcare sectors, call centers, and automated
production and services.
Robotic Process Automation: Using automated systems to assist with repetitive work or manage algorithmic
big data collection and analysis will help to cut costs and increase efficiency. In the future, by exploiting
advances in natural language processing, this will extend to the development of systems that are able to
respond to and communicate with individuals using appropriate spoken language forms, accent and
mannerisms. This will pave the way for more extensive use of automation and robots that work together with
humans (called ‘cobots’).
Blockchain: Rather than trying to keep data in a central location, distributed ledger technologies such as those
used in blockchain, allow data to be portioned out to users across a network but controlling access, making the
data storage highly secure. This will open the way to peer-to-peer business transactions that can do away with
the intervention of middlemen, for example when carrying out financial activities that use digital currencies or
assets, or to store big data safely such as biometric data, or for use with information on genetics that is used in
medical applications.
Quantum computing: Developing the processing capabilities of quantum computers to replace conventional
digital computers will dramatically raise computing speed and increase the learning ability of AI programs. and
through this, of smart systems, for example those installed in driverless cars and in robots.
2020-2022 Thailand Industry Outlook | Krungsri Research 5 Technological development and policies aimed at promoting self-reliance in some countries would shorten
global supply chains. The application of new innovations and the rapid advance of the global technological
frontier are a major factor in pushing industry into a new era of increased competition, improved efficiency and
lower costs of production. And, by utilizing new technologies including robotics, artificial intelligence and 3D
printing, manufacturers are now able to add greater value to their products. As a result of this process, many
developed economies are producing a greater quantity of intermediate goods domestically, rather than importing
them from developing countries, most of which have been recipients of investment from those developed
economies. Thus, between 2016 and 2018, the combined flows of foreign direct investment from developed
economies fell by an average of 22.3%, compared with a rise of 11.9% during 2006-2015 (UNCTAD). In addition to
this, official policies in many countries are encouraging a turn towards higher levels of self-reliance. This is
happening most notably in China, where investment in research and development is being stepped up in the hope
that this will help indigenous industrial supply chains to be more comprehensive, to reduce the need to import
intermediate goods. These shifts in the world economy will ultimately remove the role of several countries in the
global value chain. Since 2015, both forward participation (i.e. exporting intermediate goods to other countries)
and backward participation (i.e. importing intermediate goods for further processing) have dropped (Figure 7).
This process will cause global supply chains to contract, and this is likely to have consequences for countries that
are unable to adjust quickly to this changing landscape. Given this, helping the manufacturing sector to keep pace
with a rapidly evolving technological environment, and through this, maintaining a presence in these same supply
chains, has become a pressing challenge for many developing countries, including Thailand.
Figure 7: The changing intensity of GVC participation by income group
(% of final goods production)
Forward participation Backward participation
16 16 16 16
14 14 14 14
12 12 12 12
10 10 10 10
8 8 8 8
2007
1995
1997
1999
2001
2003
2005
2009
2011
2013
2015
2017
2005
1995
1997
1999
2001
2003
2007
2009
2011
2013
2015
2017
World Average Upper middle income World Average Upper Middle income
High income Low middle income High Income Lower middle income
Source: Global Value Chain Development Report 2019, World Bank, Krungsri Research
Thai economy in 2020-2022: Slow, below-potential growth
There is an absence of material growth drivers on the horizon. Hence, Thailand’s GDP growth is projected to
recover but remain below-potential over the next 3 years. The cyclical slowdown that started in 2H18 should
continue into 2020, followed by an uneven recovery in 2021 and 2022. Merchandise exports would see easing
headwinds but divergence of global growth will cap recovery. Large exporters would start to feel the effects of
the slow recovery in exports. Private investment should register a precarious recovery. Spare capacity has led to
a murky outlook for business investment. Relocation investment seems to be front-loaded, as inward FDI has
faded. The crowding-in effects from public spending is still remote. Public spending has been disappointing. The
government is likely to roll out a pro-cyclical fiscal policy in a downturn, as the IMF projects 2020 structural budget
balance would reverse to a surplus. On public investment, reality is not meeting expectations, with delays in
several projects. Private consumption is characterized by a tale of two stories. The surge in spending by residents
abroad suggests purchasing power of middle-income earners remain firm. But low farm income growth, stalling
wage growth, and dim job outlook are eroding purchasing power of low-income consumers. Several government
measures to help low-income earners only offer mild reassurance. Tourism is a proven resilient-growth engine.
There is near-term benefits from the Hong Kong protests as that diverted more Chinese tourists to Thailand.
Thailand is among the biggest beneficiaries of the strong growth prospects for China’s outbound tourism industry,
but is struggling to cope with the influx of travellers due to tight airport capacity.
2020-2022 Thailand Industry Outlook | Krungsri Research 6Figure 8: Thailand’s Real GDP Growth (% p.a.)
8 8
6 6
4 4
2 2
0 0
-2 -2
Actual GDP growth and forecast
-4 -4
IMF forecast for potential GDP growth
-6 -6
-8 -8
2003
2012
2021
1995
1996
1997
1998
1999
2000
2001
2002
2004
2005
2006
2007
2008
2009
2010
2011
2013
2014
2015
2016
2017
2018
2019
2020
2022
Figure 9: GDP Growth and Components (% p.a.)
2019 2020 2021 2022
4.4 4.9
4.0 4.5 4.0
3.5 3.6 3.7 3.3 3.5 3.7 3.0 3.6 3.2
2.4 2.5 2.7 3.0 2.2 2.4 2.0 2.0 2.3 1.8
2.8 2.4 2.1
3.0
2.0
-3.0 -3.4
-6.6
GDP Private Government Private Public Exports of Exports of Imports of
Consumption Consumption Investment Investment Goods Services Goods & Services
Source: NESDC, IMF World Economic Outlook Database, Krungsri Research
Sector-specific factors
• Structural problems have eroded the competitiveness of Thai industry
Figure 10: 12 Key Pillars That Contribute to Competitiveness
1st pillar: Institutions
12th pillar: Innovation
2nd pillar: Infrastructure
capability
11th pillar: Business
3rd pillar: ICT adoption
dynamism
4th pillar: Macroeconomic
10th pillar: Market size
stability
9th pillar: Financial system 5th pillar: Health
8th pillar: Labour market 6th pillar: Skills
7th pillar: Product market
Thailand China East Asia & Pacific
Source: The Global Competitiveness Report (GCR) 2019 edition, World Economic Forum (WEF)
2020-2022 Thailand Industry Outlook | Krungsri Research 7 Thailand’s structural problems continue to cap the Figure 11: R & D Expenditure
competitiveness of its industrial sector. This is most
% of GDP
recently reflected in the World Economic Forum’s Global
4
Competitiveness Index, which revealed that Thailand’s 3.2
overall score increased from 67.5 in 2018 to 68.1 in 2.8
3
2019, but its global ranking slipped from 38 to 40. While 2.1 2.2
Thailand is building up competitiveness in several areas, 2 1.4
the rate at which this is happening is insufficient to keep 1.0
0.8
1
up with changes in the global environment, unlike its 0.2
competitors. Thailand draws advantages from a stable 0
Indonesia
Malaysia
China
Singapore
US
Hong Kong
Thailand
Japan
macroeconomic platform, a strong financial sector, and
government regulations that are broadly supportive of
business activity. And, the country’s scores in ICT
adoption and budget transparency (institutional
Source: The Global Competitiveness Report 2018, WEF, Krungsri Research
contributors to competitiveness) have also improved Note: R & D expenditure in 2017
substantially. But in innovation, Thailand scored only 43.9
out of a possible 100 points, which is significantly lower than
for some other countries in the region, including China (64.8), Malaysia (55.0) and India (50.9). This is the result of
several factors, including: (i) low level of spending on research and development in Thailand, at only 1% of GDP
(Figure 11); (ii) limitations in the Thai labour force (in terms of both quantity and quality); and (iii) weaker
investment, which has slipped to only 15% of GDP compared over 20% before the 2007 financial crisis.
Consequently, structural problems have developed within the Thai export sector that is now dominated by the
production and sale of goods that require lower levels of technology than Thailand’s competitors. This situation
has been developing over an extended period and because it is an ongoing problem, it will take time to be
resolved. And until this happens, the Thai export sector will remain fragile and Thai industries will have limited
ability to compete with their rivals.
An aging Thai population will have an impact on the manufacturing sector. By 2031, Thailand is forecast to move
from being an ‘aging society’ (a country where more than 10% of the population is over 60 years old) to an ‘aged
society’ (more than 20% of the population is over 60 years old). Moreover, within the ASEAN region, Thailand has
the largest share of senior citizens. Meanwhile, the working age population is forecast to decline quicker than
elsewhere (Figure 12). The combination of these two factors will accelerate and magnify the impact on Thailand,
compared to other countries that are facing a similar demographic transition. The impact will include changes to
demand for goods and services to meet the different needs of older consumers, and on the supply side as labour
(an important input in manufacturing, agriculture and services) becomes scarcer. These changes will force the
manufacturing industry to adapt and to increase competitiveness to stay ahead of the changing business
environment and to continue to add value to goods and services. This means Thai industries will need to
accelerate the pace of innovation and development of new technologies.
2020-2022 Thailand Industry Outlook | Krungsri Research 8Figure 12: Working Age Population in Thailand
(the sharpest decline among ASEAN)
million persons index (2015=100)
50 160 Philippines
45 140
Malaysia
40 120 Indonesia
35 100 Singapore
Thailand
30 80
Thailand
25 60
1980 1990 2000 2010 2020 2030 2040 2050 2015 2020 2025 2030 2035 2040 2045 2050
Source: United Nations Department of Economic and Social Affairs, Krungsri Research
Accelerating infrastructure development, especially in the EEC, will improve long-term potential
for Thai businesses
Government investment in new national infrastructure and mega projects will stimulate economic activity and
related industries. In the Bangkok Metropolitan Region, extensions to rapid mass transit systems (the BTS, the
MRT and the commuter rail network) will help to improve transportation links between business districts and
outer regions, which will attract more investment by property developers and retailers in surrounding areas.
Outside Bangkok, progress in the EEC will spur the development of the national logistics system through better
coverage by land (high-speed and dual-track train networks), air (U-Taphao Airport), and sea (the Map Ta Phut
deep water port, Laem Chabang and Sattahip ports). These multimodal transport links will connect to other parts
of Thailand and neighboring countries, and the crowding-in effect should encourage private sector investment in
other industries, including real estate, retail and construction.
The EEC is expected to stimulate a new investment cycle, especially in technology-driven industries. This will
happen through the development of pilot zones in three strategic provinces - Rayong, Chonburi and
Chachoengsao - as sites for investment by businesses operating in the 10 target sectors. Investors in the EEC will
be attracted by three main pillars. (i) Infrastructure, in this case the development of comprehensive
communication networks. At present, of the most important projects, bidding opened on the high-speed rail link
in 2018, and for most of the other major projects, spending on construction began at the start of 2019. (ii)
Incentives, both tax and non-tax, also aim to provide clear benefits to investors. (iii) Targeted facilities have been
developed through the establishment of special promotion zones, including the Eastern Economic Corridor of
Innovation (EECi), the Aerotropolis (EECa), and the Digital Park Thailand (EECd). Construction of these projects
began in 2019. Business opportunities in the EEC will change with time (Figure 13), but in the initial period there
will be opportunities for operators in construction, logistics and real estate. The will be opportunities for
technology-driven manufacturing companies in sectors that already have a presence in Thailand, including next-
generation automotive manufacturing, aviation, smart electronics, biofuels and biochemicals, and food
processing. That will expand to include biotechnology and the establishment of a medical hub when the EEC is
fully developed.
2020-2022 Thailand Industry Outlook | Krungsri Research 9Figure 13: Business Opportunities offered by the EEC
Real Estate
Tourism Trading
Hospital Hospital
Tourism
Trading Construction
Food for
Aviation Future
Education
Biochemical Bio-technology
Next-gen Automobile
Logistic Wellness
Alibaba + Thai Post Smart Electronic Medical Hub
Tourism
Next-gen Automobile Medical Hub
Industrial Estate
Aviation
TG + Airbus
Wellness Tourism Food for
Future
Real Estate Construction
Source: Krungsri Research
Regulatory changes will have an impact on industry
Stability
Reviewing rules on property development. This has taken two main forms. (i) Regulations that determine the
amount of housing loan relative to the security value (loan-to-value ratios, or LTV) have been overhauled.
Commercial banks have reduced the maximum loan available to those purchasing a second or subsequent
homes when the mortgage on the first home is still outstanding or the transaction value of the property is
more than THB10m. The total value of loans (i.e. the combined value of ‘top-up’ loans and the main mortgage)
relative to the value of the collateral cannot exceed the stated limits. These rules came into effect in April 2019
and were aimed at removing speculative pressure in the property market and to avoid systemic risks (collateral
value dropping below the amount of outstanding loan). (ii) The new Land & Building Tax Act that will come into
effect in January 2020 is aimed at reducing economic inequality and increasing the efficiency of land use.
However, the Act may also impose more taxes on developers with large stocks of unsold properties (especially
condominium units) because taxes will be imposed on completed properties that are not sold within three
years of the Act coming into force.
Thailand is conducting reforms in the financial sector and financial regulations to prepare the sector for
changes in the global environment and future risks. These include:
(1) Introducing the Financial Sector Masterplan Phase III (2016-2020) and adjusting regulations for registering
risk by traders in securities.
(2) Adopting TFRS 9 accounting standard (effective January 2020)
(3) Review regulations governing the extension of credit to SMEs. They now need to submit a copy of their
accounts to the Revenue Department, which should allow those which report healthy earnings easier
access to credit.
(4) Introducing the 2019 Securities & Exchange Act (No.6) Act to encourage competition in the financial sector.
2020-2022 Thailand Industry Outlook | Krungsri Research 10 Health
Reviewing taxes on beverages
Tax on non-alcoholic drinks based on sugar content. These are aimed at raising awareness of the dangers
of excessive sugar consumption. It will be introduced in phases: Phase 1 ran from 16 September 2017 to
30 September 2019, Phase 2 is running from 1 October 2019 to 30 September 2021, and Phase 3 will run
from 1 October 2021 to 30 September 2023. The final Phase will run from 1 October 2023 onwards.
Cut taxes on functional drinks (i.e. drinks that offer health benefits, such as those with added collagen or
vitamins). There will be two types of taxes: (i) for water-based drinks, taxes are reduced to 10% from 14%;
and (ii) for fruit- or vegetable-based drinks, taxes are reduced to 3% from 10% (effective October 2019). It
is hoped this will offset some of the incremental costs arising from the sugar tax.
Environment
Energy reform is being carried out under the Power Development Plan for 2018-2037 (PDP 2018), which places
emphasis on the use of renewable energy. To increase the security of supply from renewable and alternative
sources, PDP 2018 supports the development of power generation facilities that use biomass and waste,
relaxes rules for installing rooftop solar systems, and promotes investment in energy storage.
Reviewing rules on transport and communication
Road transportation: Thailand will relax rules governing the provision of ride-hailing services, i.e. private,
unregistered individuals that offer taxi services through mobile or QR code platforms. This could have an
impact on demand for conventional taxi services. Currently, the authorities are collecting information for
consideration, and if the cabinet approves, the act will become law in April 2020.
The Carbon Offsetting and Reduction Scheme for International Aviation (CORSIA). This is introduced by
the International Civil Aviation Authority (ICAO) and will be implement from 2020. This will force aviation
operators to pay a carbon tax for greenhouse gases emission that breach agreed limits. This could increase
costs for airlines that operate international flights.
The International Maritime Organization (IMO) will implement measures to force cargo ships and tankers
to reduce emissions of sulfur dioxide (SO2) by using fuels with lower sulfur content. These restrictions will
come into effect on 1 January 2020 and will raise costs for maritime operators.
Others
Liberalization of Thailand’s services sector. This is triggered by agreements made at the 50th meeting of the
ASEAN Economic Ministers in 2018. At that meeting, Thailand and other ASEAN members agreed to open up
their selected services sectors to other ASEAN nations, based on the AEC Blueprint 2025. They include tourism,
restaurant, healthcare, senior care, training and education centers, trade shows, meetings & conferences, and
repair services. In many of these areas, Thailand has the ability to compete with players from the other
countries. However, Thailand has also agreed to open up its electronic data interchange sector and gas tankers
repair services to foreign competition. ASEAN members also agreed to push for a joint agreement on e-
commerce.
Review and repeal duplicate or redundant laws and regulations (called the ‘regulatory guillotine’). For
example, changes to the application process for visas and permits to work in Thailand will help businesses that
rely on migrant or foreign labour.
Although the measures above may impose additional burden on businesses, reviewing and modernizing these
regulations are in line with the socio-economic shifts happening at the global level. Pushing forward these changes
will help to lay the foundation for a supportive environment for businesses and industries to achieve sustainable
long-term growth.
2020-2022 Thailand Industry Outlook | Krungsri Research 11AGRICULTURE
2020-2022 Thailand Industry Outlook | Krungsri Research 12Rice
Situation in 2019
In 1H19, Thai rice output fell because of the following: (i) Figure 1: World Rice Prices (F.O.B.)
successful government promotional efforts to encourage growers USD/tonne
to switch to corn or other crops after the major cropping season,
and (ii) a weaker harvest for the second rice crop due to lower 600 Thai white rice 25%
irrigation water levels than a year earlier. Hence, paddy rice output 550 Vietnamese white rice 25%
slipped 4.4% YoY, dragged by a 33% drop in glutinous rice output. Indian white rice 25%
At the same time, shortage of Hommali and glutinous rice meant 500
Pakistan white rice 25%
that supply was insufficient to meet domestic demand, and pushed 450
up the overall price index by 3.6% YoY.
400
Rice exports shrank 18.4% YoY to 4.4 million tonnes in 1H19,
resulting in a 16.2% YoY drop in rice export value to USD2.29bn. 350
This can be explained by: (i) the government releasing its rice stock 300
that had been accumulated under the rice-pledging scheme; (ii)
250
China reduced imports and drew down its rise stock; and (iii) the
Jul
Jul
Jul
Jul
Jul
Jul
Jul
Jul
Jan-12
Jan-13
Jan-14
Jan-15
Jan-16
Jan-17
Jan-18
Jan-19
strong baht has made Thai rice exports less competitive. Price of
Vietnamese rice has remained low and the Indian government has
been subsidizing its rise exports. In contrast, the price of Thai rice Source: Food and Agriculture Organization of the United Nations (FAO)
has risen as exporters raised prices in an attempt to preserve
margins and compensate for lower revenue in domestic currency
because of the strong baht. All these factors had encouraged trade
partners to seek alternative sources for rice, especially from
Thailand’s competitors. Figure 2: Thai Rice Exports
In 2H19, higher rice prices will encourage farmers to increase million tonnes USD, bn
planted area and/or number of plantings, especially for Hommali 12 7.0
and glutinous rice. For full-year 2019, total output of paddy rice
should hit 34.6 million tonnes (+8.3% YoY). Rice exports would
10 6.0
continue to fall because the negative factors that had pressured
the industry in 1H19 have carried into 2H19. In 2019, total exports
is expected to tumble 27.6% to 8.03 million tonnes. Given rising 8 5.0
pressure as competitors reduce prices, the average price for
standard grade rice (e.g. 100% white rice, 25% white rice and 6 4.0
parboiled rice)1/ for 2019 would be weaker than 2018 levels.
4 3.0
2009
2010
2011
2012
2013
2014
2015
2016
2017
2018
2019F
2020-2022 Outlook
Thai rice output is expected to rise by 1-3% p.a. to 34-35 million Volume Value (RHS)
tonnes of paddy or 22-23 million tonnes of milled rice. High
domestic prices will incentivize farmers to expand planted area Source: Ministry of Commerce (MOC)
Note: Forecast by Krungsri Research
and/or the number of plantings. Our forecast will also be supported
by favorable weather and government measures to stabilize farm
income and rice prices. Measures include a rice insurance scheme
(for both income and crop), providing technical assistance to
farmers, and offering soft loans to delay rice sales. Figure 3 : World Rice Balance
Rice farmers are still exposed to several headwinds, including million tonnes million tonnes
stronger competition in both the domestic and export markets, and 510 190
higher cost of Thai rice (strong baht). The impact of these challenges
Thousands
500 180
will vary across the sector.
Exporters: Exports is likely to drop from 2019 levels in the face
490 170
of greater competition from Vietnam, India and especially China. 480 160
The latter is grabbing Thailand’s market share and putting 470 150
downward pressure on exporters’ margins.
460 140
Rice millers: Greater risks arising from excess capacity. Smaller
millers usually encounter liquidity constraints, which would limit 450 130
2019/20E
2020/21F
2014/15
2015/16
2016/17
2017/18
2018/19
their ability to buy paddy rice for milling. Larger millers that are
able to control costs will fare better.
Silos: The outlook is dim because the government has continued
to release its rice stockpiles, worsening the impact of excess silo Production Consumption
storage space. These negative factors will keep prices of silo Ending stock (RHS)
services low despite efforts by operators to offer their space to
Source: USDA (October 2019)
store other crops. Note: Forecast by Krungsri Research
1/ Premium-grade rice is still in demand and this has lifted average prices through 2019.
2020-2022 Thailand Industry Outlook | Krungsri Research 13Rubber
Situation in 2019
Rubber industry remains sluggish. 1H19 exports fell 6.0% YoY to Figure 1: Global Natural Rubber Prices
1.7 million tonnes. Shipments to China tumbled 14.3% YoY,
because the largest market continued to draw on its own huge THB/kg
rubber stock while increasingly seeking supply from new sources, Ribbed smoked sheet (RSS3)
200
specifically CLMV countries. Export prices rebounded in 2Q19 but Block rubber (STR20)
remained low because of temporary factors. They include: (i) a Concentrated latex
150
drop in global output following the outbreak of leaf fall disease in
Indonesia; and (ii) three major rubber exporters – Indonesia,
100
Malaysia and Thailand – have mutually agreed to slash combined
exports. However, the transitory price rally was insufficient to
compensate for the sharp drop in export volume. Hence, export 50
value fell 10.4% YoY to USD2.2bn in 1H19. In line with this,
industrial rubber production contracted across all products: sheet 0
Jul
Jul
Jul
Jul
Jul
Jul
Jul
Jul
Jul
Jul
Jul
Jan-09
Jan-10
Jan-11
Jan-12
Jan-13
Jan-14
Jan-15
Jan-16
Jan-17
Jan-18
Jan-19
rubber (-30.2% YoY), technically specified rubber (-10.0%) and
concentrated latex (-12.0%).
In 2H19, rubber exports should remain weak. Export volume is Source: Office of the Rubber Replanting Aid Fund (ORRAF)
expected to shrink by 11.4% YoY amid persistent weakness in
global demand, stronger competition from suppliers in CLMV, and
a slower auto parts sector. Rubber prices are also forecast to fall by Table 1: Thailand Rubber Exports
over 4% YoY due to excess supply. In addition, lower crude prices
(million tonnes)
could dampen prices of synthetic rubber, a cheaper alternative to
natural rubber. Hence, the value of exports is expected to drop by RSS3 STR20
Concentrated
Others Total
2.3% YoY to USD2.1bn in 2H19. This will lead full-year 2019 exports Latex
to shrink by 6-7% driven by both lower volume (down 8-9%) and 2012 0.67 1.29 0.95 0.09 3.00
price (down 1-2%). On supply, domestic production is projected 2013 0.81 1.47 1.04 0.12 3.44
to decline across the board in 2019: sheet rubber (-33%), 2014 0.72 1.53 1.06 0.10 3.41
technically specified rubber (-17%) and latex concentrate (-10%). 2015 0.66 1.82 1.07 0.10 3.65
2016 0.57 1.73 1.13 0.06 3.49
2020-2022 Outlook 2017 0.71 1.59 1.19 0.18 3.66
2018 0.56 1.53 1.30 0.14 3.53
The rubber industry should remain weak over the next 3 years,
2019F 0.48 1.57 1.12 0.05 3.22
because: (i) global rubber prices should remain stubbornly low
(RSS3 is expected to average THB50-55/kg); (ii) rubber supply will 2020F 0.46 1.60 1.16 0.06 3.28
increase with new plantations in Indochina maturing and offering 2021F 0.44 1.62 1.20 0.10 3.35
higher yields; (iii) Chinese rubber stocks are ballooning; and (iv) 2022F 0.42 1.64 1.22 0.11 3.38
trade partners and/or downstream manufacturers are increasingly Source: Ministry of Commerce (MOC)
applying non-tariff barriers in negotiations to secure supply; Note: Forecast by Krungsri Research
Michelin and IKEA refuse to buy rubber sourced from plantations
created through deforestation, and China has established the
National Forest Stewardship Standards which could be used to Figure 2: World Natural Rubber Balance
increase its negotiating power.
million tonnes million tonnes
Important factors affecting the sector include the direction of
government support (e.g. use of rubber by public sector 16 4
organizations), loans to support a sustainable rubber industry in
Thailand, and decisions by overseas investors to relocate 14 3
production bases, especially Chinese investors in the tire industry.
Ribbed smoked sheet and technically specified rubber: These 12 2
segments will be pressured by falling orders from China, and
rising competition from peers (Indonesia, Malaysia and Vietnam) 10 1
and new entrants (Cambodia, Lao PDR and Myanmar) that are
releasing greater volume of rubber into the global market. Thus, 8 0
exports of ribbed smoked sheet are expected to fall by 3-5%, and
2009
2010
2011
2012
2013
2014
2015
2016
2017
2018
2020F
2019F
2021F
2022F
technically specified rubber, which has better qualities when
processed, would see 0-2% growth. Production Consumption
Latex concentrate: Exports should rise by 1-3% driven by rising Ending stock (RHS)
demand from manufacturers of latex gloves and medical goods,
Source: IRSG
especially in Malaysia, Thailand’s biggest export market and the Note: Forecast by Krungsri Research
world’s biggest importer of rubber.
2020-2022 Thailand Industry Outlook | Krungsri Research 14Cassava
Situation in 2019
The cassava chip and pellets industry has continued to worsen. In Figure 1: Cassava Prices
10M19, output of fresh cassava rose 5.6% YoY due to an expansion
in cultivated area following high prices in 2018. But, demand had USD/tonne THB/kg
Cassava starch
continued to fall as overseas orders slid, especially from China, Cassava chips
750 3.5
caused by: (i) large corn inventory in China (a substitute for Cassava root (RHS)
cassava); (ii) the move by some Chinese ethanol producers to halt
600
production or to switch to corn as input; and (iii) the ASF (African 2.5
Swine Fever) outbreak in China, which has reduced demand for 450
cassava for use in animal feed. Hence, exports of cassava chip and 1.5
pellets fell 4.3% YoY in 10M19. Coupled with higher cassava 300
output, these caused the price of fresh cassava to tumble 21.1%
YoY and export prices by 37.8% YoY. For 2019, output of fresh 0.5
150
cassava and cassava chip is forecast to rise by 6-7%. But demand
will slide further and so, exports are expected to shrink by 37.8% 0 -0.5
(by volume) and 39.4% (by value).
Jul
Jul
Jul
Jul
Jul
Jul
Jul
Jul
Jul
Jul
Jul
Jan-09
Jan-10
Jan-11
Jan-12
Jan-13
Jan-14
Jan-15
Jan-16
Jan-17
Jan-18
Jan-19
The cassava starch industry was also weak in 10M19. Output of
cassava starch fell 2.3% YoY on weaker export orders and Source: Department of Internal Trade (DIT)
competition from other types of starch. Export volume grew only
1.3% YoY as orders from China and Indonesia slowed. Export prices
slipped 10.1% YoY following lower costs of raw materials and a
combination of softer demand and greater price competition. As a
results, the value of exports slid 3.0% YoY. For 2019, output of Table 1: Thailand Cassava Root Production
cassava starch will shrink by 4-5% on weaker overall demand. Harvested
Exports of cassava starch will drop by 1-3% (by volume) and 5-7% Year Area (% YoY)
Production
(% YoY)
(by value), dragged by slower demand for native starch and lower (million rai)
(million tonnes)
export prices for modified starch.
2013 8.7 1.7 30.2 1.3
2014 8.4 -2.6 30.0 -0.7
2015 9.0 6.3 32.4 7.8
2020-2022 Outlook 2016 9.1 1.2 31.2 -3.7
2017 8.6 -4.9 30.5 -2.1
Over the next 3 years, the industry outlook should remain tepid.
2018 8.3 -3.4 29.4 -3.7
Cassava chips: Exports should grow by an average of 1-2% p.a. 2019F 8.7 4.7 31.0 5.5
Demand from China (which accounts for 99% of total Thai 2020F 8.9 2.2 31.5 1.5
exports) remains uncertain due to: (i) the use of corn as Source: Office of Agricultural Economics (OAE)
alternative animal feed, and (ii) outbreaks of fatal diseases in pig
herds, which would reduce demand for feed, and cassava which
is a major raw material for animal feed. This would prompt
producers to look to other markets in Asia, including Vietnam,
the Philippines, India and Singapore. In the domestic market, the Figure 2: Thailand Cassava Product Exports
sector will benefit from rising demand from ethanol producers million tonnes USD, m
due to rising consumption of E20 and E85 gasohol.
16 4,000
Cassava pellets: Demand will remain weak and uneven. There
would only be orders when there is a shortage of other crops. 12 3,000
Native cassava starch: Exports should grow by 1-2% p.a.
Demand for downstream industries will be stronger, supported 8 2,000
by lower cost of raw materials for native cassava starch. But
there will be greater price competition from starches produced 4 1,000
from other inputs.
Modified cassava starch: Exports are forecast to rise by an
0 0
2017
2012
2013
2014
2015
2016
2018
2019F
2020F
2021F
2020F
average of 2-3% p.a. in tandem with the growth of downstream
industries in Asia, including cosmetics, food and medicines.
Challenges in the sector over the next 3 years will include: (i) Cassava chips Cassava pellets
fluctuating prices, which could lead to volatile supply; (ii) downside Native starch Modified starch
risks to output if crop is affected by cassava mosaic disease; and (iii) Others Value (RHS)
falling orders from China as buyers switch to alternative raw Source: Ministry of Commerce (MOC)
material. Note: Forecast by Krungsri Research
2020-2022 Thailand Industry Outlook | Krungsri Research 15Sugar
Situation in 2019
In 1H19, which is the annual grinding season, output of sugarcane Figure 1: Raw Sugar Prices
slipped 11.2% YoY. Discouraged by stubbornly low prices of cents/lb. million tonnes
sugarcane, growers had switched to planting more profitable 40 60
crops. Sugarcane prices tumbled 17.6% YoY to an average of
THB644/tonne in this period. Sugar production contracted by 4.1% 30 50
YoY as domestic demand tumbled 34.6% YoY to 1.9 million tonnes.
While demand for raw sugar from downstream industries shrank, 20 40
demand for white granulated and pure refined sugar had jumped.
In 1H19, exports rose 3.8% YoY to 4.7 million tonnes on stronger 10 30
orders from South Korea, China and Malaysia, but export prices
softened because of high inventories worldwide, especially in Brazil 0 20
and the EU. Hence, prices of raw and pure sugar fell 12.6% and
Jul
Jul
Jul
Jul
Jul
Jul
Jul
Jul
Jul
Jul
Jan-09
Jul
Jan-14
Jan-10
Jan-11
Jan-12
Jan-13
Jan-15
Jan-16
Jan-17
Jan-18
Jan-19
7.3% YoY, respectively. Hence, the export value of Thai sugar fell
11.7% YoY to USD1.36bn.
World Ending Stock (RHS)
For 2H19, sugar production is forecast to slip 14% YoY, in line Raw Sugar No.11 New York Market
with a projected 6% YoY drop in sugarcane output due to drought
Source: OCSB, USDA
in 3Q19. Orders from South Korea, China and Malaysia have
continued to strengthen and will boost export volume by 37% YoY
in 2H19. At the same time, export prices would also surge in Figure 2: Thailand’s Sugar Export Prices
response to short-covering in the futures market; this should lift
export value by 35% YoY in 2H19. Domestic demand has also been USD/tonne million tonnes
strong and should increase by 6-10% amid better outlook for all 700 7
product groups. For 2019, output of sugar should fall by 6-7%. El Nino Effect
600 6
Export volume will rise by 20%, but weak export prices in 1H19 (Drought)
will cap the increment in 2019 export value at 9%. 500 5
400 4
2020-2022 Outlook
300 3
Mild growth over the next 3 years. Expectations of more favorable 200 2
weather should lift annual output of sugarcane to 120-130 million
Jul
Jul
Jul
Jul
Jul
Jul
Jul
Jul
Jul
Jul
Jul
Jan-09
Jan-10
Jan-11
Jan-12
Jan-13
Jan-14
Jan-15
Jan-16
Jan-17
Jan-18
Jan-19
tonnes (+7%), which would translate into 13-15 million tonnes of
sugar (+6.5%). Looking at demand, exports are expected to rise by
Thailand Ending Stock (RHS)
7.5% p.a. to an average of 9-11 million tonnes on stronger orders Raw Sugar
from major export markets in Asia. However, export value will rise White Sugar
only slightly, pressured by low prices. There are several headwinds
that will dampen prices, including: (i) high global sugar inventory Source: Ministry of Commerce (MOC), Compiled by Krungsri Research
which is currently more than 50 million tonnes; (ii) efforts by India to
run down its sugar stock; and (iii) Brazil agreeing to increase imports
of duty-free ethanol from the US, which will encourage Brazilian Figure 3: Thailand Sugar Balance
players to switch from producing ethanol to manufacturing sugar.
million tonnes
Over the same period, domestic consumption is expected to grow by
15
only 0.8% to 2.5-2.6 million tonnes per year because of rising health
awareness and the imposition of sugar tax on the beverage industry. 12
The sector will face several challenges over the next few years, 9
including possible amendments to the Sugarcane and Sugar Act,
which is being reviewed by the Office of the Council of State. If the 6
changes are enforced, they may have an impact on how income is
3
shared between sugar processors and sugarcane growers, which is
currently split 70:30. More importantly, the definition of “molasses”, 0
2011
2012
2013
2014
2015
2016
2017
2018
2019F
2020F
2021F
2022F
may be changed to “other products” so that the sugar and sugarcane
industry would be able to add value to other sectors, especially to
power producers which use biomass and the bio-tech sector Domestic consumption Exports
(including manufacturers of ethanol, plastic pellets, medicines and
Source: USDA and compiled by Krungsri Research
cosmetics). Note: Forecast by Krungsri Research
2020-2022 Thailand Industry Outlook | Krungsri Research 16Oil Palm
Situation in 2019
In 1H19, output of fresh oil palm and crude palm oil (CPO) Figure 1: Crude Palm Oil (CPO) Prices
continued to increase. This was the result of government efforts
from 2008 to 2012 to expand the number and size of oil palm THB/kg USD/tonne
plantations in the country. These estates have matured and are 60 1,400
producing oil palm. Meanwhile, the Manufacturing Production
Index for palm refineries rose 10.5% YoY in 1H19. The Office of 50 World CPO (RHS) 1,200
Agricultural Economics estimates a total of 5.45 million rai of oil
palm estates (+7.1% YoY) will be cultivated in 2019. Combined with 40 1,000
more favorable weather, this will increase oil palm output to a
record high of 16.8 million tonnes (yields will rise by 1.9% YoY to 30 800
3,083 kg/rai) from 15.4 million tonnes in 2018. As such, CPO output
would also surge in 2019, in line with rising domestic demand for 20 Thai CPO 600
CPO.
10 400
In 1H19, price of fresh oil palm tumbled 27.3% YoY to
Jul
Jul
Jul
Jul
Jul
Jul
Jul
Jul
Jul
Jul
Jan-13
Jul
Jan-09
Jan-10
Jan-11
Jan-12
Jan-14
Jan-15
Jan-16
Jan-17
Jan-18
Jan-19
THB2.33/kg, while production cost was THB3.01/kg. Because of
this, palm oil growers have been registering losses since October
2018. The domestic price of CPO also fell 19.1% YoY to Source: Department of Internal Trade (DIT)
THB16.60/kg, only THB1.5/kg higher than Malaysian CPO, closing
the comparative disadvantage. But despite this, CPO exports fell
20.7% YoY to 0.24 million tonnes in 1H19, because India (largest
market for Thailand at 72% of total CPO exports) has cut import Table 1: Thai Palm Oil Key Indicators
tariffs for CPO from Thailand’s competitors, including Malaysia and ‘000 tonnes
Indonesia.
2015 2016 2017 2018E 2019F
Overall situation for the sector will be largely unchanged in 2H19,
and CPO prices will continue to be pressured by supply-demand Production 2,068 1,804 2,626 2,778 2,900
imbalances. In 2019, domestic consumption of CPO is estimated to Import 53 14 6 3 3
rise by 1.4% YoY to 2.5 million tonnes, driven by demand for Domestic Con. 1,886 1,804 2,137 2,427 2,460
refined palm oil and oleo-chemicals. Oil palm output is expected to
surge 9.2% YoY to 16.8 million tonnes. Coupled with 0.47 million - Refined Oil 1,053 988 1,166 1,227 1,230
tonnes of stock carried over from 2018, the larger supply has - Bio diesel 833 816 971 1,200 1,230
prompted the government to intervene to support domestic palm
Export 68 56 303 373 300
oil prices by absorbing excess supply. But that is insufficient to
offset the impact of higher output. Hence, ending stock of CPO Ending Stock 335 294 485 466 449
should be more than 0.4 million tonnes at end-2019, far above the Source: DIT
‘appropriate level’ of 0.20-0.25 million tonnes. This will pressure Note: Forecast by Krungsri Research
prices. In 9M19, price of fresh oil palm plunged 25.5% YoY to
average THB2.4/kg, a 14-year low.
2020-2022 Outlook Figure 2: Thai Oil Palm Plantation and Production
The sector will continue to be affected by oversupply as a result of million rai million tonnes
(i) continuous expansion of planted area; (ii) an influx of maturing oil 8 20
palms planted earlier that are now producing high yields; and (iii)
favorable weather that will support higher yields. Domestic demand
6 El Nino Effect 15
for CPO is expected to rise by 3-4% p.a., underpinned by strong
government support for the sector (e.g. government efforts to
stabilize prices and increase the use of biodiesel). Despite this, the 4 10
supply glut will continue to depress fresh oil palm prices, and this will
affect the palm oil supply chain as follows.
2 5
Oil palm growers will have to contend with stubbornly weak
FFB prices. Although income should recover mildly supported by
government measures, the large supply will keep FFB prices at 0 0
2009
2010
2011
2012
2013
2014
2015
2016
2017
2018
2021F
2022F
2019F
2020F
THB3-4/kg. In addition, unlike contract farmers, independent
growers are normally plagued by lack of access to stable and
reliable markets for their produce. Plantation area Harvested area
Production (RHS)
CPO refineries will see weaker earnings due to low prices,
especially smaller operators that are not part of integrated Source: Office of Agricultural Economics (OAE)
supply chains. This situation will likely persist despite the Note: Forecast by Krungsri Research
anticipated increase in demand for CPO supported by
government measures to promote consumption of biodiesel, to
increase CPO exports, and to use CPO to generate electricity.
2020-2022 Thailand Industry Outlook | Krungsri Research 17Frozen and Processed Chicken
Situation in 2019
In 1H19, the frozen and processed chicken industry saw decent Figure 1: Thai Chicken Export Prices (F.O.B.)
growth with chicken production rising 4.2% YoY on stronger
USD/tonne
demand at home and abroad. Domestic demand was driven by
fast food outlets, retailers and convenience stores. Exports 6,000
surged 8.6% YoY on rising demand for frozen and processed 5,000 Processed
chicken from developed countries, where consumers prefer food
that is easy to prepare or ready-to-eat. China also started to 4,000
import frozen raw chicken from Thailand as substitute for pork Frozen
3,000
which output has dropped as a result of AFS (African Swine
Fever). Export prices inched up 1-2% YoY, in line with global 2,000
prices, which boosted the value of exports by 9.5% YoY. Chilled
1,000
In 2H19, output of chicken will continue to rise by 6-7% YoY
lifted by rising external demand. Demand will be supported by: -
Jul
Jul
Jul
Jul
Jul
Jul
Jul
Jul
Jan-12
Jan-13
Jan-14
Jan-15
Jan-16
Jan-17
Jan-18
Jan-19
(i) the quality of Thai products, which meet international
standards and so, can replace export orders lost by competitors
due to the unresolved bird flu outbreaks; (ii) stronger demand
from countries affected by ASF, especially China; and (iii) new Source: Ministry of Commerce (MOC)
quotas by the EU for imports of chicken and other poultry
products, and with this, higher quota for Thailand. In light of this,
Figure 2: Thai Chicken Exports
2H19 export volume and prices are expected to rise by 5-6% and
2-3% YoY, respectively, and push up export value by 6-7% YoY.
Million tonnes USD, m
For full-year 2019, the industry will register robust growth.
Output of chicken is expected to rise by 5-6% supported by 1.2 4,000
Millions
strong demand, especially in export markets which are forecast
to expand by 7-8%. Markets in developed countries, especially 1.0 3,500
Japan and the EU, will show strong demand for processed
chicken, while frozen chicken is bound largely for China. Average 0.8 3,000
export prices for chicken products should rise by 1-3%, which
would lift the value of exports by 8-9% in 2019. 0.6 2,500
0.4 2,000
2020-2022 Outlook
2012
2013
2014
2015
2016
2017
2018
2019F
2020F
2021F
2022F
The frozen and processed chicken industry should continue to Volume Value (RHS)
register strong growth momentum in the next three years,
supported by rising demand from domestic and export markets. Source: MOC
Note: Forecast by Krungsri Research
Domestic demand for chicken is forecast to grow at an
average rate of 2-3% p.a. This will be driven by 3-4% annual
growth in the fast food sector which is rising in popularity and Figure 3: Broiler & Corn Prices
expanding branch networks operated by both chicken-based THB/kg THB/kg
chains and other types of restaurants. 60 12
Corn (RHS)
Exports will also rise steadily by 4-5% p.a. This outlook is
supported by: (i) the ASF outbreak which could take 2-3 years
50 10
to resolve and chicken as a protein substitute; (ii) the
expansion of new export markets in the Middle East and Africa;
(iii) the quality of Thai exports, which meet international 40 8
standards and so, can replace chicken products lost to
outbreaks of bird flu (e.g. in Japan, the EU and China); and (iv)
indirect effects of the ongoing trade spat or imposition of 30 Broiler at farm 6
import tariffs. For example, China has imposed anti-dumping
duties on chicken imports from Brazil, and diverted imports
20 4
from the US in retaliation to US measures.
Jul
Jul
Jul
Jul
Jul
Jul
Jul
Jul
Jan-12
Jan-13
Jan-14
Jan-15
Jan-16
Jan-17
Jan-18
Jan-18
Despite the positive outlook, the industry will face several
challenges: (i) price competition from suppliers in Brazil,
Argentina and Chile, together with rising production costs Source: TFMA
(labour, logistics and transportation); and (ii) Thai producers
still rely on imported parent chicken stock.
2020-2022 Thailand Industry Outlook | Krungsri Research 18You can also read