Indian Pharmaceutical Industry - Time to re-focus, woes continue, pick ripe fruits - IDBI Direct
←
→
Page content transcription
If your browser does not render page correctly, please read the page content below
September 27, 2016

S e c to r   Re p o r t

Indian Pharmaceutical Industry

    Time to re-focus, woes continue, pick ripe fruits
Sector Report – Indian Pharmaceutical Industry
Table of Contents
Page No.
Summary 3
Investment rationale and outlook 3
Out take and analysis 4
Our stock recommendation 5
Cadila Healthcare: US business help cushion growth (CMP Rs – 393; TP – Rs396; 0.7% upside)
Cipla: Late entrant – pulling up the sleeve (CMP – Rs604; TP – Rs652; 7.9% upside)
Glenmark Pharmaceticals: Upside potential lies in strong NCE pipeline
(CMP – Rs927; TP – Rs992; 7% upside)
Lupin: Growth intact, confident to beat hurdles (CMP – Rs1,495; TP – Rs1,739; 16.3% upside)
Torrent Pharmaceuticals: US – Medium term driver intact (CMP – Rs1,648; TP – Rs1,815; 10.2% upside)
Global Pharmaceuticals Industry: continue to face the classic problem 6
Challenging environment continues to create new nuances 8
US market continues to maintain its superiority 12
Japan a new market 15
Indian companies continue to focus on core businesses 16
Bottom-up approach a key for overall growth 23
Global Perspective 25
Valuation and Risks 26
Annexure: Index of tables and charts 28
Company Section
Cadila Healthcare 31-39
Cipla 41-51
Glenmark Pharmaceuticals 53-64
Lupin 65-75
Torrent Pharmaceuticals 77-85
Disclaimer 86
Disclosures 87
2
September 27, 2016
SECTOR
COMPANY
Indian Pharmaceutical Industry
REPORT
REPORT Time to re-focus, woes continue, pick ripe fruits
Summary
Pharmaceutical companies across the globe are facing the same problem – 1) fierce competition, 2) shorter time-to-market, 3) expiring patents, 4)
slowing sales growth, and 5) declining profitability in developed markets. Thus they need to find solutions to beat these challenges. Additional
woes adding-on are the regulatory issues and currency movement which are negatively impacting the near-term outlook which includes existing
US business and future ANDA approvals. Based on our analysis, we believe that the overhang of the sector seems to be already priced in especially
relating to the adverse regulatory actions like Form 483s or Warning Letters and have seen the S&P BSE Healthcare underperforming in the
current YTD (year till date) post a outperformance observed in the in eight out of the past nine annual cycles. We initiate coverage with companies
which we believe are “ripe fruits” in the pharmaceuticals basket. Unlike before, when there was a premium enjoyed by the large-cap companies,
the gap between the large-cap players and mid-cap have substantially narrowed and prefer stocks which will deliver. We like Lupin (BUY, 16.3%
upside potential, target PER of 23x), Cipla (ACCUMULATE, 7.9% upside potential, target PER of 24x), Glenmark (ACCUMULATE, 7.0% upside
potential, target PER of 20x), and Torrent Pharma (ACCUMULATE, 10.2% upside potential, target PER of 22x). We are cautious towards Cadila
(HOLD, 0.7% upside potential, target PER of 21x).
Investment rationale and outlook
Expecting the India Pharmaceutical Market (IPM) growth range bound
We believe, the growth in the IPM would be range bound between 12-15% YoY against earlier estimation of 18%, due to the changes in the
NLEM (National List of Essential Medicines)2015, which will enlarge the span of control adversely impacting value growth. To add to the
whammy, there is intense competition which is leading to a continuous price erosion and further ban of 344 fixed drug combination (FDC) drugs
puts pressure on the industry. Therapies namely anti-infective, respiratory, gastrointestinal and anti-malaria continued to show strong growth
during August 2016.
Sector coverage initiated with focus on companies with visibility
Generic drugs constituted more than 85% of the US prescription market up from one-third in 1990. In our view, the Indian pharmaceuticals
sector is poised to grow however the growth to some extent will be capped. We initiate coverage with a positive bias towards the sector,
however believe it makes sense to have a basket of specialty generics in the portfolio as they will find it easy to sustain, grow and maintain the
niche position.
Regulatory compliance key for future growth
We believe, the future growth of all the companies under our universe will be directly impacted via the responses from the regulators mainly US
FDA. The increased citings for individual domestic plants recently has created a fear of getting Form 483s or Warning Letters, thus either
impacting the future approvals and current supply disruption.
Low leverage is the a key for consolidation
Historically, all the domestic players have acquired companies and assets and then build their franchise in the regulated markets. Next step for
them to grow in the existing markets would be tying up for some specific brands which they can service from their low leveraged balance sheet.
Also growing the franchise in the semi-regulated markets and emerging markets would need investments which in the beginning would impact
the return ratios.
Prefer PER valuation on a long-term basis
While PBR and ROE effectively reflect the premium given to profitability, PER valuations in the generics space reflect the quality of the business.
We believe that over a long period of time, PER bands will stand the test of time, as they have in the past. We have derived our target prices by
assigning varying PERs based on one-year forward earnings.
Table 1: Consolidated financial projections
Revenues (Rs mn) EBITDA (Rs mn) Adjusted PAT (Rs mn) EPS (Rs)
Particulars
FY16 FY17E FY18E FY16 FY17E FY18E FY16 FY17E FY18E FY16 FY17E FY18E
Cadila Healthcare 93,583 99,392 115,104 19,036 21,522 25,323 14,186 16,273 19,320 13.9 15.9 18.9
Cipla 136,783 166,334 191,295 25,011 30,028 37,302 15,059 16,015 21,806 18.8 19.9 27.2
Glenmark Pharmaceuticals 76,340 92,507 105,925 14,822 22,020 24,872 7,671 12,475 13,996 27.2 44.2 49.6
Lupin 136,816 171,722 198,180 32,465 43,969 51,018 22,588 30,480 34,059 50.1 67.6 75.6
Torrent Pharmaceuticals 65,290 61,392 69,290 25,729 16,521 20,094 18,627 11,086 13,963 110.1 65.5 82.5
Source: Company; IDBI Capital Research
Sector Report – Indian Pharmaceutical Industry
Our take and analysis
We initiate with a Positive sector rating, with a positive bias toward companies with visibility
Over the past six years, industry growth rates in the India market have been far higher than those of the US
market, as have profit margins. Increasing competition in the US market has led to the generics market
shrinking in value terms, whereas we forecast sales in the Indian market to expand by 12-15% annually over the
next three years. India is the largest provider of the generics drugs globally and with the Indian generics
accounting for 20% of global exports in terms of volume. More than 85% of the US prescriptions as today filled
with generic drugs, saving Americans more than USD200bn in healthcare costs annually (Source: 2015 GphA).
We believe post the re-rating of all the stocks especially the large-cap which have been mainly due to the
adverse regulatory approvals, we see FY17 to be a year of adhearing to norms by respective companies and
getting some breather from the regulator. We initiate our Positive rating on the sector. We like Lupin (BUY,
16.3% upside potential, target PER of 23x), Cipla (ACCUMULATE, 7.9% upside potential, target PER of 24x),
Glenmark (ACCUMULATE, 7.0% upside potential, target PER of 20x), and Torrent Pharma (ACCUMULATE, 10.2%
upside potential, target PER of 22x). We are cautious towards Cadila (HOLD, 0.7% upside potential, target PER
of 21x).
Indian producers enjoy cost- and process-based competitive advantages
Production costs in India are around one-third of those in the US, but slightly higher than those in China.
However, we believe India benefits from stronger chemistry skills and regulations than China, and have a higher
number of US FDA-approved plants than China.
We forecast domestic formulation sales to rise by 12-15% annually
Sales of domestic formulations have risen by around 14% annually over the past three years, and we forecast
them to rise by around 12-15% per year over the next three years taking into account the change over the
NLEM and FDC impact. Therapies namely anti-infective, respiratory, gastrointestinal and anti-malaria
continued to show strong growth during August 2016. Several Indian pharmaceutical companies are pursuing
R&D actively in the vaccines and anti-retrovirals (ARV) segments, which are seeing limited development
investment from Western companies.
Valuation
We believe that comparative PER bands in the generics space will continue to change over time. While high
sales growth warranted a premium when Indian generics drugs entered the regulated markets, but recently
due to the eagle eyes by the regulators on the plants especially US, increasing competition in generics and
continuing pricing pressure along with string of acquisitions by Indian players, we believe the future margins
and return ratios will surely get impacted.
We prefer PER valuations on a long-term basis
We prefer a basket approach with business models that deliver stable revenue growth. While PBR and ROE
effectively reflect the premium afforded to profitability, PER valuations in the generics space reflect the quality
of the business. We believe that over a long period of time, PER bands will continue to stand the test of time.
We derive our one-year target prices by assigning varying target PERs using our one-year forward earnings
forecasts. We have assigned the following target PERs: 20x for Cadila, 24x for Cipla, 21x for Glenmark, 22x for
Lupin, and 21x for Torrent.
Table 2: Valuation
Company Bloomberg CMP Tgt Return Year PE (x) EV/EBITDA (x) Dividend Yield (%)
Name code (Rs) Rating (Rs) (%) end FY16 FY17E FY18E FY16 FY17E FY18E FY16 FY17E FY18E
Cadila CDHIN 393 HOLD 396 0.7 March 28.4 24.7 20.8 21.9 19.2 16.1 0.8 1.0 1.3
Cipla CIPLAIN 604 ACCUMULATE 652 7.9 March 32.2 30.3 22.2 21.1 17.4 14.0 0.3 0.7 0.7
Glenmark GNPIN 927 ACCUMULATE 992 7.0 March 34.1 21.0 18.7 19.8 13.2 11.5 0.2 0.6 0.8
Lupin LPCIN 1,495 BUY 1,739 16.3 March 29.8 22.1 19.8 22.7 16.4 13.9 0.5 0.5 0.5
Torrent TRPIN 1,648 ACCUMULATE 1,815 10.2 March 15.0 25.2 20.0 11.2 17.2 13.8 2.1 1.2 1.4
Source: Company; IDBI Capital Research
4
Sector Report – Indian Pharmaceutical Industry
Our stock recommendation
Cadila Healthcare (HOLD, TP – Rs396; 0.7% upside)
Cadila is a market leader in key therapeutic segments, namely CVS, GI, respiratory and female healthcare in the
domestic market. Acquisition of Biochem has strengthened its anti-infective portfolio in India. Growth in the US
market is set to be driven by new product launches and we await of the closure of the Warning Letter at its
Moraiya facility from the regulator. Despite the issues with the US FDA, US to remain the key driver with its
strong pipeline of launches and site transfers of near-term important products. Its entry in the next leg of
growth in pharmaceuticals sector namely biosimilar is supported by its own pipeline of 20 biosimilar and 4
novel biologics. On the margin front, we believe US and India formulations will be the growth drivers.
Cipla (ACCUMULATE, TP – Rs652; 7.9% upside)
Cipla is amongst the top three companies in the domestic pharmaceutical formulation market with leadership
in respiratory segment. We expect the 1)future product launches based upon the strong product pipeline to
support growth in US and Africa regions, 2) pick up in the domestic sales growth from 2QFY17 led by launches
in the respiratory and AI segment, 3) restructuring in the emerging markets (EM) and European Union (EU), and
4) disappearance of seasonality impact in API export sales.
Glenmark (ACCUMULATE, TP – Rs992; 7.0% upside)
Glenmark is a research-focused pharmaceutical company focusing on the discovery of new molecules (both
NCE and biologics). Glenmark is one of the fastest-growing companies in the domestic formulation market with
a domestic ranking of 17th and 8 brands being a part of the top 300 brands. The dermatology segment
continues to be a key revenue driver for the company, accounting for about 30% of its domestic formulation
business and growing at 25% in FY16. The company sells formulations and APIs in both regulated and non-
regulated markets. Any positive development in the NCE/NBE can provide further upside to our valuations as
we have not factored any upside from R&D. We have not factored any NCE licensing income in our forecasts.
Lupin (BUY, TP – Rs1,739; 16.3% upside)
Lupin is an India-based global pharmaceutical company engaged in the development and marketing of generic
and branded formulations and APIs for the developed and developing markets which has grown from a focused
bulk drug manufacturer in the anti-TB and a cephalosporin segment. Lupin is ranked 5th largest and fastest-
growing generics player in the US and also the 8thpharmaceutical company in India. We expect the 1) domestic
business to grow as key growth to continue in lifestyle and chronic therapy segments,2) key launches in the US
market with value FTF launches, 3)integration of product acquisitions in Japan, and 4) EBITDA margin to expand
inspite of pressure in the US base business.
Torrent Pharmaceuticals (ACCUMULATE, TP – Rs1,815; 10.2% upside)
Torrent is a leading chronic-focussed pharmaceutical company, and post the integration of Elder brands we
expect the domestic business to continue its trajectory upwards. Across the sector, domestic business has got
impacted negatively by the NLEM/ WPI/ DPCO however, we believe for Torrent; reduction of bonus schemes
and focus on prescriptions growth in the domestic market will play out. We believe that there has been a high
base in FY16 with the greater contribution from Abilify which has already started experiencing price erosion,
however, we believe going ahead US business will be a little muted due to continued competition in newly
launched Nexium and Detrol. We believe with a launch of ~10 products in US in FY17, it will help reduce the
dent.
5
Sector Report – Indian Pharmaceutical Industry
Global Pharmaceuticals Industry: continue to face the classic problem
The Global Pharmaceuticals Industry is valued at USD1.1tn (grown at a CAGR of 6.2%(2005-15) and is expected to
reach nearly USD1.4tn by 2020. This CAGR growth of 4.9% from 2014-20 at constant currency is expected to
decelerate the momentum of growth mainly attributable to the problems like – 1) fierce competition, 2) shorter
time-to-market, 3) expiring patents, 4) slowing sales growth, and 5)declining profitability in developed markets.
Table 3: Global Pharmaceuticals Sector
2005 2006 2007 2008 2009 2010 2011 2012 2013 2014 2015
Total World market (USD bn) 608 654 728 799 832 888 965 968 993 1057 1100
Total World market (Constant USD bn) 599 643 692 736 788 833 877 903 948 1027 1095
YoY Growth (Constant USD, %) 7.4 7.5 6.5 7 5.7 5.3 3 4.9 8.4 6.6
Source: IMS Health Market Progosis; IDBI Capital Research
North America continues to have the largest pie in the pharmaceuticals sector by contributing 31% in 2015 (38% in
2014), followed by Europe 23% and Asia / Africa/ Australia 19% respectively.
Table 4: Global Pharmaceutical market by Region 2015-20
(% , at constant USD) YoY (%) CAGR (%)
2015 2014 2013 2009-2015 2015-2020E
Total unaudited and audited global market 6.6 8.4 4.9 5.4 4.8
Total unaudited and audited global market by region
North America 6.4 11.8 3.6 4.5 2.7-5.7
Europe (EU and non-EU) 3.4 4.1 2.4 1.9 1.3-4.3
Asia (including Indian Sub-continent) /Africa/ Australia 8.5 9.1 10.0 12.4 6.9-9.9
Japan 1.6 1.4 3.0 2.0 -0.8-2.2
Latin America 9.0 11.7 7.8 10.2 4.8-7.8
Source: IMS Health; IDBI Capital Research
The ‘patent cliff’: Mini Cliff in 2016
Between 2010 and 2018, it is estimated that there would be generic erosion which will wipe an estimated
USD165bn off the pharma industry’s revenues. Furthermore, the loss of patent for many blockbuster drugs has
made a big impact on the global pharmaceutical industry benefitting the generic manufacturers as they are
poised to capture a substantial portion of revenues with their generic versions of these drugs. Generic drugs
constituted 85% of the US prescription market in 2015, up from 33% in 1990, due to the increasing availability
of drugs in a generic form as patents expire, along with patients choosing lower-cost options. Increasing
acceptance of generics has led to intensified competition, exerting constant pressure on prices, leading to price
declines over the past five years.
Chart 1: Mini patent cliff - Branded drug patent
35
32.8
30 27.7
25
20.7
(USD bn)
18.9
20 16.6
15.4
15
10.3 11 11.1
10
5
0
2010 2011 2012 2013 2014 2015 2016 2017 2018
Source: IMS Health, Optum, IDBI Capital Research
6
Sector Report – Indian Pharmaceutical Industry
The pace of expiration for CY2016 has picked up as the multi-billion brands have either gone off patent or
expected to go off patent namely, Crestor, Benicar, Zetia, Humira, Epzicom
Chart 2: Large 2016 patent expires, some generics already launched
7000 May
6000
5000
(USD mn)
4000
Oct
3000
Dec
2000 Oct Mar Dec Dec
1000
0
Crestor Benicar Zetia Seroquel XR Epzicom Kaletra Norvir
Source: IMS Health, Optum, IDBI Capital Research
Increasing generic penetration
Contribution of generic drugs continues to gain momentum with the increasing acceptance of generics which
has led to intensifying competition that has exerted constant pressure on prices, resulting in price declines over
the decade. Generic drugs account for more than 85% of the US prescriptions, saving Americans more than
USD200bn in healthcare costs annually up from one-third in 1990. (Source: 2015 GphA). However, recently
trends in some of the high-cost generic drug utilization and spend is also coming under scrutiny. Even in Japan,
government continues to push generic penetration.
Rising drug discovery cost
With fewer unmet needs, developing new medicines is becoming an increasingly expensive business. Annual
output of the pharmaceutical industry has effectively flat-lined over the past years.
Increasing government pressure with harsher price controls and taxes
The rules governing the development and manufacturing of medicines are getting tighter. Both the European
Medicines Agency (EMA) and the US Food and Drug Administration (FDA) now focus more heavily on risk
management. The FDA is building an active surveillance system to monitor the safety of all medicines in the US
market. This is leading to a lot of companies which are getting scrutinized regularly in order to adhere to the
norms and regulations.
Spiralling healthcare cost
Healthcare expenditure as a percentage of gross domestic product (GDP) is rising. The steepest rise is seen in
the mature markets, where the industry has historically earned most of its revenue.
Regulators now collaborating across the world
Regulators around the globe are working closely with each other, which effectively means that if any product
gets rejected in one region is more likely to be rejected in others. Thus, it is a mandate among all the
companies to comply with stringent security norms.
7Sector Report – Indian Pharmaceutical Industry
Challenging environment continues to create new nuances
Pharmaceutical companies across the globe are facing the same problem – 1) fierce competition, 2) shorter time-to-
market, 3) expiring patents, 4) slowing sales growth, and 5) reducing profitability in developed markets.
Pharmaceutical players are now hunting for new solutions to these challenges in order to generate revenues in a
difficult business environment.
Chart 3: Global pharma: Top 10 companies by 2016 world wide Rx and OTC sales (USD bn)
Pfizer + Allergan 70.4
Pfizer 48.0
Novartis 44.5
Roche 39.8
Sanofi 39.7
Merck & Co 37.9
GlaxoSmithKline 33.5
Johnson & Johnson 33.2
Glilead Sciences 30.1
AbbVie 26.0
AstraZeneca 22.7
0.0 10.0 20.0 30.0 40.0 50.0 60.0 70.0 80.0
Source: EvaluatePharma; IDBI Capital Compilation Research
Inorganic growth (M&A, Collaborations, Joint Ventures, Alliances, Partnerships)
There seems a clear shift of pharmaceutical companies announcing more M&A transactions globally YoY, this
inturn has helped the company either to consolidate, diversify, gain access in niche markets or refocus on core
businesses. In the pharmaceuticals segment, rising demand for generic drugs and the loss of revenue from
blockbuster patent expiries is driving consolidation, with both research-based and generics companies looking
for acquisitions of all sizes. Many of the Indian companies are also have a strong appetite due to strong cash
generation and comfortable balance sheets.
Table 5: Recent Iconic deals in pharmaceutical sector
Players Deal size, details
Pfizer acquired Allergan Potential (USD 160 bn)
USD 70.5 bn (Actavis took Allergan name and announced divestment of its
Actavis PLC acquired Allergan Inc
generic business to Teva for USD 40.5 bn
Pfizer attempting to acquire
Offering USD 118 bn for hostile takeover
Astrazeneca
Novartis International AG unit swap
USD 19bn for unit swap
with GlaxoSmithKline
Pfizer acquired Hospira USD 17bn
Bayer AG acquired OTC business of
USD 14.2bn
Merck & Co
Valeant Pharmaceuticals acquired Salix
USD 11.1bn
Pharmaceuticals
Lilly acquired Animal Health unit of
USD 5.4bn
Novartis
Mylan Inc’s acquired Abbott’s generic
USD 5.3bn
products
Nicho-Iko Pharmaceutical acquired
USD 736mn
Sagent
Source: IDBI Capital Research Compilation
8Sector Report – Indian Pharmaceutical Industry
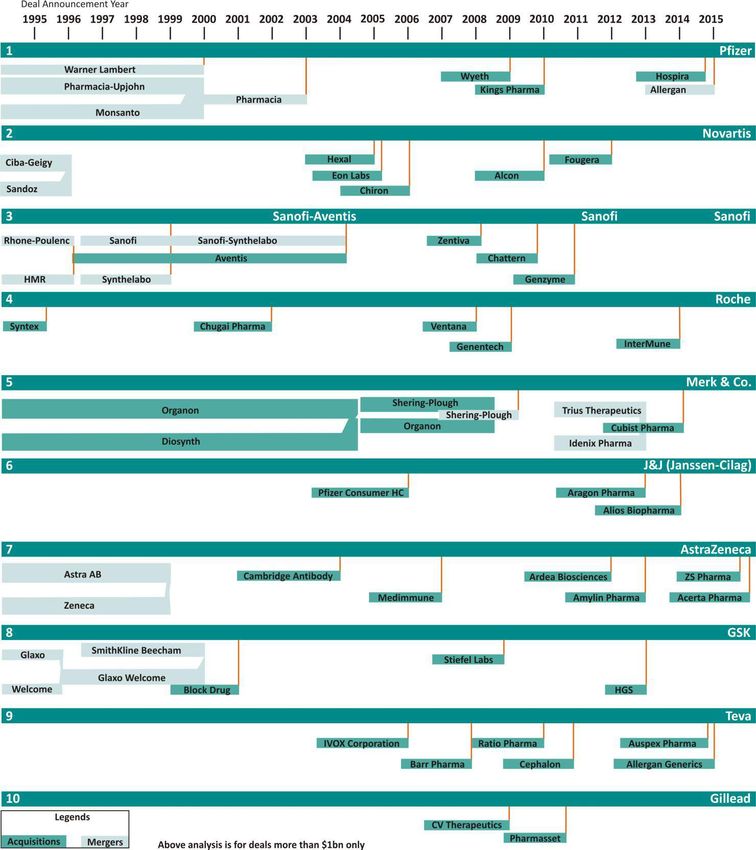
Statistics show that over a period of just two decades (1995-2015) as many as 60 companies became just 10.
Chart 4: Pharma Industry M&A 1995-2015
Source: Company reports, Fierce Pharma, IDBI Capital Research Compilation
9Sector Report – Indian Pharmaceutical Industry
Till now we observed the “Heard Mentality” of attempting to acquire brands or businesses to strengthen
respective companies franchise in regions or therapeutic segments. However, for the first time Hyderabad
based Gland Pharma’s 86% of assets got valued for USD1.26bn by a Chinese firm Shanghai Fosun. Injectables
space continue to remain a premium interest to buyers – In 2013, Strides Arcolab sold Agila Specialities to
Mylan for USD1.75bn also in October 2015, Reciphatm AN acquired Nitin Lifesciences for USD100mn.
Collaborations happening in the domestic market
Indian companies have been seen to pursue inorganic growth aggressively. Among the large deals –
closure of Lupin’s acquisition of Gavis Pharmaceutical and Novel Laboratories and Sun Pharma’s
acquisition of Ranbaxy Laboratories have been incorporated for otherwise sticky growth. The increasing
interest follows from the companies which are having a global scale and are looking to restructure.
Partnerships and informal collaborations also comprise an important part. From the India perspective, Dr
Reddy’s Laboratories announced a strategic collaboration with Turkey based TR-Pharm involving three
biosimilar products which has been seen as an explosion of technology-based treatment innovations are
driving both horizontal and vertical M&A activity.
In the generic oral dosages also recently, we see companies attempting to acquire brands to build a
stronger franchise:
o Aurobindo is looking to raise funds to acquire the European assets of Teva Pharmaceuticals to build a
strong franchise for ~USD 1.3bn, Aurobindo has done a series of small-sized acquisitions largest being
of USD133mn for Natrol in US, Rs250Cr paid to Actavis in Jan 14 for buying its commercial operations
in seven western European countries.
o Agreement with US based Particle Sciences Inc with Glenmark Pharma will help strengthen its US
franchise to develop and market a generic version of Celgene’s Abraxane which is used for treatment
of breast and lung cancer.
o Torrent Pharma and Intas Pharma is also looking to join the fray for Teva products in Europe. For the
some products of Teva, company has signed array of deals with Dr Reddy’s, Impax, Mayne and Zydus
Cadila.
o Astellas and Shionogi are divesting a basket of drugs which could fetch them ~USD 100mn, Lupin
recently closed the deal Astellas and Shionogi in Japan to buy the off-patent medicine brands worth
USD100mn. Japan business contributes ~10% its total revenues and this will further strengthen its
Japan positioning.
o Further, there are discussion happenings between the Cipla and Wockhardt for a broader business
alliance wherein the companies are exploring the best synergies in order to face the serious market
and regulatory challenges.
New business segments
As stated earlier, patent expiry and limited growth prospects in existing markets have forced companies to hunt
for new ventures in order to attain new growth. In the developed markets, some companies have decided to
enter developing markets by marketing tie up e.g. a co-marketing tie up between Sun Pharma and Merck for
patent licensing agreement for Januvia.
10Sector Report – Indian Pharmaceutical Industry
Getting into the new league of Biotechnology/Bio-similars thus moving up the value chain
Increasing demand for biotechnology and biosimilars are a derivate from the demand for innovative treatment.
The global biosimilar market was at USD2bn in 2012 is projected to reach USD19.4bn by 2018 which is expected
to grow at a CAGR of 36.6% over 2009-18. However, it is recently estimated to record sales of USD25bn by
2020. Some relevant example here is Merck which entered the biosimilars market in 2012 through an
agreement with Dr. Reddy's or even US based Particle Sciences inked with Glenmark Pharma to develop and
market the generic of Celengene’s Abraxane used in the treatment of breast and lung cancer.
Regulatory authorities being a little stringent
Recently, heightened regulation means more stringent quality measures and increased scrutiny of drug
manufacturing processes and materials. The pharmaceutical industry has witnessed significant product recalls
in the recent years, highlighting stringency in the quality measures. Also leading to companies having to pay
large penalties. Regulators around the globe are working closely with each other, which effectively mean that if
any product gets rejected in one region is more likely to be rejected in others. This scrutiny’s have impact the
companies by some delays in approvals or supply disruption finally impacting the earnings.
11Sector Report – Indian Pharmaceutical Industry
US market continues to maintain its superiority
Contribution of generic drugs continues to gain momentum with the increasing acceptance of generics which has led
to intensifying competition that has exerted constant pressure on prices, resulting in price declines over the decade.
USA is the world’s largest pharmaceutical market, both for branded and generics drugs, accounting for more than
30% of the global market. However the landscape of the market is constantly changing US generic penetration is
expected to rise from current 85% to 92% by CY2020, while the patent expiries from CY16-20 is expected to be
~USD92bn.
US continuously gaining pie with higher level of filings especially in the niche segments
The US continued to dominate the world of innovation and inventions by filing 57,385 international patent
applications last year. International patent applications under the WIPO’s Patent Cooperation Treaty (PCT) grew
by 1.7% last year. 70% of generics market (USD 68bn) is currently oral solids and liquids. Currently, there is a
strong concentration among the few players who are currently in the alternative dosage forms other than oral
solids. The overall applications to the niche specialties seems to have continuously going up.
Chart 5: US generics : complex generics still present a big opportunity
77% 84%
71% 68%
US Gx 51%
37%
Penetration 18% 23%
(by TRx)
Oral Solids Injectables Dermatology Liquids Patches Inhalants Ophthalmics Nasals
# of players
47 17 14 6 6 2 5 3
(>$100 mn)
Market Size
45.0 8.4 5.9 1.9 1.5 1.7 1.3 0.5
($ bn)
Source: Companies; IDBI Capital Research Compilation
Channel consolidation resulting in price erosion
In the United States, a pharmacy benefit manager (PBM) is a third-party administrator (TPA) of prescription
drug programs for commercial health plans, self-insured employer plans, Medicare Part D plans, the Federal
Employees Health Benefits Program, and state government employee plans. Now the top 3 retailers controls
~61% vs 44% in FY11. Similarly, top 3 PBMs control ~75% of market Vs 49% in FY11.
Chart 6: US generics channel - PBMs
Others like Cardinal
Health, PharMerica ect
MedImpact 8%
5%
Humana
6%
Prime Therapeutics Express Scripts
6% 29%
Catamaran+Optum Rx CVS Caremark
22% 24%
Source: IDBI Capital Research Compilation
12Sector Report – Indian Pharmaceutical Industry
GDUFA goals – FDA approved a record ANDAs in CY15
USFDA has revisited its goals and the pace of approvals has seen a strong growth. Over the past we see that
CY15 has the best approval year, meaning better levels of launches however, the other side more competition
thus significant price consolidation. However, the other side is the implementation of GDUFA (Generic Drug
User Fee Act) included setting up an office in Mumbai to improve compliance and quality standards thus
increase in the number of inspections.
Chart 7: Total ANDAs – Total agency actions in CY15 Chart 8: US FDA – No. of ANDA approved
1000 700
900 68 67
Number of Actions
800 114 115 600
59
700 60 99
600 98 138 64 75 72 67 500
114
500 91 102 106 92
38 25 400
400 28 108 94 726 720
300 102 584 569 300
482 469 494 481 531
200 334
100 259 324 200
0 100
Jun-15
Dec-15
Nov-15
Jul-15
Oct-15
Feb-15
Apr-15
Sep-15
May-15
Aug-15
Jan-15
Mar-15
0
FY06
FY07
FY08
FY09
FY10
FY11
FY12
FY13
FY14
FY15
FY16
FY17TD
CY2015 Calendar Month
AP + TA CR ECD/IR Number of ANDA approvals
* AP + TA = Final Approval + Tentative Approval; CR = Complete Source: US FDA, IDBI Capital Research Compilation
Response; ECD/IR = Easily Correctible Deficiency/Information Request
Source: US FDA, IDBI Capital Research Compilation
Price hikes in popular generic OTC under scrutiny
There are a lot of discussions/ scrutiny undertaken in US regarding the popular generic OTC products and their
price hikes which have been much ahead of the inflation levels. This is negative for all the generic suppliers who
enjoyed decent market shares along with high margins for their niche generic products. This would clearly
impact the US business of our universe stocks.
Chart 9: US generics : thousands of generic drugs saw prices rise between 2008-2015
3,000
Of 21,006* generic drugs analyzed by Connecture, 9,613 saw price movement
2,500 during the period. The remaining 11,393 drugs saw no price range.
Number of drugs*
2,000
1,500
1,000
500
0
More than 500% to 100% to 25% to 10% to 0% to 10% 0% to - - 10% to - More than
1,000% 1,000% 500% 100% 25% - 10% - 30% -30%
* Individual drug/dosage/package combinations
Source: Connecture; IDBI Capital ResearchCompilation
13Sector Report – Indian Pharmaceutical Industry
o Substantial hikes in the dermatology products: Taro is the maker of many popular generic OTC ointments,
including antibiotic pain relief and Hydrocortisone creams used to relieve itching and minor skin rashes. It also
manufacturers prescription creams such as Clobetasol, which treats a variety of skin disorders including eczema
and psoriasis. Taro coming under the lense was post the story published by the Boston Globe last year
highlighted concerns about the rising prices of some generic drugs, including Clobetasol, which is made by
several companies. The newspaper reported that the price of Clobetasol rose to USD4.15/gram 2015 from
USD0.26/ gram in 2013. In 2012, pharmacy benefit manager Express Scripts pointed out that spending on
dermatology drugs was up more than 18% in a short time, primarily because of higher prices for individual
drugs. Most of those are made by Taro, Perrigo and Fougera, which Novartis now owns. Similarly a study last
year published in the Journal of the American Medical Association showed that prices for 19 brand-name
dermatology drugs, including two from Valeant Pharmaceuticals, had increased almost 5x, on average, over 6
years. Price hikes on drugs from Big Pharma players Novartis and GlaxoSmithKline have also come under
scanner.
o Hikes undertaken in the life saving generic drugs: Valeant Pharmaceuticals and Turing Pharmaceuticals had
come under scrutiny for hiking the price of life-saving drugs. Turing is also facing antitrust probes by the Federal
Trade Commission(FTC) and the New York attorney general post its then-CEO mentioned about the 5,000%
price hike the company had taken on daraprim, a standard-of-care drug for toxoplasmosis infections. While the
drug is a generic, Turing was the sole producer at the time, giving it a monopoly position. It raised the price
from USD13.50/pill to USD750/pill shortly after gaining ownership of the drug. Separately, Valeant faces
investigations by federal prosecutors into its pricing and distribution. Lannett bumped its price for ursodiol
more than 1,000% to USD5.10/capsule from USD0. 45/capsule, competitors followed Lannett’s lead and priced
their versions at about the same amount. Others include Allergan, which recently sold its generics unit to Teva,
Par Pharmaceutical and Impax Laboratories. More recently, Mylan NV has come under scrutiny for raising the
price of its allergy auto-injector Epipen by 400%-plus and dominates the market.
There are strong reasons to believe that this is because of the recent elections which are underway wherein in
the campaign trail, with Democratic presidential nominee Hillary Clinton said that if elected in November, she
would create an oversight panel to protect U.S. consumers from large price hikes on long-available life-saving
drugs.
Chart 10: US revenues of companies (FY16, Rs mn) Chart 11: US revenues as % of total sales (%)
Lupin Lupin
Cadila Healthcare Cadila Healthcare
Torrent Pharma Torrent Pharma
Glenmark Glenmark
Cipla Cipla
- 20,000 40,000 60,000 80,000 - 10 20 30 40 50
Source: Companies, IDBI Capital Research Source: Companies, IDBI Capital Research
14Sector Report – Indian Pharmaceutical Industry
Japan a new market
As per Dec 2015, Japanese pharmaceuticals market is at ~USD73bn accounting to ~7% of the USD1tn global
pharmaceuticals market. It is estimated by IMS that the Japanese market is expected to increase slightly over the
next five years and growth forecast between 1-4% mainly on the back of price cuts, as the government is pushing
more generic penetration. Indian companies are trying to tap the Japanese market as it is the second largest generic
market after US. Some companies like Lupin who entered the region over 10 years back are making further
investments in Japan, while we see new entrants like Sun Pharma also venturing into the region with product as well
as marketing tie-up.
Lupin has undertaken 2 acquisition in Japan – Kyowa and I’rom and the revenue from the inception in FY08 has
grown at a CAGR of 16% (FY08-FY16) at constant currency and currently is ranked 9th in the Japan’s generic
companies with leadership in CNS segment and strong presence in CV, GI and injectables. We believe, Lupin has
been enjoying its advantages of early-entry in the region. Japan contributes 10% of its total revenues. It is
assumed that post this acquisition Kyowa’s (Lupin’s Japan subsidiary) ranking would increase to 6th and
strengthen its portfolio in CNS, Oncology, CV and AI therapies post acquiring 21 brands. It is believed that the
21 brands is amounting to JPY9.4bn for which Kyowa will pay JPY15.4bn i.e. 1.6x sales.
Sun Pharma has recently acquired 14 established prescription brands from Novartis in Japan for a cash
consideration of USD293mn (~Rs19.4bn) equivalent to 1.8x sales. These 14 brands would have combined
annualized revenues of approximately USD160mn across several therapeutic areas. Furthermore, Sun Pharma
entered into a distribution alliance with Mitsubishi Tanabe Pharma Corporation in Japan for these
aforementioned products.
Cadila Healthcare also entered the Japan markets in 2007 when it acquired Nippon Universal Pharmaceuticals,
but announced exit from Japan last year mainly due to issues with the pricing pressure and regulatory hurdles.
15Sector Report – Indian Pharmaceutical Industry
Indian companies continue to focus on core businesses
The India Pharmaceutical Industry is valued at USD20bn (which is 3rd largest in terms of volume and 13th largest in
terms of value), and is estimated to grow at 20% CAGR over the next 5years. It is estimated that the India
pharmaceuticals growth will outperform the global pharmaceuticals due to 1) continuous growth in the domestic
market, and 2) poised for growth in the global market. India is the largest provider of generic drugs globally with the
Indian generics accounting for 20% of global exports in terms of volume. Of late, consolidation has become an
important characteristic of the Indian pharmaceutical market as the industry is highly fragmented.
Chart 12: India revenues of companies (FY16, Rs bn) Chart 13: India revenues as % of total sales (%)
Cipla Cipla
Lupin Cadila
Cadila Torrent Pharma
Glenmark Glenmark
Torrent Pharma Lupin
0 10 20 30 40 50 60 0 10 20 30 40
Source: Companies, IDBI Capital Research Source: Companies, IDBI Capital Research
India Pharmaceutical Market (IPM), posted a YoY growth of 15.3% in Aug 2016
The IPM grew at 9.6% YoY in June 2016, 14.7% in July 2016 while 15.3% in Aug 2016 and was at Rs100bn; this
shows some signs of recovery. This slight revival is in-line after a dip in growth observed in earlier months post
the ban imposed on the 344 FDCs by the government which affected the buying patterns in the market, DPCO
(Drugs Price Control Order)1995 introducing prices of essential drugs thus revising NLEM 2013, 2015 lists and
WPI impact. We feel there would be further revisions in the NLEM (national list of essential medicines) lists
going forward. This growth was primarily due to its steady volumes, sustained healthy price hikes and new
launches. It is observed that during 1QFY17 the volumes had got negatively impacted and declined 1%, while
July and August months experienced volume growth of 3% and 9% YoY respectively. In India, the retail channel
contributes 84% of the overall sales (up 9% YoY) while the hospital and doctor channel contributed to 16% of
the overall sales (up 17% YoY) on a MAT basis. The acute therapies contributed 66%, however, chronic
therapeutic segments outpaced acute therapies consistently in terms of growth at 10.7% for the month vis-à-
vis a 9% growth for acute therapy areas. Volumes contributed 9%, prices 3% and new launches 3% respectively
to the growth for Aug 2016. With the seasonality visible in the segment, therapy-wise, the anti-infective (20%),
respiratory (32%), gastro (14%) and anti-malarial(39%) outperformed IPM growth.
Chart 14: Quarterly trend in IPM (volume and price growth)
20.0
15.0
10.0
5.0
0.0
1QFY15 2QFY15 3QFY15 4QFY15 1QFY16 2QFY16 3QFY16 4QFY16 1QFY17 Jul-16 Aug-16
-5.0
Volume Price New Product
Source: IDBI Capital Compilation
16Sector Report – Indian Pharmaceutical Industry
The NLEM (national list of essential medicines) portfolio grew at 4.8% YoY, while the non-NLEM portfolio grew
at 17.3% (vs 1.6% /11.2% respectively in July 2016) and the banned drug(FDC) portfolio further de-grew 11.5%,
while the non-banned drug portfolio grew 15.9% on increased volumes.
We believe, the growth in the IPM would continue to be below potential growth earlier estimated 18% YoY to
be range bound between 12-15% YoY due to the change over to the NLEM 2015 and impact of FDC, which will
enlarge the span of control adversely impacting value growth. To add to the whammy, intense competition is
leading to continuous price erosion.
M&A activities undertaken by companies in India
Indian companies have been announcing more M&A transactions or alliances helping the company either to
consolidate, diversify, gain access in niche markets or refocus on core businesses. Acquisition has been one of
the key drivers for growth in the domestic market.
Strides Shasun has entered into an agreement with Moberg Pharma, Sweden and its affiliates to acquire
OTC brands Jointflex (Used as powerful, fast-acting arthritis pain relief), Fergon(Used as essential body
mineral. It works by providing iron to the body) and Vanquish (Used for Relieving headaches, migraine
headaches, toothaches, muscle aches, premenstrual or menstrual aches, or other minor aches and pains)
brands for a total consideration of USD10mn plus inventory value at closing. The transaction adds USD6mn
of Revenues and delivers above company EBITDA margins. This will help Strides Shasun to build an
emerging OTC franchise both in its regulated and emerging markets.
Strides Shasun had acquired in May 2014 from Scolr Pharma, US world-wide rights for 12-hr extended
release Ibuprofen however, post that Nuprin has the global rights for it as well as the associated Controlled
Delivery Technology.
Cipla acquired two US-based companies, InvaGen Pharmaceuticals Inc. and Exelan Pharmaceuticals Inc., for
USD550mn.
Lupin also acquired two US based pharmaceutical firms, Gavis Pharmaceuticals LLC and Novel Laboratories
Inc, in a deal worth at USD880mn.
Several online pharmacy retailers like PharmEasy, Netmeds, Orbimed, are attracting investments from
several investors, due to double digit growth in the USD14.8bn Indian pharmacy market.
Strides Shasun entered into a licensing agreement with US-based Gilead Sciences Inc to manufacture and
distribute the latter's cost-efficient Tenofovir Alafenamide (TAF) product. The licence to manufacture
Gilead's low-cost drug extends to 112 countries.
Cadila launched a biosimilar for Adalimumab - for rheumatoid arthritis and other auto immune disorders.
The drug will be marketed under the brand name Exemptia at one-fifth of the price for the branded
version-Humira.
Torrent Pharmaceuticals entered into an exclusive licensing agreement with Reliance Life Sciences for
marketing three biosimilars in India — Rituximab, Adalimumab and Cetuximab.
Intas Pharmaceuticals is the first global company to launch a biosimilar version of Lucentis, the world’s
largest selling drug for treatment of degenerative eye condition called Razumab.
Quest for international footprint expansion
US continue to be an attractive destination for the domestic player. If we study our universe, US business
contributes 15-45% of the total revenues and they are attempting to strengthen their position in the US. All the
companies entered international markets for their quest for international footprint expansion via acquisition /
collaboration / partnership. However, acquisition outside US e.g. EU, Japan and Latin America (LATAM) have
also been strategy based.
Low leverage is the a key for consolidation
Historically, all the domestic players have acquired companies and assets and then build their franchise in the
regulated markets. Next step for them is to grow in the existing markets by tying up for some specific brands
which they can service from their low leveraged balance sheet. Also growing the franchise in the semi-regulated
markets and emerging markets would need investments which in the beginning would impact the return ratios.
We believe most of the companies have a benchmark of 2-5year payback and thus over a medium term
dividend payouts would return to the original levels.
17Sector Report – Indian Pharmaceutical Industry
Issues ballooning from the regulators
Increase level of import alerts, export ban, warning letters and Form 483 observation letter over the past two
years have surprisingly increased, post setting up a dedicated set up in 2012. And also interest for the response
post inspection is looked into minutely. The process is simple – Entire process of evaluation of a company and
its products and manufacturing process is first thoroughly audited by the team of inspectors who visit the
facility. Here the documents submitted by the companies will have to match with the facts on the ground. Then
the team outlines the observations and post which it gives 15 days for the company to comply with the issues,
if any. If in their next visit the inspectors find the same anomalies, based on the severity of the deviations, they
issue import alerts, export ban or warning letters. It is however, not necessary that all warning letter will turn
into an import alert. Depending on the severity of the deviations the FDA also directs the companies to get a
third-party evaluation of their remediation processes.
From 2008-2015, US FDA has issued around 50 warning letters on Indian companies; out of these, around 40%
were converted into import alerts. However, 50% of the warning letters have been resolved within a period of
12-15months. Regulatory concerns remain the key risk to the sector which can lead to delays in launch, further
mounting pressure on the margins and estimates.
Sun Pharmaceuticals, Dr Reddy’s Laboratories, Cadila Healthcare, IPCA Laboratories, Aurobindo, Wockhardt,
Emcure Pharma, Laxachem were issued with the warning letters / Import alert whose delay in resolution of the
issues will impact the lined up approvals from that facility and impact the estimates.
Table 6: Recalls done by the US FDA, recently
Date Companies Issues
Due to the potential presence of particulate matter identified as
9/3/2016 Teva Pharmaceuticals
glass in one vial
7/3/2016 Specialty Commodities, Inc. Undeclared cashews
1/3/2016 Sagent Pharmaceuticals, Inc. Discovery of an out of specification impurity result detected
The user was unable to separate the implantable Clip from the
delivery system. The delivery system's 'arm positioner' was not
02/26/2016 Abbott returned to the required neutral position by the operator during
the deployment sequence, subsequently preventing the Clip from
detaching.
02/17/2016 Baxter Particulate Matter
02/16/2016 Pharmakon Pharmaceuticals Super-potent
01/26/2016 Baxter Leaking containers and particulate matter
01/16/2016 Abbott's Compounding Pharmacy Lack of Sterility Assurance
Source: US FDA; IDBI Capital Research
Recently, we are observing a sleuth of sweet pills offered by US FDA issuing EIR (Establishment Inspection
Report) for manufacturing facilities for Lupin, Alembic Pharmaceuticals, Suven Life Sciences, Ajanta Pharma,
Aurobindo Pharma, Cadila Healthcare, Dishman Pharmaceuticals and many more. These companies were
experiencing an overhang mainly from the US FDA and living under the fear of either an import alert or a
warning letter. However, an EIR confirms the closure of observations (483’s) cited in its respective inspections.
We believe that the transition phase will lead to higher level of approvals and re-rating given stronger pending
pipelines resulting in core business growth.
Inspite of seeing higher number of inspections, investors sensitivity to the citing has increased. However, now
we are observing Indian companies getting hopeful of positive responses as some companies have started
receiving EIRs for the same. Companies in all are now involved in focusing on its compliance standard and have
made significant changes in its old manufacturing facilities to adhere to all the required SOPs and reduce
manual intervention ect. The only set-back is regarding the expenses linked to the increased GDUFA fees,
inspection and re-inspection fees and remedial actions and audits undertaken by external consultants. Hence
the delay in timeline of the resolution and follow-upon the strong pending pipeline remain the key parameters.
18Sector Report – Indian Pharmaceutical Industry
Dishman Pharmaceuticals and Chemicals (Dishman): Company’ wholly owned subsidiary, namely Carbogen
Amcis AG., Switzerland (CA), has completed US FDA Inspection for its two sites located at Aarau and
Neuland without any adverse observations and received the Establishment Inspection Report (EIR) for the
same. Thus, now the company has the above two sites in addition to Bubendorf in Switzerland, which are
approved by the USFDA. In addition recently, Dishman received an EIR for its Naroda site, India.
Lupin: Lupin received an EIR from USFDA for the inspection at its Goa facility in July 2015.
Alembic Pharma: Alembic Pharmaceuticals received an EIR from USFDA for the inspection at its Karakhadi
API plant III in April 2015.
Cadila Healthcare: Cadila received an EIR from USFDA for its inspection at its Moraiya manufacturing
facility.
Global patent application from India on a decline
According to World Intellectual Property Organization(WIPO), international patent applications in 2015 increase
1.7% YoY, however, there is a gradual decrease in filings in the domestic firms which is stemming out from the
magnitude of stringencies adopted by the regulators. Indian firms and research organizations filed 1,320 patent
applications in 2013, 1,428 in 2014, and 1,423 in 2015. Also, international patent applications from India grew
at a CAGR of 2.2% over 2010-15, which is almost the same with the European countries over the same period.
But India remained a laggard and almost flat in the filing of patent applications over the past two years, in
comparison to the three Asian giants as shown below.
Table 7: Patent application in Asia
2015 2014
India 1,423 1,428
Japan 44,235 42,381
China 29,846 25,548
South Korea 14,626 13,117
Source: World Intellectual Property Organization (WIPO); IDBI Capital Research
US continues to remain at the top position with 57,385 patent applications filed in 2015 (grew 1.7% YoY), while
the geography of innovation continues to shift and to evolve, with Asia, and in particular Japan, China and the
Republic of Korea, forming the predominant geographical cluster. The three Asian IP giants—Japan, China and
South Korea—contributed 43% of growth in 2015.
Radical shift in the domestic business towards Chronic segment
Changes in India’s population and economy have contributed to a shift in the country’s epidemiological profile
towards ‘lifestyle’ diseases that are more prevalent in Western markets. Such changes have increased the
demand for better healthcare and for medications that address chronic diseases. There has been an increased
focus towards shifting from the acute portfolio to the chronic portfolio across the domestic players.
Chart 15: Breakdown of domestic sales of Indian Chart 16: Breakdown of domestic sales of Indian
companies - AUG 2016 companies - AUG 2015
Cadila IPM
Cipla Cipla
IPM Cadila
Glenmark Glenmark
Lupin Lupin
Torrent Pharma Torrent Pharma
0% 20% 40% 60% 80% 100% 0% 20% 40% 60% 80% 100%
Acute Chronic Sub-chronic Acute Chronic Sub-chronic
Source: IDBI Capital Research compilation Source: IDBI Capital Research compilation
19Sector Report – Indian Pharmaceutical Industry
Increasing R&D expenses by all companies
All domestic company’s in our universe, are extensively focusing on investing in R&D in order to tap mainly the
US market. The overall cost for filing has gone up in US as well as other regulated markets. The range of R&D
expenses to sales range from 6%-11% for the companies in our universe.
Specialty Generics the new focus
The generic drug industry is currently operating under severe cost pressure due to intense competition which
has already led to commoditization of generics. In recent years, leading generic companies have increased their
exposure towards R&D to develop complex and differentiated products.
Specialty generics are developed through a new route of administration, strength, dosage form, and
combinations or device innovations to address specific patient needs. Complex generics are expensive and are
expected to improve the industry’s profitability due to higher product differentiation with higher entry
barriers—compared to unbranded, branded, and company-branded generics.
Compulsory Licenses no longer a sweet pill for companies
Compulsory licensing is when a government authorizes a party other than the patent owner to produce the
patented product or process, without the patent owner's consent.
In a year 2012, when Patent office issued India's first Compulsory license (CL) to Natco for cancer drug Nexavar
- sorafenib tosylate, Indian Patent law has gained a lot of importance worldwide. Grant of Natco compulsory
license has brought a new hope in the Pharma industry and in the country where high prices of life saving drugs
are just meant for few wealthy patients and not to the poor and needy.
Indian generic manufacturer Natco proposed selling sorafenib tosylate at Rs.8,800 per patient per month -
approximately USD175 - resulting in a 97% price cut compared to Nexavar. The compulsory license has been
granted until 2020. Natco is not entitled to export the drug or to outsource its production.
However, due to severe criticism from Western pharmaceutical companies, India has given assurance that it
will not grant licenses allowing local firms to override patents and make cheap copies of drugs by big Western
drugmakers.
National List of Essential Medicines (NLEM 2015)
The Government has increased the number of drugs under price control to 800 from earlier 628 drugs in its
NLEM list and now included medicines used for treatment of diseases such as cancer, HIV/AIDS, analgesics,
Hepatitis C and cardiovascular diseases under its purview. Now that the list has got fixed, the NPPA(National
Pharmaceutical Pricing Authority) will now fix the ceiling prices of all the drugs. On March 4, 2016 drug price
regulator NPPA reportedly fixed the price ceiling of 530 essential medicines resulting in the price reduction of
126 drugs by 40%. The companies whose drugs were added to the price fixation list include drug majors such as
Sun Pharmaceutical Industries, Torrent Pharmaceuticals, Abbott Healthcare, Glenmark and Cadila Healthcare to
name a few.
Chart 17: NLEM/non NLEM portfolio – Volumes Chart 18: NLEM/non NLEM portfolio – Price growth
growth (%) (%)
20 8
6
15
4
10 2
0
5 -2 Apr-16 May-16 Jun-16 Jul-16 Aug-16
-4
0
-6
Apr-16 May-16 Jun-16 Jul-16 Aug-16
-5 -8
-10
-10 -12
NLEM non-NLEM NLEM non-NLEM
Source: IDBI Capital Research Compilation Source: IDBI Capital Research Compilation
20Sector Report – Indian Pharmaceutical Industry
Now that the IPM had absorbed the impact from the new drug pricing policy (NPPP) as can be seen from the
charts above that the volumes for Jul-16 and Aug-16 shows incremental improvement, price impact continues.
We are also observing that for the companies in our universe, the proportion of molecules under NLEM is
continuously increasing.
Table 8: Universe increasing exposure to NLEM molecules
% covered under the NLEM NLEM 1995 NLEM 2013 NLEM 2015
IPM 2.9 12.3 19.9
Cadila 3.6 16.8 27.4
Cipla 4.6 17.3 32.4
Glenmark 0.0 1.7 13.6
Lupin 1.6 9.6 23.1
Torrent Pharma 2.2 9.9 14.5
Source: IDBI Capital Research Compilation
FDC, another blow to domestic players
Health Ministry banned 344 fixed drug combination (FDC) drugs on grounds that it posed a risk to humans and
alternative drugs were available. The concern was that companies were taking State level approvals when, in
fact, Central approvals were required. And this practice was leading to irrational and unsafe drugs getting into
the market. Ministry had viewed as many as 6,220 FDC’s of which it was believed that 963 FDC’s are irrational
combinations. However, the ban has come for only 344 FDC’s currently. So 15% of the total universe has been
defined as irrational combination and 36% has been enlisted now. If 100% irrational combinations get swiped
out of the system then the IPA (India Pharmaceuticals Association) claims the loss of Rs100bn which would be
equivalent to 10% of the IPM.
The biggest negative impact was experienced by ban of products was Pfizer and Abbott for its Best Sellers -
Corex and Phensedryl which are codeine-related fixed combinations were part of the government’s banned
drugs list. However, for Corex the High Court stays a ban as they believe that the court observes that the
government action to ban the drug appeared to have been arbitrary and rushed. It also noted that no inquiry or
show-cause notice had been issued to Pfizer before the notification was passed. Corex is the top-selling brands
in India with sales of more than Rs220cr for FY16 and is being sold over 25 years.
According to its detailed study on the impact of the proposed NLEM 2015 and the FDC’s on the Indian
pharmaceutical market, AIOCD AWACS estimates that the impact on the pharma companies would be that their
sales decline due to NLEM would be to a tune of 1.5% while due to FDC would be 2.9%. However, the trade
(distributors and retailers) would see a greater impact on profit.
Chart 19: FDC/non FDC portfolio – Volumes growth Chart 20: FDC/non FDC portfolio – Price growth (%)
(%)
15 8
10 7
5 6
0 5
-5 Apr-16 May-16 Jun-16 Jul-16 Aug-16 4
-10 3
-15 2
-20 1
-25 0
-30 Apr-16 May-16 Jun-16 Jul-16 Aug-16
FDC non-FDC FDC non-FDC
Source: IDBI Capital Research Compilation Source: IDBI Capital Research Compilation
21You can also read


