Independent Market Research on the Paint and Coating Industry in Selected Southeast Asian Countries - OKCHEM
←
→
Page content transcription
If your browser does not render page correctly, please read the page content below
Independent Market Research on the Paint and
 Coating Industry in Selected Southeast Asian
                  Countries
                   Final Report

                    May 2017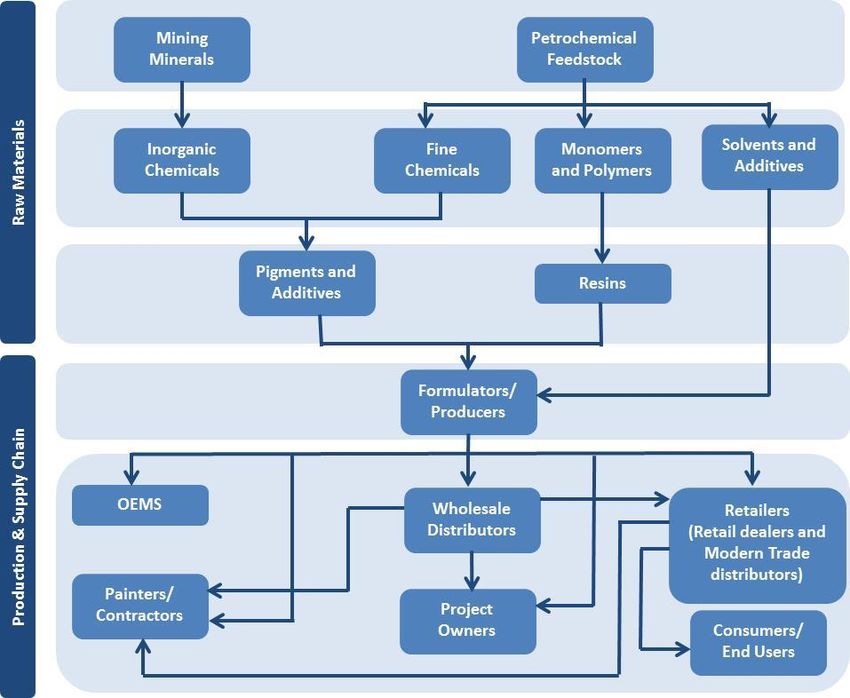
© May 2017 Frost & Sullivan

The market research process for this study has been undertaken through secondary/desktop research as well as
primary research, which involves discussing the status of the industry with leading participants and experts. The
research methodology used is the Expert Opinion Consensus Methodology.

Quantitative market information is subject to fluctuations due to possible changes in the business and industry
climate. Frost & Sullivan‟s estimates and assumptions are based on varying levels of quantitative and
qualitative analyses, including industry journals, company reports and information in the public domain.

Forecasts, estimates, predictions, and other forward-looking statements contained in this report are inherently
uncertain because of changes in factors underlying their assumptions, or events or combinations of events that
cannot be reasonably foreseen. Actual results and future events could differ materially from such forecasts,
estimates, predictions, or such statements.

This study has been prepared for inclusion in the English language offering circular and Thai language
prospectus (collectively, the „‟Offering Documents”) of TOA Paint (Thailand) Public Company Limited (“the
Company”) in relation to an initial public offering in connection with its listing on the stock exchange of
Thaiiland (“the Listing”).

Save for the inclusion of this study in the Offering Documents issued by the Company and in such presentation
materials prepared by or on behalf of the Company (reviewed by Frost & Sullivan) in relation to the Listing, no
part of it, except in connection with any due diligence or similar defense which the company or the underwriters
partcipating in the listing may wish to advance, may be otherwise given, lent, resold, or disclosed to non-
customers without our written permission.

Frost & Sullivan has prepared this study in an independent and objective manner, and it has taken adequate care
to ensure its accuracy and completeness. We believe that this study presents a true and fair view of the paint and
coating industry in select countries in Southeast Asia within the limitations of, among others, secondary
statistics and primary research, and it does not purport to be exhaustive. Our research has been conducted with
an “overall industry” perspective, and it may not necessarily reflect the performance of individual companies in
the industry. Frost & Sullivan shall not be liable for any loss suffered because of reliance on the information
contained in this study, except as provided in our separate engagement letter with the company dated 2nd
February, 2017. This study should also not be considered as a recommendation to buy or not to buy the shares
of any company or companies as mentioned in it or otherwise.

Authorized Signatory

Sanjay Singh
Vice President
Frost & Sullivan (S) Pte Ltd
100 Beach Road #29-01/11 Shaw Tower
Singapore 189702

                                                                                                                2
Table of Contents
1. EXECUTIVE SUMMARY .......................................................................................................................... 4
1.1.1. BRIEF MACROECONOMIC OVERVIEW OF SOUTHEAST ASIA (SEA) ...........................................................................4
1.1.2. INDUSTRY SEGMENTATION AND DEFINITIONS .....................................................................................................5
1.1.3. VALUE CHAIN AND DISTRIBUTION CHAIN ANALYSIS .............................................................................................6
1.1.4. MARKET SIZING AND FORECASTS .....................................................................................................................8
1.1.5. COMPETITIVE LANDSCAPE.............................................................................................................................12
1.1.6. INDUSTRY OUTLOOK ....................................................................................................................................17
2. THE PAINT AND COATING INDUSTRY IN THAILAND .................................................................... 19
2.1.1. BRIEF ECONOMIC OVERVIEW OF THAILAND......................................................................................................19
2.1.2. MACRO-ECONOMIC OVERVIEW OF THAILAND ..................................................................................................20
2.1.3. SOCIO-ECONOMIC OVERVIEW OF THAILAND ....................................................................................................24
2.1.4. OVERVIEW OF THE PAINT AND COATING INDUSTRY IN THAILAND ..........................................................................29
2.1.5. VALUE CHAIN AND DISTRIBUTION CHAIN ANALYSIS ...........................................................................................32
2.1.6. DRIVERS OF THE PAINT AND COATING INDUSTRY ...............................................................................................34
2.1.7. BARRIERS TO ENTRY ....................................................................................................................................41
2.1.8. KEY REGULATIONS GOVERNING THE INDUSTRY .................................................................................................42
2.1.9. MARKET SIZING AND FORECASTS ...................................................................................................................44
2.1.10. COMPETITIVE LANDSCAPE ANALYSIS ...............................................................................................................47
2.1.11. MARKET SHARE ESTIMATES AND PROFILES OF RETAIL DECORATIVE AND RETAIL NON-DECORATIVE PAINT AND COATING
COMPANIES IN THAILAND ............................................................................................................................................... 48
2.1.12. INDUSTRY PROSPECTS & OUTLOOK ................................................................................................................52
3. THE PAINT AND COATING INDUSTRY IN VIETNAM ...................................................................... 53
3.1.1. OVERVIEW OF THE PAINT AND COATING INDUSTRY IN VIETNAM ...........................................................................53
3.1.2. VALUE CHAIN AND DISTRIBUTION CHAIN ANALYSIS ...........................................................................................56
3.1.3. MARKET SIZING AND FORECASTS ...................................................................................................................57
3.1.4. COMPETITIVE LANDSCAPE ANALYSIS ...............................................................................................................59
3.1.5. MARKET SHARE ESTIMATES AND PROFILES OF RETAIL DECORATIVE AND NON-DECORATIVE PAINT AND COATING
COMPANIES IN VIETNAM ................................................................................................................................................ 59
3.1.6. INDUSTRY PROSPECTS & OUTLOOK ................................................................................................................63
4. BRIEF OVERVIEW OF THE PAINT AND COATING INDUSTRY IN CAMBODIA, LAOS,
MYANMAR, MALAYSIA, AND INDONESIA ................................................................................................ 64
4.1.1. OVERVIEW OF THE PAINT AND COATING INDUSTRY ............................................................................................64
4.1.1.1. VALUE CHAIN AND DISTRIBUTION CHAIN ANALYSIS ...........................................................................................68
4.1.2. MARKET SIZING AND FORECASTS ...................................................................................................................69
4.1.3. COMPETITIVE LANDSCAPE.............................................................................................................................73
4.1.4. INDUSTRY PROSPECTS & OUTLOOK ................................................................................................................76
5. BRIEF OVERVIEW OF THE SOUTHEAST ASIA NON-DECORATIVE PAINT AND COATING
INDUSTRY ........................................................................................................................................................ 77
6. OVERVIEW OF PROSPECTS FOR THE COMPANY IN THE INDUSTRY........................................ 79
31. EXECUTIVE SUMMARY
1.1.1. Brief Macroeconomic Overview of Southeast Asia 1(SEA)
The selected Southeast Asian countries, combined, accounted for approximately 76.0% of ASEAN‟s total GDP in
2016E. Most of the selected Southeast Asian economies had been on a growth track during the last two decades
(1990-2010) on the backdrop of factors such as economic liberalization, urbanization, increasing domestic
consumption and government spending, among many others. During the same period, both Thailand and Vietnam
catapulted themselves from low-income countries to upper-middle income and middle-income countries,
respectively, while at the same time transforming into industrial and services-based economies from economies that
were once largely dependent on agriculture. The industrial and services sectors combined contributed to more than
60.0% of Thailand‟s GDP between 2011 and 2016. During this period, the country was affected by various factors
such as floods, political unrests and decline in global commodity prices, among many others. But the economy
remained resilient owing to increased government spending, rising private consumption and a steady source of
revenue from tourism. Thailand‟s economic growth in the forecast period will largely depend on steady growth in
private consumption, implementation of the government‟s long term strategic plan, stable inflation rates and the
possibility of return to democratic rule.
Vietnam‟s growth, on the other hand, was driven by a holistic socioeconomic development. This resulted in
improved living standards including availability of electricity, clean water and sanitation, and access to basic
education and healthcare. Trade and investments with regional and global economies also fueled growth. Many
social and economic indicators in Vietnam such as maternal mortality rates, access to basic education and
infrastructure, availability of electricity, access to clean water, and sanitation have shown substantial improvements
in the past three decades from 1986 to 2016. Over this period, Vietnam has achieved many of its Millennium
Development Goals ahead of time. Economic integration with regional and global participants has also boosted trade
and investment in the country. With the current Socio-Economic-Development Strategy 2011-2020 being
implemented through development of infrastructure, establishment and improvisation of market institutions and
nurturing of proper human resource required for modern industries, the economy of Vietnam can be expected to
reach new heights during the forecast period of 2016 to 2021.
Economic growth in the other Southeast Asian countries is expected to be driven by urbanization (Indonesia,
Malaysia, Laos), government spending on infrastructure (Myanmar, Indonesia, Malaysia), foreign trade and
investments (Myanmar, Cambodia), to name a few. The Indonesian president is currently pursuing an ambitious
five-year billion-dollar plan to upgrade roads, ports, water and power plants. Indonesia is the second largest car
manufacturer in Asia after Thailand with the production of passenger vehicles forecast to reach approximately 2.6
million by 2020, and this is expected to provide an impetus to the economic growth in the country. Similarly, the
Malaysian government also plans to develop the country‟s infrastructure under the 11th Malaysia Plan 2016–2020
which in turn is likely to improve the overall economic activity. Myanmar is also set to grow economically
following the 12-point policy declaration by the government, targeted at broad social and economic reforms in the
country. While Cambodia‟s signing up of the Sustainable Development Investment Partnership (SDIP)2 is expected
to unlock the funding of infrastructure projects through PPPs, Laos‟ economic growth is likely to be determined by
increased disposable incomes in the country.
1
For the purpose of this report, Southeast Asia refers to the following countries – Thailand, Vietnam, Malaysia, Cambodia, Indonesia, Laos and
Myanmar.
2
http://www.phnompenhpost.com/business/cambodia-joins-global-infrastructure-fund-davos
41.1.2. Industry Segmentation and Definitions
The study focuses on the retail market for decorative paints and coatings in Thailand, Vietnam, Malaysia, Indonesia,
Myanmar, Cambodia and Laos; and on the retail market for non-decorative paints and coatings in Thailand and
Vietnam.
Industry Segmentation, Paint and Coating industry, Select Southeast Asian countries, 2016
Retail Paints and
Coatings
Decorative Non-Decorative
Protective Coatings Others
Wood Coatings Waterproofing
(Metal and Concrete) (Automotive Coatings,
Construction
Chemicals and other
paints and coatings)
Source: Frost & Sullivan
Note: Paints and coatings classified under ‘Others’: Not included as a part of this study.
The definitions of each category and further sub-categories are described below.
Retail Paints and Coatings: This refers to paints and coatings sold through retail dealers which include traditional
retail dealers and modern trade distributors.
Decorative Paints and Coatings: Otherwise known as architectural coatings, this segment includes all those
coatings applied on new and existing buildings, be it residential or commercial or industrial or any other type of
building, for decorative purposes.
Non-Decorative Paints and Coatings: For the purpose of this study, non-decorative paints and coatings comprise
three segments - non-decorative wood coatings, non-decorative waterproofing and non-decorative protective
coatings. The categories and their uses are described below.
Non-Decorative Wood Coatings: Used for on-site paint jobs of woodwork in small to medium scale projects
(mainly housing). Some examples of application areas are doors, window frames, trims, wooden floors, cabinets,
etc. This category doesn‟t include off-site furniture paints and coatings.
Non-Decorative Waterproofing: Waterproofing chemicals/membranes that are used for preventing water seepage.
These are typically of 4 types –
Cementitious - cement based
Liquid applied acrylic, Polyurethane - resin based
Liquid applied bituminous - bitumen based
Sheet membrane
5Non-Decorative Protective Coatings (Metal and Concrete): Also known as heavy duty or high-performance
coatings, these coatings are applied on steel structures (construction and small to medium scale industries), steel
bridges, piping, and other structures where anti-corrosive coatings or other coatings with high resistance to wear-
and-tear are required. Protective coatings have a much thicker film than decorative coatings, typically 3-4mm.
Examples: heat resistant coatings for pipes and flares, heavy-duty floor paint for factories, warehouses, or airport
hangars, and high-performance coatings for oil rigs and related equipment. These types of coatings are also used for
protecting window frames from exposure to oxidization and concrete structures from bacterial, fungal and other
kinds of organic infestations.
1.1.3. Value Chain and Distribution Chain Analysis
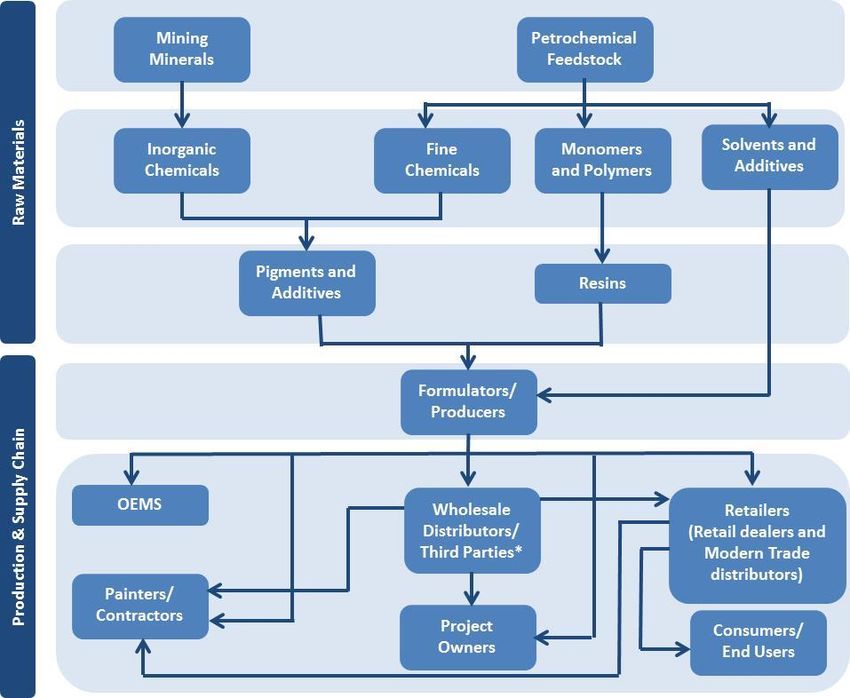
Paint and coating manufacturers in the selected Southeast Asian countries generally rely on large international
chemical manufacturers such as Dow and BASF for the majority of their raw material requirements. Paint and
coating manufacturers in countries like Thailand, Indonesia and Malaysia, which have presence of domestic
companies that produce petrochemical biproducts required for paint and coating manufacturing, also source some of
their raw materials locally. However, countries such as Vietnam, Cambodia, Laos and Myanmar largely rely on
imports from the neighbouring countries.
The sales channels in different countries depend on the available infrastructure and maturity of the local market. In
countries such as Thailand, Indonesia and Malaysia paint and coating manufacturers sell directly to modern trade
distributors as well as to traditional retail dealers, whereas in countries such as Vietnam, Indonesia, Cambodia,
Myanmar and Laos, the paint and coating manufacturers sell directly to traditional retail dealers or wholesale
distributors who in turn sell to the retail dealers. Most of these sales constitute decorative paints and coatings. Apart
from selling to retail dealers, wholesale distributors and modern trade distributors, paint and coating manufacturers
also sell their products directly to project owners and contractors.
Housing project owners and infrastructure contractors in Thailand, Malaysia and Indonesia procure decorative paints
and coatings directly from the manufacturers, while inVietnam, Myanmar, Cambodia and Laos wholesale
distributors act as third parties between paint and coating manufacturers and project owners.
Non-decorative paints and coatings are sold mostly through non-retail channels in all of the Southeast Asian
countries. Majority of non-retail customers include project owners, contractors, OEMs and large scale industries.
The retail customers for non-decorative paints and coatings in these countries include real-estate developers, small
and medium scale enterprises, small-time painters, architects and individuals.
Presence of large networks of retail dealers in Thailand, Malaysia and Indonesia ensure relatively higher sales of
non-decorative paints and coatings through retail channels whereas lack of established sales networks in the other
countries results in bulk purchases being done directly through manufacturers and third parties. Lack of DIY
activities, which is a result of availability of cheap labour, is also one of the major factors restraining retail sales of
non-decorative paints and coatings.
6Value Chain, Paint and Coating industry, Select Southeast Asian countries, 2016
**
Source: Frost & Sullivan
Note: * Wholesale distributors/Third parties are applicable for Vietnam, Indonesia, Cambodia, Myanmar and Laos.
**Sales of Non-Decorative Protective Coatings through Retailers are comparatively less in Vietnam as compared to the other countries in
the study.
71.1.4. Market Sizing and Forecasts
The retail market for decorative paints and coatings in the key countries in Southeast Asia experienced a steady
growth historically. The retail decorative paint and coating market in Thailand registered a CAGR of 6.9% between
2011 and 2016, growing from THB13.7 billion in 2011 to THB19.2 billion in 2016, while the market in Vietnam
recorded a CAGR of 9.0% between 2011 and 2016, growing from VND4,224.8 billion in 2011 to VND6,500.0
billion in 2016. Similarly, the markets in the other countries of Southeast Asia such as Malaysia, Indonesia,
Myanmar, Cambodia and Laos registered a combined CAGR of 6.4% between 2011 and 2016, growing from
USD898.1 million in 2011 to USD1,224.0 million in 2016.
Growth in these markets were driven by urbanization, increase in disposable incomes, new house constructions and
repainting activities. Increased consumer preferences towards high priced paints and coatings in countries such as
Thailand and Vietnam were also responsible for the historical growth rates. Government housing schemes and
affordable-house building programs in Thailand, Indonesia and Malaysia also provided impetus to the market during
times of economic slowdown and natural disasters. Other factors such as emergence of services-sectors in Myanmar
and increased tourism activities in other Southeast Asian countries such as Thailand, Cambodia and Laos helped the
retail market for decorative paints and coatings grow.
In 2016, the retail market for decorative paints and coatings in Thailand was dominated by TOA Paint (Thailand)
Public Company Limited which also had a market share of approximately 14.0% in the retail market for decorative
paints and coatings in the select SEA countries. Whereas, in 2016, 4 Oranges Co., Ltd, a Vietnam based company
was the market leader for retail decorative paints and coatings in Vietnam. Some of the major paint and coating
manufacturers in Cambodia, Laos, Myanmar, Malaysia and Indonesia in 2016, were the respective regional
subsidiaries of multinational companies such as Nippon Paint Holdings Co., Ltd., Akzo Nobel N.V., TOA Paint
(Thailand) Public Company Limited, United Paints Group Co., Ltd. and the Jotun Group.
Frost & Sullivan expects the retail market for decorative paints and coatings in Thailand to register a CAGR of
approximately 5.1% between 2016 and 2021, growing from THB19.2 billion in 2016 to THB24.6 billion in 2021. Its
counterpart in Vietnam is expected to register a CAGR of 9.9%, growing from VND6,500.0 billion in 2016 to
VND10,421.0 billion in 2021. Whereas, the markets in Malaysia, Indonesia, Myanmar, Cambodia and Laos
combined are expected to register a CAGR of 7.7%, growing from USD1,224.0 million in 2016 to USD1772.4
million in 2021. Urbanization, construction of new houses and repainting activities are likely to be the major factors
driving growth of the market in this region. Growth in Thailand is also likely to be driven by various other factors
such as increased retail spending, shortened repainting cycles, preference towards premium paint and coating
products, among many others. The market in Vietnam is likely to benefit from the ongoing construction projects in
urban areas of the country. Government housing initiatives and demand for better quality housing is also expected to
provide impetus to the growth in this market. The retail market for decorative paints and coatings in Malaysia is also
likely to reap the benefits of the government‟s development expenditure plans, while growth in Indonesia is
expected to be mainly driven by its‟ relatively higher population and urbanization trends. On the other hand, the
markets in Myanmar, Cambodia and Laos are likely to rely on improvements in overall economy. Paint and coating
manufacturers are also expected to boost the growth in these markets by introducing new products and expanding
their sales networks.
8Retail Market Size of the Decorative Paints and Coatings in Thailand, THB, 2011-2021F
30.0
Decorative paint and coating
market size (THB billions)
25.0
20.0
15.0
23.3 24.6
10.0 20.1 21.0 22.1
17.8 18.7 19.2
15.6 16.7
13.7
5.0
0.0
2011 2012 2013 2014 2015 2016 2017F 2018F 2019F 2020F 2021F
Source: Primary interviews with industry participants, desktop research and forecast by Frost & Sullivan
Note: All figures are rounded. Base year is 2016.
Retail Market Size of Decorative Paints and Coatings in Vietnam, VND, 2011-2021F
12,000.0
Decorative paint and coating
market size (VND billions)
10,000.0
8,000.0
6,000.0
10,421.0
9,228.8
4,000.0 7,628.8 8,252.9
6,500.0 7,115.8
5,421.1 5,925.3
2,000.0 4,224.8 4,571.2 4,964.4
0.0
2011 2012 2013 2014 2015 2016 2017F 2018F 2019F 2020F 2021F
Source: Primary interviews with industry participants, desktop research and forecast by Frost & Sullivan
Note: All figures are rounded. Base year is 2016
9Retail Market Size of Decorative Paints and Coatings in Indonesia, Malaysia, Myanmar, Cambodia and Laos,
USD, 2011-2021F
Total Decorative Paint and Coating Market ( USD
2,000
1,800
1,600
1,400
1,200
millions)
1,000
800
600
400
200
0
2011 2012 2013 2014 2015 2016 2017F 2018F 2019F 2020F 2021F
Laos 15.6 15.9 16.2 16.5 16.9 17.2 17.8 18.4 19.1 19.7 20.4
Cambodia 24.7 25.6 26.7 27.7 28.8 30.0 31.6 33.3 35.1 37.0 39.0
Myanmar 24.8 26.6 28.5 30.5 32.7 35.0 37.2 39.5 41.9 44.5 47.3
Malaysia 279.0 293.0 307.7 323.3 339.5 356.5 374.7 394.2 415.0 436.6 459.3
Indonesia 554.0 594.0 626.3 670.1 723.7 785.3 853.6 929.5 1016.0 1107.1 1206.3
Indonesia Malaysia Myanmar Cambodia Laos
Source: Primary interviews with industry participants, desktop research and forecast by Frost & Sullivan
Note: All figures are rounded. Base year is 2016
The retail market for non-decorative paints and coatings (for wood coatings, waterproofing and protective coatings
combined) in Thailand registered a CAGR of approximately 5.9% between 2011 and 2016, growing from
THB4,780.0 million in 2011 to THB6,376.9 million in 2016. Similarly, the market in Vietnam also followed a
steady growth trajectory, registering a CAGR of 5.7% between 2011 and 2016, growing from VND1,367.3 billion in
2011 to VND1,800.7 billion in 2016. Frost & Sullivan expects increased growth in both these markets in the forecast
period, between 2016 and 2021. The retail market for non-decorative paints and coatings in Thailand is expected to
register a CAGR of 6.8% between 2016 and 2021, increasing from THB6,376.9 million in 2016 to THB8,852.7
million in 2021, whereas the market in Vietnam is expected to register a CAGR of 7.3%, growing from VND1,800.7
billion in 2016 to VND2,558.2 billion in 2021.
Growth in Thailand is expected to be driven by increased FDI inflow, growth in the number of medium and small
scale industries, government spending on transport related infrastructures, increased consumer awareness about
protective coatings as well as house repainting and renovating activities. Other factors such as increased renovation
and repainting of wooden furniture as a result of declined domestic furniture consumption, shorter renovation cycles,
use of cement fiber, growth in tourism and demand for high-end, luxury condominiums are also expected to
contribute towards increase in market size. The retail market for non-decorative paints and coatings in Vietnam is
likely to benefit from an increase in housing construction activities, increased public investments towards
infrastructure projects related to transport and increased wood furniture manufacturing activities supported by its
domestic consumption. Since the retail market in Vietnam for non-decorative paints and coatings is not as
widespread as compared to Thailand, efforts by various paint and coating manufacturers are also expected to provide
stimulus to the growth in the forecast period.
10Retail Market Size of Non-Decorative Paints and Coatings in Thailand, THB, 2011-2021F
10,000.0
Non-Decorative paint and
coating market size (THB
8,000.0 2,249.8
2,037.0
1,854.8
1,707.6
millions)
6,000.0 1,586.5 1,358.6
1,386.4 1,475.1 1,253.3
1,185.4 1,292.1 1,165.1
1,075.7 1,049.3 1,102.1
4,000.0 987.8 929.2 971.0 1,000.1
820.8 878.2
781.7
4,522.6 4,857.8 5,244.3
2,000.0 3,522.6 3,670.6 3,799.1 3,901.6 4,056.2 4,268.0
3,010.6 3,332.7
0.0
2011 2012 2013 2014 2015 2016 2017F 2018F 2019F 2020F 2021F
Wood Coatings Waterproofing Protective Coatings
Source: Primary interviews with industry participants, desktop research and forecast by Frost & Sullivan
Note: All figures are rounded. Base year is 2016.
Retail Market Size of Non- Decorative Paints and Coatings in Vietnam, VND, 2011-2021F
2,500.0 184.4
Non-Decorative paint and coating
164.9
market size (VND billions)
148.9
2,000.0 138.7
130.4 1,123.7
123.0 1,025.8
118.2
1,500.0 115.2 943.7
112.9 885.5
110.2 111.5 836.5
782.9
683.8 731.7
1,000.0 601.5 640.6
565.9
1,157.8 1,250.1
500.0 958.6 1,012.2 1,075.4
760.4 799.4 844.9 894.8
691.3 724.1
0.0
2011 2012 2013 2014 2015 2016 2017F 2018F 2019F 2020F 2021F
Wood Coatings Waterproofing Protective Coatings
Source: Primary interviews with industry participants, desktop research and forecast by Frost & Sullivan
Note: All figures are rounded. Base year is 2016
111.1.5. Competitive Landscape
Decorative and Non-Decorative Paint and Coating Retail Market Landscape in Thailand and Vietnam, 2016
Parent Domestic Estimated
Country Headquarters Segments present
Company Subsidiaries Retail Market
Share, 2016
Decorative:
48.7%
Decorative Paints Wood
TOA Paint
Wood Coatings Coatings:
(Thailand) TOA Paint
Metal Coatings 28.2%
Public Thailand (Thailand) Public
Protective Coatings Waterproofing:
Company Company Limited
Waterproofing 20.0%
Limited
Protective
Coatings:
28.0%
Decorative:
Decorative Paints 13.8%
Metal Coatings Wood
Akzo Nobel Akzo Nobel Paints Protective Coatings Coatings: NA
Netherlands
N.V., (Thailand) Limited Automotive Paints Waterproofing:
NA
Protective
Coatings: NA
Decorative:
13.3%
Thailand Decorative Paints Wood
Wood Coatings Coatings:
Beger Co.,
Thailand Beger Co., Ltd. Metal Coatings 32.8%
Ltd.
Protective Coatings Waterproofing:
NA
Protective
Coatings: NA
Decorative:
Decorative Paints 8.1%
Wood Coatings Wood
Metal Coatings Coatings: NA
Jotun Thailand
Jotun Norway Protective Coatings Waterproofing:
Limited
Automotive Paints NA
Protective
Coatings:
30.0%
12Decorative:
5.2%
Decorative Paints
Wood
Nippon Paint Metal Coatings
Nippon Paints Coatings: NA
Holdings Co., Japan Protective Coatings
Thailand Co., Ltd Waterproofing:
Ltd. Automotive Paints
NA
Protective
Coatings: NA
Decorative: NA
Decorative Paints Wood
Metal Coatings Coatings: NA
Sika AG Switzerland Sika (Thailand) Ltd. Protective Coatings Waterproofing:
Waterproofing 28.0%
Protective
Coatings: NA
Decorative: NA
Wood
Metal Coatings
ParexGroup Coatings: NA
ParexGroup Protective Coatings
(Thailand) Thailand Waterproofing:
(Thailand) Co., Ltd. Waterproofing
Co., Ltd. 10.0%
Protective
Coatings: NA
Decorative:
23.0%
Wood
4 Oranges Decorative Paints Coatings: NA
Vietnam 4 Oranges Co., Ltd
Co., Ltd Waterproofing:
NA
Protective
Coatings: NA
Vietnam
Decorative:
18.0%
Wood
Decorative Paints
Coatings:
International Paint Metal Coatings
Akzo Nobel 10.0%
Netherlands Singapore Pte Ltd Protective Coatings
N.V., Waterproofing:
(Vietnam branch) Wood Coatings
10.0%
Waterproofing
Protective
Coatings:
40.0%
13Decorative:
Decorative Paints 9.8%
TOA Paint
Wood Coatings Wood
(Thailand)
TOA Paint Metal Coatings Coatings: 8.0%
Public Thailand
(Vietnam) Co,.Ltd. Protective Coatings Waterproofing:
Company
Waterproofing 6.0%
Limited
Protective
Coatings: NA
Decorative:
Decorative Paints 9.0%
Wood Coatings Wood
Nippon Paint
Nippon Paint Metal Coatings Coatings: NA
Holdings Co., Japan
(Vietnam) Co. Ltd Protective Coatings Waterproofing:
Ltd.
Waterproofing NA
Protective
Coatings: NA
Decorative:
8.0%
Decorative Paints Wood
Metal Coatings Coatings: NA
Jotun Paints
Jotun Norway Protective Coatings Waterproofing:
(Vietnam) Co. Ltd.
Waterproofing 10.0%
Protective
Coatings:
50.0%
Decorative: NA
Wood
Coatings:
Oseven 45.0%
Vietnam Oseven Corporation Wood Coatings
Corporation Waterproofing:
NA
Protective
Coatings: NA
Decorative: NA
Wood
Coatings:
Adora Paints Adora Paints 15.0%
Malaysia Wood Coatings
(M) Sdn Bhd (Vietnam) Co., Ltd Waterproofing:
NA
Protective
Coatings: NA
14Decorative: NA
Wood
Coatings: NA
Kova Group
Vietnam Kova Group Ltd Waterproofing Waterproofing:
Ltd
49.0%
Protective
Coatings: NA
Decorative: NA
Wood
Hai Phong Decorative Paints
Hai Phong Paint Coatings: NA
Paint Joint Metal Coatings
Vietnam Joint Stock Waterproofing:
Stock Protective Coatings
Company NA
Company
Protective
Coatings: 5.0%
Source: Frost & Sullivan, primary interviews, desktop research and analysis
Decorative Paint and Coating Retail Market Landscape in Malaysia, Indonesia, Cambodia, Laos and
Myanmar, 2016
Parent
Country Headquarters Domestic Subsidiaries Segments present
Company
Nippon Paint (Malaysia)
Decorative Paints
Sdn. Bhd.
Wood Coatings
Nippon Paint Metal Coatings
Nippon Paint (Sabah) Sdn.
Malaysia Holdings Co., Japan Protective Coatings
Bhd.
Ltd. Automotive Paints
Waterproofing
Paint Marketing Company
(Malaysia) Sdn. Bhd.
15Decorative paints
Akzo Nobel Paints
Automotive paints Metal
(Malaysia) Sdn. Bhd.
Akzo Nobel coatings Marine coatings
Netherlands
N.V., Protective coatings
DGL International
Waterproofing
(Malaysia) Sdn Bhd
Wood Coatings
Jotun (Malaysia) Sdn.
Decorative Paints Marine
Bhd.
Coatings Protective Paints
Jotun Norway Metal Coatings
Jotun Paints Sdn. Bhd.,
Powder Coatings
Nilai - (sales and
Wood Coatings
production)
Decorative Paints
PT Nipsea Paint and Wood Coatings
Nippon Paint Chemicals Metal Coatings
Holdings Co., Japan Protective Coatings
Ltd. Nippon Paint PT. NP Auto Automotive Paints
Refinishes Waterproofing
Decorative paints
Indonesia Wood coatings
PT. Avia Avian Indonesia ---
Metal coatings
Automotive paints
Decorative paints
Automotive paints Metal
Akzo Nobel coatings Marine coatings
Netherlands PT ICI Paints Indonesia
N.V., Protective coatings
Waterproofing
Wood Coatings
Decorative paints
Architecture paints
United Paints
Myanmar --- Wood coatings
Group Co., Ltd.
Marine paints Industrial
paints Protective coatings
Decorative paints
Automotive paints
Akzo Nobel Akzo Nobel Co.,Ltd.
Myanmar Netherlands Protective coatings
N.V., (Yangon)
Waterproofing
Wood Coatings
Decorative
TOA Paint Wood paint
TOA Paint (Myanmar) Co.
(Thailand) Co., Thailand Protective Coatings
Ltd
Ltd Waterproofing
Decorative paints
Architecture paints
United Paints
Cambodia Myanmar --- Wood coatings
Group Co., Ltd.
Industrial paints Protective
coatings
16Decorative Paints
Protective Paints
Jotun (Cambodia) Ltd.,
Jotun Norway Metal Coatings
Phnom Penh (Sales)
Powder Coatings
Wood Coatings
Decorative paints Metal
coatings
Akzo Nobel Marine coatings
Netherlands ---
N.V., Protective coatings
Waterproofing
Wood Coatings
Decorative paints
Architecture paints
United Paints Wood coatings
Myanmar ---
Group Co., Ltd. Marine paints
Industrial paints Protective
coatings
Decorative Paints
Marine Coatings
Protective Paints
Laos Jotun Norway ---
Metal Coatings
Powder Coatings
Wood Coatings
Decorative paints
Wood coatings
Beger Co., Ltd. Thailand --- Construction Chemicals
Heavy Duty Coating
Special Paints
Source: Frost & Sullivan, primary interviews, desktop research and analysis
1.1.6. Industry Outlook
The growth of paint and coating industries in select Southeast Asian countries are subject to a variety of factors such
as urbanization, new constructions, repainting, purchasing power, retail spending, government initiative towards
housing, government expenditure towards infrastructure, tourism, change in consumer preferences and many others.
Government incentives in the housing market bode well for both the decorative and non-decorative paint and
coating markets. In relatively developed countries such as Thailand, Malaysia and Indonesia repainting activities are
expected to be the major growth drivers for the paint and coating industry. Long term government plans which
would focus expenditures on housing, infrastructure and industries are also likely to spur the growth. Apart from
that, a gradual shift in consumer preferences towards better quality paint and coating products, which is a result of
both introduction of premium products into the market by multinational paint companies and digitization of buying
processes, presents better growth prospects for the industry. In Thailand, the retail paint and coating industry which
is a significant channel of sales for the manufacturers is likely to see increased off-take as consumers become more
aware of the choices offered to them. This segment is also expected to see moderate to high-growth in the forecast
period, driven by an increased demand for new housing and repainting, government incentives and rising retail
spending to name a few. Large manufacturers with expansive retail dealer reach are likely to be better equipped to
capture changing consumer preferences and translate them into product features thereby enabling them to stay
current in changing times. This in-turn is expected to give them an edge over other manufacturers who may not have
the ability to innovate and adapt. On the other hand, the non-decorative retail segment, in particular, is likely to be
benefitted by a continued increase in tourism resulting in new demand and constant interior-upkeeps by the
hospitality sector in the country.
17Growth in the retail paints and coatings in Vietnam post 2017 is likely to be driven by large housing construction
projects in urban areas of the country. Increase in the number of foreign developers in this sector and rising income
levels of the population are gradually increasing demand for better quality housing. This in turn is expected to boost
the sales of decorative paints and coatings and shift consumer preferences towards premium category products.
Growing awareness among customers about the origins of products, safety of ingredients, and their environmental
friendliness is also likely to influence the paint and coating industry in Vietnam. Companies that are able to cater to
the evolving tastes and preferences of retail and B2B consumers are likely to reap significant benefits in the forecast
period.
The outlook for the decorative paint and coating market in Malaysia is expected to remain fairly positive, driven by
the change in consumer demands with high standard of living and rapid development of commercial and residential
buildings supported by the significant increases in development expenditure (approximately 16.2% increase from
previous plan) in the 11th Malaysia Plan (2016-2020). Growth in the Indonesian decorative paint and coating market
is expected to continue on its upward trajectory owing to the rapid infrastructure developments, increased FDI and
increased tourism, coupled with establishment of economic development zones. With the opening up of Myanmar,
Laos and Cambodia‟s economies in recent years and the expected construction boom that is likely to be a result of
this liberalization, the near-term (2016-2018) outlook for the paint and coating markets in these countries is
expected to be positive.
In conclusion, a combination of aforementioned factors is expected to drive the growth in the retail market for paints
and coatings in selected countries in SEA in the forecast period 2016-2021.
The rest of the page is intentionally left blank
182. THE PAINT AND COATING INDUSTRY IN THAILAND
2.1.1. Brief Economic Overview of Thailand
Thailand is the second largest economy in ASEAN in terms of GDP, accounting for approximately 16.2% of
ASEAN‟s3 total GDP in 20154. Thailand is widely cited as a model of economic and social developmental success,
transforming into an upper middle-income5 economy in 2011. Thailand‟s Gross Domestic Product (Nominal GDP)
grew at a CAGR of approximately 14.8% between 1986 and 1996 on the back of political stability, economic
liberalization, and strong domestic consumption. In the years following the Asian financial crisis of 1997-1998,
nominal GDP moderated to an average of approximately 8.0%, between 1999 and 2005. Despite a series of
economic shocks post-2006 including periods of political instability and devastating floods, strong macroeconomic
fundamentals have enabled Thailand‟s economy to remain resilient. Thailand‟s nominal GDP grew at a CAGR of
approximately 5.9% during the period 2005 to 2015. Accounting for inflation (highest of 5.4% in 2008), real GDP
CAGR was approximately 3.3% during the same period. Over this period, a large number of jobs were created in the
country drastically reducing poverty levels from approximately 67.0% in 1986 to just 10.9% in 2016.
Rapid economic progress has fueled Thailand‟s transition from an agrarian to an industrial (including
manufacturing) and services-based economy. The industrial sector dominated the economy between 2011 and 2016
contributing to approximately 38.0% to 40.0% of GDP, followed by the services sector which contributed
approximately 25.0% to 27.0%. Traditional sectors such as agriculture played a smaller role in the economy,
contributing approximately 8.0% to 10.0% of the GDP. The focus on manufacturing led by automotive, electronics,
and consumer goods segments present significant growth prospects for the paint and coating industry since many of
these industries require the use of paints and coatings (especially non-decorative). The country is also a major hub
for agro-based industries. These industries would also generate demand for non-decorative paints and coatings.
Apart from promoting industrial growth, Thailand also maintains friendly relations with neighboring countries and
has about 22 free trade agreements with countries such as China, India, Japan, Australia and New Zealand among
others, boosting the nation‟s trade activity in both domestic and international markets. In 2016, the World Bank
Doing Business indicator ranked the country as fourth in the East Asia and Pacific Region6 and 46th worldwide in
terms of Ease of Doing Business7 above other Asian countries in the region such as the Philippines, Indonesia and
China. On an average, the country attracted investments of approximately USD9.7 8 billion per year in net Foreign
Direct Investments (FDI) between 2010 and 2016. To stimulate further economic activity and achieve the status of a
developed economy from a currently developing economy status, the government of Thailand has embarked on a
20-year strategic plan to be executed during the period of 2017 to 2037, with the support of the World Bank,
incorporating broad-based reforms that seek to address economic stability, human capital development, business
competitiveness, government bureaucracy, infrastructure improvements, and environmental sustainability.
3
ASEAN includes Brunei, Cambodia, Indonesia, Laos, Malaysia, Myanmar, the Philippines, Singapore, Thailand and Vietnam
4
International Monetary Fund (IMF), World Economic Outlook, October 2016 revision
5
Economies with a GNI per capita between $4,036 and $12,475 are defined as upper middle-income economies, World Bank
6
This refers to 25 countries in the East Asia and Pacific region including the likes of China, Singapore, Malaysia, Indonesia, Philippines,
Thailand, Vietnam , Cambodia, Hong Kong and other smaller nations
7
http://www.doingbusiness.org/rankings
8
The Board of Investment of Thailand
192.1.2. Macro-Economic Overview of Thailand
GDP and GDP Growth Rates
During the early phase of this decade, the country achieved GDP growth rates of approximately 9.3% and 4.5% in
2012 and 2013, respectively. Weak GDP growth rates of approximately 1.8% and 3.1% in 2014 and 2015 following
the years of higher growth can be attributed to several factors. These include a fall in the prices of commodities
(e.g., rice, sugar, rubber and oil), slowdown in global trade; decrease in state spending; decline in foreign direct
investment (FDI); fall in demand from a major export market; failure of the first car policy (the government‟s short
–term economic stimulus policy) costing the Thai government approximately THB2.1 billion; and volatile political
situation arising from protests starting during the end of 2013 until mid-2014 followed by the Thai military coup in
the same year, amongst others. Despite such setbacks, GDP grew at a CAGR of approximately 4.5% between 2011
and 2016, growing from approximately THB11,300.5 billion in 2011 to approximately THB14,105.5 billion in
2016.
Thailand‟s year-on-year (YOY) GDP growth declined to 4.6% in 2011 from 11.9% in 2010 as a result of natural
disasters both inside and outside the country adversely impacting economic growth. The tsunami that hit Japan, one
of Thailand‟s major trading partners, following the strong Tohoku earthquake in March 2011, disrupted the supply
chains of several Japanese-owned manufacturers operating in Thailand. During the second half of 2011, severe
flooding hit Thailand causing losses of approximately THB400.0 billion. Subsequently the Ministry of Commerce
Thailand reported a contraction in shipment volumes by 15.5% in the last quarter of 2011 as many industrial estates
halted operations during the floods. The industrial production index also fell by 35.8% as compared to 2010. In
2012, GDP growth bounced back to 9.3% driven by a 10.3% increase in public spending, 8.3% rise in household
consumption, and 15.5% increase in overall investments. However, owing to the overall social unrest in the country
in 2013, both household consumption and public spending registered slow growth rates of 1.9% and 5.5% in
comparison to 2012. Protests and strikes resulting from political and social unrests also resulted in low industrial
capacity utilizations reducing output in the manufacturing sector (declined by 10.6% YOY as of November 2013).
Given the overall economic scenario in 2013, the GDP growth rate decreased to 4.5%. GDP growth further declined
to1.8% in 2014 as a result various internal and external factors. Social unrest during the early months of 2014
followed by military intervention negatively impacted the flow of foreign investments into the country (FDI fell by
approximately 10.0% as compared to 2013). State spending decreased while the tourism sector reported a significant
setback. Decrease in demand from one of the major export markets, China, and the fall in global commodity prices,
especially rubber, also contributed to the slowdown in growth. However, indications for a positive outlook emerged
in the later months of 2014 resulting from moderate inflation levels throughout (an indirect result of falling oil
prices), rise in the consumer confidence index, and speculation in the market that the Bank of Thailand (BoT) would
cut down key interest rates in 2015 to boost consumer spending in the country. The Board of Investment (BoI)
Thailand also registered an increase in the number of new project applications in late 2014, indicating strengthening
investor sentiment in the country.
In 2015, Thailand‟s GDP growth rate increased significantly, from 1.8% in 2014 to 3.1%. Government stimulus
package programs towards industrial growth and public welfare schemes resulting in increased factory production
and higher levels of public spending (government final consumption expenditure increased by 4.4% between 2014
and 2015), respectively, helped spur growth. However, a cautious outlook prevailed over the general economic
conditions resulting from the droughts caused by El-Nino, decrease in rice production, fall in oil and other
commodity prices, weaker demand from export markets in Asia and sluggish household spending (household final
consumption expenditure fell by 6.7% between 2014 and 2015) as well as lagging consumer confidence index over
the later months of the year. All these resulted in negative inflation in 2015. However, the announcement by the
government to reduce corporate taxes permanently to 20.0% and decrease real estate transfer tax from 2.0% to
0.01% has boosted sentiments in various industries such as automotive, technology, and construction.
20In 2016, the passing of Thailand‟s monarch after a 70-year reign added to political and economic uncertainties in the
country. However, the expected recovery of private consumption from negative growth of 6.7% in 2015 to a positive
growth of 2.7% in 2016, growth in public investment by 9.5%, and the return of inflation to positive territory of
0.3% after key interest rates held steady at 1.5%, are forecast to boost the GDP growth rate to 4.2% in 2016
compared to 3.1% in 2015. Public investment in large infrastructure projects, growth in the agriculture sector and
higher tourist arrivals (13.1% rise compared to 2015) continue to stimulate the economy. Global geopolitical shifts
such as Brexit, the change in the US administration followed by its‟ subsequent withdrawal from the Trans-Pacific
Partnership (TPP), and economic uncertainties prevailing in emerging markets in Southeast Asia could heighten
economic volatility. However, improvements in private consumption, public investments in infrastructure, consumer
confidence, and government stimulus in various sectors, steady interest rates, and increased tourism activities are set
to position Thailand on a growth path toward improved economic performance during the forecast period of 2016 to
2021. Furthermore, the International Monetary Fund (IMF) expects the GDP of Thailand to grow at CAGR of
approximately 5.3% between 2016 and 2021, increasing from approximately THB14,105.5 billion in 2016 to
approximately THB18,264.9 billion by 2021.
The expected near term YOY growth rates of approximately 5.4% in 2017, approximately 5.0% in 2018 and the
overall CAGR of 5.3% between 2016 and 2021 are likely to be driven by several aspects, among others, as outlined
below:
Greater private consumption (2.9% in 2017 in comparison to 2.7% in 2016);
Increased public investments (10.1% in 2017 in comparison to 9.5% in 2016);
Expected rise in inflation (1.6% in 2017 in comparison to 0.3% in 2016) due to escalating global
oil prices and stable interest rates, rise in rubber prices (grown by approximately 27.0% of Thai
farmers of all major crops) and fruit prices (produced by approximately 10.0% of Thai farmers of
all major crops);
Income tax reductions coming into effect in 2017 that could boost the purchasing power of the
population by approximately THB33.8 billion in 2017;
Possibility of general elections in late 20189; and
Higher tourist arrivals (10.0% increase forecast in visitors in 2017 in comparison to 2016).
Nominal GDP and Nominal GDP Growth Rates, THB, Thailand, 2011-2021F
9.3%
20,000 10.0%
Nominal GDP (THB billion)
Nominal GDP Growth (%)
8.0%
15,000
5.4% 5.2% 5.4% 5.6%
4.6% 5.0% 6.0%
4.5% 4.2%
13,132
10,000
3.1% 4.0%
11,300
12,349
12,901
13,537
14,106
14,861
15,597
16,408
17,295
18,265
5,000
2.0%
1.8%
0 0.0%
2011 2012 2013 2014 2015 2016E 2017F 2018F 2019F 2020F 2021F
Nominal GDP Nominal GDP Growth Rate
Source: IMF, World Economic Outlook Report, October 2016, compiled by Frost & Sullivan
Note: All figures are rounded. Base year is 2015.
9
http://thediplomat.com/2017/02/why-is-thailand-delaying-elections-until-2018/
21GDP Per Capita
As an indicator of a country‟s economic performance and standard of living, GDP per capita takes into account the
value of all the goods and services produced in the country per person. Growth in GDP per capita also tends to
reflect an overall increase in incomes and spending power. GDP per capita increased by 13.1% between 2011 and
2013, from THB167,073.0 in 2011 to THB188,902.9 in 2013. However, the YOY growth moderated to
approximately 1.3% after 2013 resulting in a GDP per capita of THB191,274.4 in 2014. As the economy stabilized
post the political unrest in 2014, the YOY GDP per capita growth rate in Thailand gradually increased to 2.8% and
4.0% in 2015 and 2016, respectively, achieving a robust CAGR of approximately 4.1% over the period of 2011 to
2016. Against the backdrop of heightened economic activities 10, the International Monetary Fund expects GDP per
capita between 2016 and 2021 to record a CAGR of approximately 5.2% between 2016 and 2021, increasing from
THB204,483.7 in 2016 to THB263,391.3 by 2021. This is likely to serve as an impetus to the paint and coating
industry as people with higher incomes are more inclined to invest and maintain real-estate assets.
Per Capita GDP and Per Capita GDP Growth Rates, (Nominal GDP), THB, Thailand, 2011-2021F
300,000 10.0%
8.8%
GDP per capita Growth (%)
250,000
8.0%
GDP per capita (THB)
200,000 5.5%
5.2% 5.1% 5.3% 6.0%
4.8%
150,000 4.2% 4.0% 4.0%
4.0%
1.3% 2.8%
100,000
167,073
181,722
188,903
191,274
196,657
204,484
215,087
225,454
236,937
249,545
263,391
2.0%
50,000
0 0.0%
2011 2012 2013 2014 2015E 2016E 2017F 2018F 2019F 2020F 2021F
GDP per capita GDP per capita growth
Source: World Economic Outlook Report, October 2016, compiled by Frost & Sullivan
Note: All figures are rounded. Base year is 2014 (Population actuals is 2014 while GDP actuals is 2015).
The rest of the page is intentionally left blank
10
Faster GDP growth vis a vis population growth
22Inflation
Inflation measures the percentage changes in the Consumer Price Index (CPI) and is a key indicator of the overall
prices of goods and services in a country. In Thailand, the CPI represents changes in the prices of a basket of 427
goods and services purchased by consumers. The Bureau of Trade and Economic Indices under the Ministry of
Commerce collects, summarizes, and reports CPI data on a monthly basis. Inflation rates declined from 3.8% in
2011 to approximately a negative 0.9% in 2015 especially due to the steep decline in global crude oil prices11 from
approximately USD100.0/barrel in 2013 to approximately USD38.0/barrel by 2015, triggering negative inflation12 in
the short-term. However, the Bureau of Trade and Economic Indices, Thailand measured the rate of YOY inflation
at a nominal value of approximately 0.2% in 2016 (estimates by IMF were at 0.3% in 2016). Inflation figures for
January and February 2017 are estimated at approximately 1.5% and 1.4% respectively.
The IMF expects Thailand to continue on a path of sustained inflation from 2016 to 2021, along with continuous
increase in nominal GDP growth rates, anticipating it to increase from approximately 1.6% in 2017 to approximately
2.5% by 2021, below the forecast GDP CAGR of 5.3% over the same period. However, the Bank of Thailand‟s
medium-term inflation target for 2017 is between 1.0% and 4.0%13. An excess of growth in GDP per capita over
inflation is indicative of a higher disposable income which is in turn, is expected to increase buyer sentiments
toward high-value purchases including housing. An increase in housing driven on the backdrop of strong economic
conditions is likely to fuel demand for paints and coatings in the forecast period.
Inflation, Thailand, 2011-2021F
10.0%
8.8%
Inflation and GDP per capita
8.0%
6.0%
5.5%
growth(%)
5.2% 5.1% 5.3%
4.8%
4.0% 4.2% 4.0% 4.0%
3.8% 2.8%
2.0% 3.0%
2.2% 1.3% 2.2% 2.5%
1.9% 1.9% 2.1%
1.6%
0.0%
0.3%
-0.9%
-2.0%
2011 2012 2013 2014 2015E 2016E 2017F 2018F 2019F 2020F 2021F
Inflation GDP per capita growth
Source: IMF, World Economic Outlook Report, October 2016 and Bureau of Trade and Economic Indices, Ministry of Commerce, Thailand;
compiled by Frost & Sullivan
Note: All figures are rounded. Base year is 2015 (Population actuals is 2014 while GDP and inflation actuals are 2015).
11
This refers to West Texas Intermediate (WTI or NYMEX) crude oil prices per barrel
12
https://www.wsj.com/articles/thai-consumer-prices-end-2015-in-negative-zone-1451882290
13
http://www.bangkokpost.com/business/finance/1216145/local-stocks-charmed-by-dovish-fed
232.1.3. Socio-Economic Overview of Thailand
Population Growth
With YOY growth rates as low as approximately 0.3% between 2011 and 2015, Thailand‟s population was range-
bound between approximately 66.0 million and 68.0 million people. Over this period, the total population of the
country grew from 66.9 million people in 2011 to 68.0 million in 2015. The population was estimated to increase to
68.1 million in 201614, resulting in a modest CAGR of 0.4% from 2011 to 2016. Also, between 2010 and 2015,
working age15 group population as a percentage of total population increased from 64.8% in 2010 to 65.3% in
201516. According to the United Nation‟s World Population Prospects, the population of Thailand is forecast to
increase to 68.6 million by 2021 from 68.1 million in 2016, signifying a CAGR of only 0.1%, less than half the rate
achieved from 2011 to 2016.
Population and Population Growth Rates, Thailand, 2011-2021F
CAGR 2016-2021 0.1%
CAGR 2011-2016 0.4%
75.0 67.5 67.7 68.0 68.1 68.3 68.4 68.5 68.6 68.6 0.5%
66.9 67.2
Population Growth (%)
60.0 0.4%
Population (millions)
0.4%
0.4%
0.4%
45.0 0.3% 0.3%
0.3%
0.3%
30.0 0.2%
0.2%
0.2%
15.0 0.1%
0.1%
0.1%
0.1%
0.0 0.0%
2011 2012 2013 2014 2015E 2016E 2017F 2018F 2019F 2020F 2021F
Population Population growth
Source: UN, World Population Prospects, 2015 revision, compiled by Frost & Sullivan
Note: All figures are rounded. Base year is 2014.
The rest of the page is intentionally left blank
14
Actual numbers were not available at the time of this report, March 2017
15
Defined as population between 20 years and 64 years
16
World Population Prospects, United Nations
24You can also read


