The Economic Impact of the Renewable Energy/Energy Efficiency Industry on the Connecticut Economy - REMI
←
→
Page content transcription
If your browser does not render page correctly, please read the page content below
The Economic Impact of the Renewable Energy/Energy
   Efficiency Industry on the Connecticut Economy

                                 Prepared by

                                     For

                                  July 2009

                           Stanley McMillen, Ph.D.
                            Managing Economist
                                   DECD
       With research assistance from Shadab Qaiser and Jesse Kalinowski
Executive Summary
The Connecticut Clean Energy Fund (CCEF) contracted with the Department of
Economic and Community Development (DECD) to perform an economic and fiscal impact
analysis of the renewable energy and energy efficiency (RE/EE) industry group on the state‟s
economy. The RE/EE industry is subsumed in the “clean energy economy” label that the
Pew Charitable Trusts defines as one that “…generates jobs, businesses and investments
while expanding clean energy production, increasing energy efficiency, reducing
greenhouse gas emissions, waste and pollution, and conserving water and other natural
resources. ” 1
The primary contribution of this work is the characterization and identification of the
relevant Connecticut RE/EE industries, that is, DECD develops an industry-based taxonomy
for subsequent analysis. Using a consensus definition of the core industries in the RE/EE
sector, DECD estimates the economic and fiscal impacts on Connecticut‟s economy using
the REMI model of the state economy. DECD uses the industry-based taxonomy because the
National Income and Product Accounts (NIPA) are based on aggregates of industries defined
in the North American Industrial Classification codes. This classification provides a
consistent definition of industries in Canada, Mexico and the United States for tracking
employment, establishments, the value of shipments and payroll trends. One can use
industry data to develop industry concentration measures and trends that may have policy
implications. Researchers can use the industry data to identify supply chains and
characterize industry clusters based on a variety of mathematical techniques.
The definition of the RE/EE industry group allows us to trace its evolution in terms of
the number of establishments (worksites), employment, and payroll of the industries in which
RE/EE firms are embedded. The definition of the RE/EE core group is in terms of the 2007
North American Industry Classification (NAICS) codes that have supplanted the older
Standard Industrial Classification (SIC) codes. DECD gathered data at the six-digit level,
which is the most detailed data available from the U.S. and state departments of labor.
Within an industry at the six-digit level, there are firms engaged in work wholly
unrelated to RE/EE as well as firms that engage exclusively in such work. DECD therefore
1
“The Clean Energy Economy: Repowering Jobs, Businesses and Investments Across America,” The Pew
Charitable Trusts, June 2009, www.pewtrusts.org.
Page 1estimates a range of plausible employment levels associated with each industry for economic
and fiscal impact analysis.
To place the present analysis in context, we review several studies in Appendix C that
examine the RE/EE industry and extract best practices and policies as they apply to
promoting the growth of the RE/EE industry in the U.S and Connecticut.
DECD‟s analysis identifies 53 industries in which firms operate in the RE/EE field
(see Appendix B). These industries range from manufacturing (e.g., generators for wind and
hydroelectric facilities), to wholesale and retail establishments that distribute RE/EE goods to
system integrators and to households and businesses. The taxonomy is subject to review and
amendment as for example firms (we have not included) morph into ones whose significant
business is RE/EE. The filtering criteria we use to define the RE/EE industries in
Connecticut primarily rely on their presence in and relevance to the state‟s economy.
Using professional judgment and a survey of Connecticut RE/EE firms,2 DECD
estimates a range of plausible direct employment levels for 2007 in the 53 industries. The
survey determined the fraction of the market covered by the surveyed firms and scaled
industry employment and sales accordingly. DECD estimated the fraction of firms in a
relevant industry engaged in RE/EE work and the fraction of workers (FTEs) in such firms
engaged in RE/EE work. This process produced a high and low jobs estimate that brackets
the survey result.
The economic analysis hypothetically removes the RE/EE industry from the
Connecticut economy and assumes no employment growth in the future. One basis for the
no growth assumption is that existing specialty trade contractors (e.g., installers) will perform
this new work in addition to or as a substitute for their traditional work. Further, in
manufacturing, RE/EE components and assemblies can be produced with little change to
traditional processes; therefore, it is not necessary to build new manufacturing facilities. In
addition, much of the RE/EE industry is subsidized, the future of which is uncertain.
Table E1 shows the direct, indirect, induced and total employment changes from a
baseline forecast of the Connecticut economy as a result of the presence and ongoing
2
Navigant Consulting conducted the survey of 74 Connecticut firms and researched 95 more as part of this
project. See
http://www.ctcleanenergy.com/YourBusinessorInstitution/CTRenewableEnergyandEnergyEfficiencyEconomy/t
abid/382/Default.aspx.
Page 2operations of the RE/EE industry in Connecticut. Direct employment is the number of jobs
we estimate that produce RE/EE goods and services, while the indirect employment
represents the jobs that arise from business to business transactions. Induced employment is
the jobs that result from workers in RE/EE firms spending their incomes on household goods
and services.
Table E1: Economic and Fiscal Impacts as Annual Average Changes from Baseline Forecast
Low Estimate: High Estimate:
Low Job Fraction of Fraction of
Estimate High Job Estimate State State
Direct Employment 3,661 5,830 0.23% 0.36%
Plus Indirect & Induced Employment 6,002 8,937 0.38% 0.56%
Total Employment 9,663 14,767 0.60% 0.92%
State GDP (Fixed 2007$) $2,524,157,510 $3,722,300,834 1.17% 1.72%
Personal Income (Fixed 2007$) $901,627,579 $1,363,575,142 0.47% 0.71%
Net State Revenue (Fixed 2007$) $81,075,453 $123,806,154 NA NA
Source: REMI and author‟s calculation.
To put these results in perspective, Connecticut‟s 2007 economy generated $216.3
billion in state GDP (value added), its private, nonfarm employment was about 1.6 million
jobs, and its labor force was about 1.7 million workers. Connecticut‟s personal income was
$192.6 billion in 2007.3 Net state revenue is not measured; DECD‟s economic model
(REMI) estimates state revenues from all sources and expenditures in major categories as a
result of net new economic activity.
For the two RE/EE employment estimates, these results indicate that Connecticut‟s
RE/EE industry contributes between 1.17% and 1.72% of Connecticut‟s GDP, between 0.6%
and 0.92% of the state‟s nonfarm employment, and between 0.47% and 0.71% of the state‟s
personal income on average each year. Using the Connecticut economic model (REMI), we
calculate an employment multiplier of 2.6 for each employment scenario, that is, for each
RE/EE job, on average each year an additional 1.6 jobs are created. This relatively high
multiplier arises most likely because of the relatively large local supply of labor and
intermediate goods.
The results indicate as well that, all else equal, Connecticut‟s RE/EE industry would
grow even if its employment did not because productivity is growing. Thus, given the state
3
Sources are CT DoL and the Bureau of Economic Analysis.
Page 3and national commitments to renewable energy and related technologies, Connecticut is
poised for significant growth in this sector if it makes significant public and private
investment in the human and physical capital required.
In this study, we do not quantify the ultimate potential for various classes of renewable
energy generation and therefore ignore for the present the benefits of savings from
investment in RE/EE technologies in Connecticut. This is future research. Notwithstanding,
this analysis is conservative as such investments and the savings they produce that reduce
production costs and increase household consumption in other sectors are not counted. In
addition, DECD does not estimate the non-financial benefits of reducing Connecticut‟s
carbon footprint adding to the conservative nature of this analysis.
Page 4Introduction
The Connecticut Clean Energy Fund (CCEF) contracted with the Department of
Economic and Community Development (DECD) to perform an economic and fiscal impact
analysis of the renewable energy and energy efficiency (RE/EE) industry group on the state‟s
economy. Of central importance in this work is the characterization and identification of the
relevant industries at a high level of industry detail, that is, developing an amendable
industry-based taxonomy for consistent analysis. Using a consensus definition of the core
industries in the RE/EE sector, DECD estimates the economic and fiscal impacts on
Connecticut‟s economy using the REMI model of the state economy. DECD uses the
industry-based taxonomy because the National Income and Product Accounts (NIPA) are
based on aggregates of industries defined in the North American Industrial Classification
codes. This classification provides a consistent definition of industries in Canada, Mexico
and the United States for tracking employment, establishments, the value of shipments and
payroll trends.
The definition of the RE/EE industry group allows us to trace its evolution in terms of
the number of establishments (worksites), employment, and payroll of the industries in which
RE/EE firms are embedded. The definition of the RE/EE core group is in terms of the 2007
North American Industry Classification (NAICS) codes that have supplanted the older
Standard Industrial Classification (SIC) codes. The level of industry detail we seek occurs at
the six-digit level. It is of course true that within an industry at the six-digit level, there are
firms engaged in work wholly unrelated to RE/EE. This compels us to estimate a range of
plausible employment levels associated with each industry.
In addition and to place the present analysis in context, we review several studies in
Appendix C that examine the RE/EE industry and extract best practices and policies as they
apply to promoting the growth of the RE/EE industry in the U.S.
Page 5Background
According to the definition of the clean energy economy, clean and/or renewable
energy causes little or no harm to the environment Examples of such sources are wind,
solar, hydroelectric, wave, tidal and biomass. Clean energy replenishes itself naturally over a
short time or is in some sense inexhaustible (such as solar energy). There are several benefits
of clean energy, in terms of its impact on energy efficiency (and therefore, life cycle costs),
climate change, security of energy supply and long-term economic benefits. Clean energy is
important because it reduces our dependence on fossil fuel (primarily from foreign sources),
enhances energy efficiency, and reduces greenhouse gas emissions.
Clean energy diversifies energy sources and relieves pressure on conventional energy
pricing. It mitigates global warming, provides energy security and enhances power quality.
Frequent blackouts, rising energy prices, global warming and climate change have renewed
national interest in clean energy technology. Clean energy technology has both
macroeconomic and microeconomic benefits. The macroeconomic benefits include
investment in new technology and new jobs, greater productivity and higher real disposable
income. While on the microeconomic side, clean energy technology will reduce the costs of
doing business and helps reduce energy expenditure.4 Clean energy projects have a
significant potential for regional employment growth, offering broad employment
opportunities ranging from high-tech manufacturing of photovoltaic cells to biomass
production in the agricultural sector.
Clean energy can revitalize rural communities as farmers can partially fulfill their
energy requirements locally. Clean energy is economically sustainable because the cost of
clean energy tends to fall over time resulting in declining costs of electricity generation from
renewable sources. Clean energy is environmentally friendly producing no emissions except
from those naturally associated with biomass decomposition. Clean energy technologies
mitigate the effects of climate change because of the low level of greenhouse gas (GHG)
[CO2 and H2O] and noxious emissions (SOX, NOX, unburned HCs, VOCs and particulates).
Clean energy technology has several health benefits; for example, such technologies reduce
pollution that in turn reduces asthma and respiratory diseases and their concomitant costs.
4
“U.S. Metro Economies: Current and Potential Green Jobs in the US Economy,” Research report
prepared by Global Insight (2008). Downloaded from www.usmayors.org.
Page 6Clean energy is subject to less supply disruptions. It diversifies a region‟s power-
generating capacity and reduces dependence on imported resources. It reduces the risk and
volatility of energy costs. Clean energy can play an important role in providing power to
critical infrastructure in case of a natural catastrophe; for example, New Orleans police used
solar-powered lighting for emergency services after hurricane Katrina.5
Clean energy technology is crucially important for Connecticut for the following
reasons:
1. To meet the statutory mandates of Connecticut’s energy policy: The General
Assembly declared, and state statutes unequivocally specify that “…it is the policy of the
State of Connecticut to (1) conserve energy resources by avoiding unnecessary and wasteful
consumption; (2) consume energy resources in the most efficient manner feasible; (3)
develop and utilize renewable energy resources, such as solar and wind energy, to the
maximum practicable extent; (4) diversify the state's energy supply mix;…” The law states
that Connecticut “shall seek all possible ways to implement this policy through public
education and cooperative efforts involving the federal government, regional organizations,
municipal governments, other public and private organizations and concerned individuals,
using all practical means and measures, including financial and technical assistance, in a
manner calculated to promote the general welfare by creating and maintaining conditions
under which energy can be utilized effectively and efficiently.
The General Assembly also declares that it is the continuing responsibility of the state
to use all means consistent with other essential considerations of state policy to improve and
coordinate the plans, functions, programs and resources of the state to attain the objectives
stated herein without harm to the environment, risk to health or safety or other undesirable or
unintended consequences, to preserve wherever possible a society which supports a diversity
and variety of individual choice, to achieve a balance between population and resource use
which will permit the maintenance of adequate living standards and a sharing of life‟s
amenities among all citizens, and to enhance the utilization of renewable resources so that the
availability of nonrenewable resources can be extended to future generations. The General
Assembly declares that the energy policy is essential to the preservation and enhancement of
5
“American Energy: A renewable path to Energy Security”, Research report prepared by the
World Watch Institute, Center for American Progress (2006). Downloaded from
http://americanenergynow.org.
Page 7the health, safety and general welfare of the people of the state and that its implementation
therefore constitutes a significant and valid public purpose for all state actions.”6
2. To mitigate the negative effects of climate change: Clean energy technology is
important for Connecticut for mitigating the negative effects of climate change. Climate
change can significantly affect important economic resources such as agriculture, forestry,
fisheries and water resources. Scientists have universally accepted that global climate
change (warming) is real whether human-generated or otherwise. Many countries are trying
to reduce GHG emissions by substituting clean energy technologies for fossil fuel.
Connecticut is playing its role in this transition to clean energy policies and to reduce the
adverse effects of global warming. Research shows that if global warming continues and
reaches 500 ppm CO2, Connecticut can expect dramatic changes in climate with substantial
impact on the state‟s economy. Research shows that Connecticut can significantly mitigate
the adverse effects of climate change by replacing fossil fuels with clean energy
technologies.7 Climate change can adversely affect Connecticut‟s coastal areas, which are
home to almost two million people. Connecticut lobster and fish production will be affected
because the maximum heat stress threshold for lobster is constantly exceeded due to climate
change (see footnote 5).
Similarly, Connecticut‟s forests, a major source of recreation, tourism and wildlife
habitat, will be adversely affected by climate change. Climate change can adversely affect
agriculture and fruit production in Connecticut, especially blueberry and pear production that
is sensitive to small temperature changes. However, Connecticut can mitigate the effects of
climate change by shifting to clean energy technologies that produce lower emissions than
fossil fuels. Currently, Connecticut is promoting clean energy technologies to mitigate the
adverse effects of climate change (see footnote 36 for the Governor‟s Energy Vision).
6
Connecticut General Statutes (CGS) Chapter 298: “Energy Utilization and Conservation,” Title: 16a:
“Planning and Energy Policy;” Sec. 16a-35k: “Legislative findings and policy.”
http://search.cga.state.ct.us/surs/Chap298.htm#Sec16a-35k.htm
7
“Confronting Climate Change in the U.S. Northeast: Sciences, Impacts and Solutions”, Research
report prepared by the Northeast Climate Impact Assessment Group (2007). Downloaded from
http://www.northeastclimateimpacts.org.
Page 83. To increase potential employment opportunities for Connecticut residents:
Employment in clean energy industries is growing at a fast pace (see page 17 of the Colorado
study in footnote 17). Clean energy generates more jobs compared with fossil fuel power
plants both per unit of capacity and per dollar invested. In the U.S., there are about 446,000
direct and indirect jobs in renewable energy industries.8 Connecticut can increase its
employment opportunities by harnessing clean energy technologies. Clean energy jobs are
associated with developing new technologies to increase energy efficiency, as well as the use
of renewable resources and with jobs that install and maintain existing „green‟ technologies.
To understand the potential of clean energy technology on the Connecticut economy, it is
essential to know the stock of renewable energy resources in Connecticut. Given this
information, we can more readily assess the potential for renewable sources to meet the
state‟s energy demand. Connecticut has a comparative advantage in various forms of clean
energy technologies.
An examination of the stock of renewable resources in Connecticut proves that the
state has the potential to be a leader in clean energy technology. Connecticut is well
positioned to take advantage of biomass energy generation with its rich supply of agricultural
and animal husbandry waste resources as well as lumber and wood waste.9 Connecticut can
utilize this oldest form of human energy production to create new jobs. Connecticut can
utilize biomass for electricity generation and individual firms can develop an extensive
biomass infrastructure to generate power for their own use.
Hydropower is the largest and most established renewable energy source in the U.S.
Currently the greatest potential is available in “small hydro projects” with capacities ranging
from 1 MW to 30 MW.10 Connecticut‟s numerous rivers and streams provide a suitable
environment to develop (or reinvigorate) small hydro projects.11 In May 2007, the
Connecticut Clean Energy Fund approved a loan of $557,134 to help fund the demonstration
of a new 500-kilowatt hydroelectric turbine system at Kirby Mill in Mansfield. Small hydro
projects such as this can be helpful for Connecticut in generating local employment (see
footnote 10 as well).
8
“Green Jobs: Towards sustainable work in a Low-Carbon World”, Preliminary report published by
UNEP, ILO, ITUC Green Jobs Initiative. Downloaded from www.unep.org.
9
Connecticut Clean Energy Fund. Downloaded from http://www.ctcleanenergy.com.
10
Low Impact Hydropower Institute, “Frequently Asked Questions,” p. 3. See www.lowimpacthydro.org.
11
See the Hartford Courant, Jan 18, 2009, “HYDRO: POWERFUL SPLASH FROM PAST.”
Page 9Wind energy is currently the fastest growing alternative energy source in the U.S.12
In Connecticut, there are few sites suitable for large wind installations. The Connecticut
Clean Energy Fund (CCEF) is focusing on the small wind rebate program and is developing
a small demonstration program that will showcase at least two sites near the seashore as well
as inland and at least four turbine types in order to identify the best candidate for its small
wind rebate program. The highest wind resources in Connecticut occur in the ridge crests in
the northwestern part of the state.
There are other forms of clean energy technologies that Connecticut can develop.
These are geothermal heat pumps and power generation, landfill gas, waves and the currents
in Long Island Sound. Geothermal is a clean energy resource that is expected to be widely
utilized in the U.S. and create further job opportunities. This technology taps into heat and/or
steam in the earth‟s crust and uses them directly for heating and cooling or for electricity
generation. Connecticut has only the low temperature resources suitable for geothermal heat
pumps applications.
Landfill gas production traps gases emanating from decomposing garbage (municipal
waste streams) and provides a reliable option for clean energy; however, this technology is
nascent in Connecticut. Wave technology seeks to capture the power of breaking waves.
Wave technology at Connecticut‟s shores is limited compared with other coastal states.
However, Connecticut can potentially utilize the strong underwater current along Long Island
Sound for electricity generation.
Clean energy is critically important for Connecticut to develop to protect its
environment, to create sustainable energy sources and to increase employment opportunities.
12
Wood, Laura (2009). Thompson Reuters Business Wire, Research and Markets: “Wind Energy: The World‟s
Fastest Growing Renewable Energy Source, Find Out Why in New Report.” Dublin, Ireland. Jan. 13, 2009.
http://www.reuters.com/article/pressRelease/idUS211832+13-Jan-2009+BW20090113.
Page 10Economic Impact Methodology
Given the importance of clean energy potential in Connecticut, it is instructive to
evaluate the economic impact of utilizing clean energy technology in the state. In this
section, we examine the current economic impact of the renewable energy/energy efficiency
(RE/EE) industry group on the state economy and provide an assessment of total jobs and
state GDP that is directly and indirectly attributable to the operations of firms in this industry
group. Unlike most studies reviewed earlier that used either a “static” input-output model or
simple spreadsheet-based analytical models, this study uses the REMI model of the
Connecticut economy to calculate the economic and fiscal impacts of the RE/EE industry
group on the state‟s economy (see Appendix A for details). The static input-output model
ignores dynamic price, productivity and competitiveness impacts of energy policies over
time, while the simple analytical model does not include the employment multiplier effects
and often under reports employment effects.
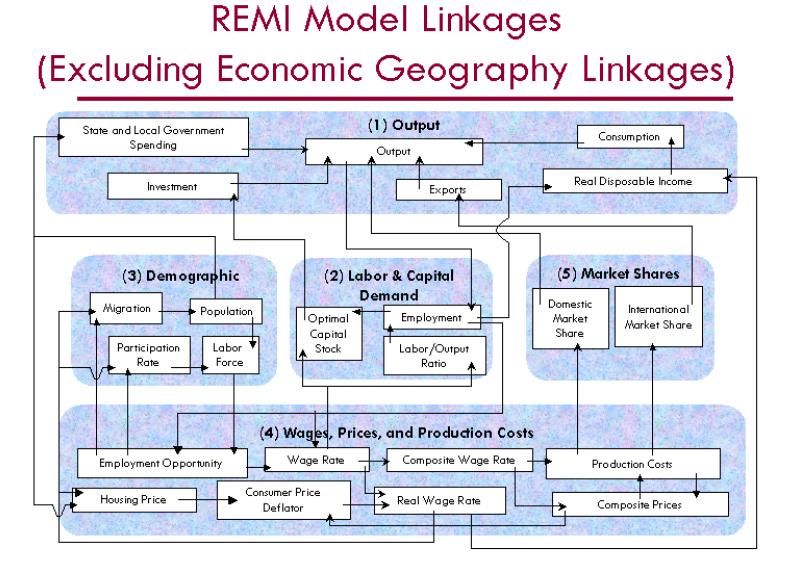
Therefore, we use the REMI model, which is a hybrid input-output model with
general equilibrium properties as well as Keynesian performance in which aggregate demand
determines GDP in the short run as prices are relatively fixed. This means that REMI
accounts for the dynamic price, productivity and competitiveness impacts of energy policies
over time, as well as the multiplier effects of job creation.
REMI is a dynamic framework in which to assess individual and firm behavioral
responses to changes in relative prices over time. Our study provides the potential regional
employment impact of the RE/EE industry group in Connecticut. We estimate the number of
jobs that arise directly and indirectly from the operations of firms in the RE/EE group as a
proxy for the uptake and implementation of clean energy technology in the state. Direct jobs
arise from constructing and maintaining clean energy generation facilities as well as from the
production of goods and services for the deployment of clean energy technologies. Indirect
jobs arise as Connecticut firms that supply labor and materials to clean energy generation
facilities buy goods and services from other state firms in their supply chains.
Finally, new jobs can be created in services, retail and other sectors as a result of net
new wages earned and spent by workers in the RE/EE industry group and in subsequent
rounds of spending (the induced effect). Similarly, direct state GDP impact arises from
construction, maintenance and operation of renewable generation facilities and from the
Page 11production and sales of goods and services of primary firms in the RE/EE industry group.
Indirect and induced effects from renewable energy generation products and increased
household wealth are an important source of net new economic activity. We present in this
report the policy implications of maximizing clean energy technology in Connecticut.
Characterizing the RE/EE Industry Group
In order to bound the space of RE/EE industries, we review five reports below that
ostensibly attempt the same task (see Appendix C for a review of the literature on states‟
energy policies). From these five reports and a survey of Connecticut firms, we glean a
candidate list of NAICS codes organized in the RE, hybrid and EE technology categories.
Component Manufacturing: Ohio’s Future in the Renewable Energy Industry13
The purpose of this report was to determine the effect of a large investment in
renewable energy systems at the national level on Ohio‟s manufacturing sector. A report by
the Renewable Energy Policy Project (REPP) determined that Ohio was in a favorable
position to benefit significantly from an investment in wind energy. The methodology in that
report was repeated in this study for several other industries including solar, geothermal, and
biomass. Once again, Ohio was in a favorable position among all renewable energy sources
considered.
The REPP then focused on specific information about the location and nature of the
manufacturing potential in Ohio. Census information for manufacturing is broken down to
the county level, making it possible to zoom into a state and identify manufacturing potential
by specific regions.
In order to perform this task, the REPP followed a three-step process. First, they
indentified the component parts that make up each system, then they identified a relevant
NAICS code for each component, and finally they used the census data to identify potential
manufacturing activity. When identifying the NAICS code, the REPP first looked at the 10-
digit code for the component, and then backed up to the 6-digit level (less resolution). The
report discusses advantages and disadvantages of this approach in detail.
13
See http://www.apolloalliance.org/downloads/Ohio_Manufacturing_Report_2.pdf.
Page 12Oregon’s Energy Efficiency and Renewable Energy Workforce14
The Oregon Employment Department wanted to identify jobs that would be created if
Oregon were to expand its energy efficiency and renewable energy production efforts. The
Department recognized that although none of these jobs is unique to the renewable energy
industry, some require additional knowledge and skills that are unique to the industry.
Identifying these specialized skills is important; if the renewable energy industry was to
expand, persons able to fill newly created and specialized positions would be needed.
The Employment Department used skill certifications unique to the energy efficiency
and renewable energy industries to identify some of the necessary skills. One specialized
position identified is a tax-credit certified solar technician. To qualify for this position,
special training, and satisfactory scores on several approved technology-specific competency
exams are necessary. Another specialized position identified is “green building inspector.”
A March 2008 report, “An Analysis of Clean Energy Workforce Needs and Programs in
Oregon,” identified existing training for these and other clean energy positions.
While training identifies several industries, those industries focus mainly on
installation and not product manufacturing. The state Employment Department recognized
that Oregon not only has companies that participate in the manufacturing of energy
efficiency and renewable energy products, but also many companies that could easily expand
into one or both of the sectors. The Department then identified industries in Oregon by
NAICS code that either produce “green” goods, or are readily able to produce them.
Washington State’s Green Economy Industries15
Washington‟s House of Representatives passed the Engrossed Second Substitute Bill
2815 in 2008. Its purpose is to make Washington‟s economy more sustainable and stimulate
job creation in both established and emerging sectors of the “green economy.”
A research team led by Washington‟s Community, Trade, and Economic
Development Department reviewed literature from government, non-profit, business, and
trade association sources on the green economy, green industry, and green jobs/green collar
14
See http://www.oaklandpartnership.com/GreenAcademy/Reports/Report%20SOW%20Phase%201%20-
%20FINAL%20Text%20Only%20Version%203-08.pdf.
15
See http://www.ecy.wa.gov/climatechange/CTEDdocs/GreenEconomy_StrategicFramework.pdf.
Page 13jobs. Their objective was to develop common definitions for “green economy” terms. This
list of key definitions includes Green Economy, Green Jobs, Energy Independence, and
Environmental Protection.
Once completed, they defined green industries, which included renewable energy,
energy efficiency, demand-response, green building and construction, recycling materials,
and consulting, and support services. These categories were further defined in a green
industry list organized by North American Industries Classification System (NAICS) code.
The Employment Security Department surveyed these NAICS industries to gather
data on both “green jobs” that already exist and levels of industry investment directed at
preparing for new green jobs in the future.
California Dreaming Green16
The report “Renewable Energy Demand: A case study of California” by George
Sterzinger and Jerry Stevens (2006) emphasized the importance of developing a national
program for renewable energy technology and its benefits to California. This report
emphasizes that renewable energy technology will benefit the regions and states that have the
best renewable resource base (i.e., solar, wind, biomass, and geothermal), it will also create a
demand for billions of dollars of manufactured components that support renewable energy
technology. With the appropriate economic incentives, this demand for manufactured
components can open up new markets for domestic manufacturers that are already
manufacturing similar equipment. This report outlines the potential for California from a
national commitment to accelerate renewable energy development and produce new markets
for potential manufactured components industries.
This report uses a three-step procedure to assess the dispersion of manufacturing of
the components of renewable energy system as following
1. Identify the component parts that make up each renewable energy system.
2. Identify a relevant NAICS code for each manufactured component.
3. Use the Manufacturing Census data to identify potential manufacturing activity.
These steps help to assess the economic potential for manufactured components that support
renewable energy systems.
16
See http://www.apollochallenge.org/CA_JOBS_REPP.pdf.
Page 14The report‟s key findings show that there are nearly 43,000 firms throughout the
United States that operate in industries related to manufacturing components that go into
renewable energy systems. A national program for renewable energy would represent nearly
$160.5 billion dollars of manufacturing investment, and would create in more than 850,600
new jobs. California stands to receive nearly 95,600 new jobs and $20.9 billion dollars of
investment in manufacturing components to supply this national development of renewable
energy. California ranks first in terms of job gains and first in terms of potential investment.
Colorado RE/EE Industry Characterization and Green Jobs Estimates and Forecasts
The December 2008 American Solar Energy Society (ASES) and the Management
Information Services, Inc. (MISI) study of the U.S. and the Colorado RE/EE industries and
occupations17 is among the most ambitious, comprehensive and thorough assessments of the
subject. Indeed, the study claims (page 6), “These are difficult, complex, and critical
questions, for which there is no single definitive answer. One of the major contributions of
this project was the development of a rigorous definition of the RE & EE industry, which
will become the standard in terms of any type of economic and job analysis of the industry
conducted by researchers in the future. In effect, ASES/MISI is here acting as the definer
and “benchmarker” of the industry as it evolves.”
The questions to which the study refers involve classifying the industries and
occupations in the RE/EE sector (pages 3 through 8). Despite this claim, the study does not
list the NAICS codes of industries at any point of the RE/EE value chain. It does list
occupations that, while ubiquitous, appear in the RE/EE sector. Their methodology
implicitly suggests they cross-tabbed standard occupational codes (SOCs) with NAICS codes
to determine the distribution of occupations by RE/EE sector.
The Colorado study‟s discussion of the issues involved in classifying RE/EE
industries and occupations is quite useful because it illustrates the difficult tradeoffs that
researchers must make in such evaluations. Notwithstanding, the study proceeds to estimate
employment and revenue levels and growth rates of the RE and EE industries in the U.S. and
17
“Defining, Estimating, And Forecasting The Renewable Energy And Energy Efficiency Industries In The U.S
And In Colorado,” http://www.ases.org/images/stories/ASES/pdfs/CO_Jobs_Final_Report_December2008.pdf .
An abbreviated version of this study appeared in January 2009 under the head, “Green Collar Jobs in the U.S.
and Colorado - Economic Drivers for the 21st Century.” See
http://www.ases.org/images/stories/ASES/pdfs/CO_Jobs_Rpt_Jan2009_summary.pdf.
Page 15Colorado as if they knew the underlying NAICS structure of the RE/EE value chain. While
there is a compendium of (duplicate) references for their analysis, it is not clear how they
arrived at their estimates using which reference works or estimation methodology.
A large portion of the Colorado study involves estimating the growth of green jobs in
the U.S. and Colorado under three growth scenarios. An important contribution is the
educational and workforce training required to supply the jobs envisioned under each growth
scenario.
DECD and CCEF RE/EE Industry Classification
Using the information on the NAICS categorization from the five reports above, we
check our own definition against these taxonomies.
The first task is to identify by North American Industrial Classification (NAICS)
codes industries that qualify as members of this group. Connecticut‟s renewable energy
industries are involved in solar photovoltaic and hot water systems (not concentrators), wind
energy systems, hydroelectric (less than 5 MW) systems, fuel cells, biomass (direct
combustion, gasification, co-firing, ADG, LFG, waste-to-energy [WTE]), tidal/wave, and
geothermal (heat pumps for Connecticut). Hybrid systems consist of combined heat and
power (CHP), smart grid, energy storage, demand/response, and organic Rankine cycle/waste
heat recovery.
Energy efficiency industries include energy service companies (ESCOs) consisting of
high efficiency HVAC, high efficiency lighting, daylighting, and demand/response firms.18
We include in the ESCO group firms that make and install energy-efficient doors, windows,
weather stripping and related products (notwithstanding footnote 18). These
conceptualizations of what industries are included in the RE/EE group will evolve as
stakeholders and experts consider and share their deep understandings of the nuances and
subtleties of these characterizations.
18
The Colorado study says (footnote 17), “An energy service company (ESCO) is a professional business
providing designs and implementation of energy savings projects that allow building owners to perform projects
to upgrade their building assets. The ESCO performs an in-depth analysis of the property, designs an energy
efficient solution, installs the required elements, and maintains the system to ensure energy savings during the
payback period. The savings in energy costs is used to pay back the capital investment of the project over a
five- to twenty-year period, or reinvested into the building to allow for capital upgrades that may otherwise be
unfeasible. If the project does not provide returns on the investment, the ESCO is usually responsible for
paying the difference.
Page 16Excluded Industries
For purposes of the DECD industry-based analysis, we exclude tidal/wave
technologies as we believe there is quite limited application in Connecticut‟s coastal waters.
In the geothermal space, we omit deep and/or horizontal wells and direct exchange systems
for power generation as Connecticut‟s most likely application is for residential and
commercial establishment heat pumps that would displace oil- and gas-fired heating systems
(bolded industries in Tables 1 through 3 below are within our scope, others are not). We
omit hydroelectric construction, and other large-scale electric generation, transmission and
distribution construction, manufacturing and operation industries (e.g., utilities).
We omit architects who design green buildings, and firms that service appliances and
equipment (except specialty trade contractors such as HVAC firms that install solar, wind,
and geothermal equipment and provide service). We omit industries that make, install and
service stationary gas turbine generators (peaking units) and industries involved with fuel-
efficient transportation (hybrid and fuel cell-powered vehicles and trains). We omit primary
research activity occurring in universities, government agencies and firms, as well as RE/EE
trade, professional and advocacy groups. We omit industries manufacturing, wholesaling
and retailing electronic products such as audio and television equipment and computers and
related peripherals from the energy-efficient appliance space. Finally, we omit industries
engaged in recycling, remanufacturing and reuse. These are conscious choices we make
based on our intention to include industries whose principal function is primary
manufacturing, distribution (wholesale and retail), installation and servicing in the RE/EE
value chain. Our filtering criteria include industries that have a measurable presence in
Connecticut.19
Connecticut’s RE/EE Value Chain
The industries listed in Tables 1 through 3 comprise a significant part of the value
chain from primary manufacturers of end user RE/EE equipment and commodities, as well as
wholesalers and retailers of such equipment and commodities. Absent are the suppliers to
these industries. Examples of supply chain industries are silicon ingot manufacturers and
19
Privacy and confidentiality considerations prevent the disclosure of industry data if there are five or fewer
firms in an industry classification in the state.
Page 17manufacturers of electronic components such as transistors and integrated circuits used in
inverters. Because the latter industries supply significant portions of their output to other
industries such as consumer electronics, we omit them from the RE/EE value chain and
identify them to the extent possible in the deep supply chain in future research.
Table 1: Renewable Energy Industry Areas
Solar Wind Fuel Cells Biomass Water Geothermal
-Solar PV -On Shore -PEM -Direct -Hydro (< 5 -Heat Pumps
-Solar Hot Water -Off Shore -Solid Oxide Combustion MW) -Deep Wells
-Concentrating - (SOFC) -Gasification -Tidal -Horizontal
Solar Power -PAFC -Co-Firing -Wave -Direct
-MCFC -Anaerobic Exchange
Digester Gas
(ADG)
-LFG
-Waste-to-
Energy
Other Electric Other Electric Other Electric Other Electric Plumbing,
Other Electric Power
Power Power Power Power Heating, AC
Generation
Generation Generation Generation Generation Contractors
(221119)
(221119) (221119) (221119) (221119) (238220)
Power Boiler
Plumbing, Surface-Coated
Plumbing, Heating, Other Waste Motors and and Heat
Heating, AC Paperboard
AC Contractors Collection Generators Exchanger
Contractors Manufacturing
(238220) (562119) (335312) Manufacturing
(238220) (322226)
(332410)
Heat pumps
manuf. +
Semiconductor Printed circuits Power
Motors and Heating & air
and Related Device and electronics Logging Transmission
Generators conditioning
Manufacturing assemblies (113310) Equipment
(335312) combo units
(334413) (334418) (333613)
manuf.
(333415)
Heat pumps
merchant
All Other All Other All Other
wholesalers +
Miscellaneous Miscellaneous Miscellaneous
Combustors, Heating
Electrical Speed Changer, Electrical Electrical
nonhazardous equipment,
Equipment and Industrial Equipment and Equipment and
solid waste warm air (i.e.,
Component (333612) Component Component
(562213) forced air)
Manufacturing Manufacturing Manufacturing
merchant
(335999) (335999) (335999)
wholesalers
(423730)
Page 18Computer and Computer and Computer and
Computer Computer Digesters, Computer Drilling water
Peripheral Power Peripheral industrial-type, Peripheral wells (except
Equipment and Transmission Equipment and heavy gauge Equipment and water intake
Software Equipment Software metal, Software wells in oil and
Merchant (333613) Merchant manufacturing Merchant gas fields)
Wholesalers Wholesalers (332420) Wholesalers (237110)
(423430) (423430) (423430)
Alkaline cell
All Other
storage
Batteries (except Miscellaneous
batteries (i.e.,
automotive) Electrical Hydrogen
nickel-cadmium,
merchant Equipment and manufacturing
nickel-iron,
wholesalers Component (325120)
silver oxide-zinc)
(423610) Manufacturing
manufacturing
(335999)
(335911)
Alkaline cell
storage batteries
Turbine& Alkaline cell
(i.e., nickel-
Turbine primary
cadmium, nickel-
Generator Set batteries
iron, silver oxide-
Units Manuf. manufacturing
zinc)
(333611) (335912)
manufacturing
(335911)
Computer and
Computer Batteries
Alkaline cell Peripheral (except
primary batteries Equipment and automotive)
manufacturing Software merchant
(335912) Merchant wholesalers
Wholesalers (423610)
(423430)
Batteries
(except
automotive)
merchant
wholesalers
(423610)
Page 19Alkaline cell
storage
batteries (i.e.,
nickel-
cadmium,
nickel-iron,
silver oxide-
zinc)
manufacturing
(335911)
Alkaline cell
primary
batteries
manufacturing
(335912)
In general, industries with codes that begin with 11 are in agriculture (logging that
produces chips for biomass in this case), those beginning with 23 are specialty trade
contractors, those beginning with 32 and 33 are manufacturing industries, those beginning
with 42 are wholesalers, and those beginning with 44 and 45 are retailers. Industries with
codes beginning with 56 are part of the waste management industry group.
Page 20Table 2: Hybrid Systems
CHP Smart Grid Energy Storage Demand Organic
Response Rankine
Cycle (WHR)
-Small -AMI -Advanced -Control and -Waste
distributed -Home Area batteries monitoring heat
-Large Networks (HAN) -Compressed devices recovery
central -Data management Air Energy generators
Communication and Storage
controls (sensors (CAES)
and actuators) -Vehicle to
grid (e.g.
PHEVs)
Temperature
controls,
Alkaline cell automatic,
storage batteries residential and
Cabin environment (i.e., nickel- commercial-types,
Other Electric
indicators, transmitters, cadmium, nickel- manufacturing +
Power Generation
( 221119)
and sensors iron, silver oxide- Building services
manufacturing (334511) zinc) monitoring
manufacturing controls,
(335911) automatic,
manufacturing
(334512)
Alkaline cell
Relay and
primary batteries
Industrial Control
manufacturing
Mnf. (335314)
(335912)
Batteries (except
automotive)
merchant
wholesalers
(423610)
Page 21Table 3: Energy Efficiency Areas
Building Heating Cooling Lighting Appliances and
Envelope Other
-Duct sealing -Condensing gas -Energy star -Lighting -Faucet aerators
and insulation furnaces, boilers, ceiling fans motion -Low flow
-Building and and water heaters -Energy Star AC sensors showerheads
window -Tankless and units -Specialty -Energy Star qualified
insulation heat pump water fluorescent ovens, TVs,
heaters bulbs and refrigerators, washers
-Programmable fixtures and dryers, and other
thermostats -CFLs appliances.
-LEDs -Efficient commercial
-Daylighting dishwashers
design
Power Boiler and
Roofing Attic fans Electric Lamp Household Cooking
Heat Exchanger
Contractors manufacturing Bulb/Parts Mnf Appliance
Manufacturing
(238160) (333412) (335110) Manufacturing (335221)
(332410)
Batteries
Bath fans with
Drywall and Air Purification (except
integral lighting
Insulation Equipment automotive) Appliance stores,
fixture, residential,
contractors Manufacturing merchant household-type (443111)
manufacturing
(238310) (333411) wholesalers
(335211)
(423610)
Temperature
Temperature
controls,
controls,
automatic,
automatic,
residential and
Urethane and residential and
commercial-
Other Foam Heating boilers, commercial-types,
types, Appliance stores,
Product (except steam and hot manufacturing +
manufacturing + household-type, used
Polystyrene) water, merchant Building services
Building services (453310)
Manufacturing wholesalers (423720) monitoring
monitoring
(326150) controls,
controls,
automatic,
automatic,
manufacturing
manufacturing
(334512)
(334512)
Glass Products Heating equipment, Fans, household-
Made From hot water, (except type, merchant Faucets, plumbing,
Purchased Glass hot water heaters) wholesalers manufacturing (332913)
(327215) manuf. (333414) (423620)
Insulation
materials (except Ovens, commercial- Dishwashers, household-
Ceiling fan stores
wood) merchant type, manufacturing type, manufacturing
(444190)
wholesalers (333319) (335228)
(423330)
Page 22Wood window &
Ovens, commercial- Household Refrigerator
Door
type, merchant and Home Freezer
manufacturing
wholesalers (423440) Manufacturing (335222)
(321911)
Cabin environment
indicators,
Mineral Wool Household Laundry
transmitters, and
Manufacturing Equipment
sensors
(327993) Manufacturing (335224)
manufacturing
(334511)
Within each RE/EE industry, there are firms that have no relation to RE/EE products
or services. For example, some, but not all, firms in the Roofing Contractors industry
(NAICS 238160) install daylighting as part of their function. In addition, in a given firm in a
particular RE/EE industry, not all employees produce RE/EE goods and/or services. For
example, a firm that installs and services high-efficiency heating and cooling systems may
deliver oil as well. Therefore, a portion of its workforce is not engaged in RE/EE work. It is
necessary therefore to estimate ranges of plausible RE/EE employment and output (sales) in
each industry. These scenarios are the basis of a plausible range of economic impacts
attributable to the RE/EE industry. Having established this framework for analysis, it will be
straightforward to amend the boundary of the RE/EE industry group with subsequent
research.
Table B.1 in Appendix B defines the 53 industries appearing in Tables 1 through 3
above (some industries appear in more than one RE/EE category in Tables 1 through 3
because they operate in or supply more than one industry in that category). Because the
Connecticut Department of Labor suppresses certain employment data due to confidentiality
concerns, we note that Other Electric Power Generation (221119), Surface-Coated
Paperboard Manufacturing (322226), Hydrogen manufacturing (325120), Attic fan
manufacturing (333412), Bath fans with integral lighting fixture, residential, manufacturing
(335211), Household Cooking Appliance Manufacturing (335221), Household Refrigerator
and Home Freezer Manufacturing (335222), Household Laundry Equipment Manufacturing
(335224), Dishwashers, household-type, manufacturing (335228), Alkaline cell storage
batteries (i.e., nickel-cadmium, nickel-iron, silver oxide-zinc) manufacturing (335911), and,
Alkaline cell primary batteries manufacturing (335912) have a negligible presence in
Connecticut and we therefore omit them from the analysis that follows.
Page 23Data Sources
The Connecticut Department of Labor (DoL) supplied DECD with Connecticut
employment, establishment and payroll data for each RE/EE industry identified in Table B.1
for calendar years 2003 through 2007. As we describe above, in each RE/EE industry, there
are firms that perform functions that are clearly in the RE/EE sphere and others that are not
because even at the six-digit level of industry detail there is substantial firm heterogeneity.
In addition, within a firm in a RE/EE industry, there are workers employed in producing
RE/EE goods and services and others who perform wholly unrelated functions. Therefore,
we refine the employment and establishment source data based on a survey of firms in the
RE/EE industry group in Connecticut.
In 2007, for the industry data DoL disclosed, there were 3,818 Connecticut
establishments (worksites) of the 53 RE/EE industries appearing in Table B.1. In 2007, there
were 42,943 jobs in these establishments with a payroll of $2.96 billion. A small industry
and job subset that we estimate below drives the economic and fiscal impact.
RE/EE Industry Growth in Connecticut 2003-2007
For the group of 53 Connecticut RE/EE industries, the annual average growth rate of
establishments from 2003 through 2007 is -11.9% while the simple growth rate from 2003 to
2007 is -31.6%. The group‟s annual average employment growth rate from 2003 through
2007 is -5.6% while the simple growth rate from 2003 to 2007 is -22.8%. The differences in
growth rates arise from fluctuations in establishment and job levels each year that tend to be
smoothed and attenuated with the average of year-to-year growth rates. Similarly, annual
average (nominal) payroll growth for the group is -0.5% while the simple average (nominal)
payroll growth rate is -4.8%. The negative payroll growth in nominal terms indicates that
Connecticut workers‟ wages on average in this industry group did not keep pace with
inflation despite a rebound during this period from the 2001 recession.
For economic and fiscal impact analysis purposes (REMI inputs), we aggregate the
53 industries into two- and three-digit level NAICS groups. Table 4 (columns six through
eleven) shows the simple and annual average growth rates of the aggregated industries we
use for the direct impact in REMI in terms of the number of establishments, employment and
payroll from 2003 through 2007. Inspection of this data shows that the number of
Page 24establishments in the RE/EE group has remained roughly constant with a few declines
notably in retail and waste management and remediation services. Employment growth was
negative for several industries notably logging (wood chips, -20%) and wood product
manufacturing (windows and doors, -13%) while positive growth did not exceed 4.5% for
any industry. Payroll growth in most industries was positive and did not exceed 8%, while
for logging (wood chips) and wood product manufacturing (windows and doors), payrolls
declined 11.3% and 14.7% respectively in annual average terms. Recall that these numbers
reflect the changes in industry establishments, employment and payroll at the six-digit level
of detail and do not necessarily reflect declines in, for example, retail as a whole. Moreover,
it is possible that RE/EE firms grew during this period while the industry in which they are
embedded declined. Therefore, it is difficult to extract trends for the subset of specific RE/EE
industries we seek.
REMI Modeling Strategy
We model the economic and fiscal impact of the RE/EE industries defined above by
subtracting each industry‟s direct RE/EE employment from the state (model) economy. The
REMI model automatically reduces the capital required to support these workers. The result
is the difference between the Connecticut economy with the RE/EE industry group and the
Connecticut economy in which all traces of the RE/EE industry group as defined are absent.
Almost 37% of the Connecticut RE/EE industry group‟s jobs are in three specialty
trade contractor industries (Roofing Contractors, Plumbing, Heating, AC Contractors
[HVAC], and Drywall and Insulation Contractors). This group includes solar PV and solar
hot water systems installers and servicers, efficient heating and cooling system installers and
servicers (HVAC), and insulation and weatherizer installers and servicers. Twenty-six
percent of the state‟s RE/EE jobs are in the HVAC industry.
Using professional judgment and the Navigant Consulting firm survey (see footnote
2), for purposes of economic and fiscal analysis, we assume RE/EE industry direct
employment ranges from 1% to 100% of employment in those firms engaged in RE/EE work
weighted by the fraction of each industry‟s firms engaged in RE/EE work (ranging from 5%
to 100%). This procedure yields a low-level total direct employment estimate of 3,661
Connecticut jobs and a high estimate of 5,830 direct jobs for the RE/EE group (the mean job
Page 25estimate is 4,746). Table B.1 presents the ranges for each Connecticut RE/EE industry in
columns four and five. Table 4 (columns 3 and 4) presents aggregates for the industry job
estimates used in REMI. This procedure is admittedly unscientific and the mean estimate
corresponds roughly to the estimate of direct jobs extrapolated from the Navigant survey of
Connecticut RE/EE firms (see footnote 2). For perspective, Connecticut‟s fuel cell industry
employed 1,156 workers in 2007 representing respectively 31.5% and 19.8% of the low and
high job range estimates above.20
20
See http://www.fuelcellseminar.com/pdf/2008/thursday/03_Rinebold_J_COM41-2.ppt.pdf.
Page 26Table 4: RE/EE Industry Growth in Aggregate Sectors
CT Establishment
RE/EE Jobs 2007 Growth CT Jobs Growth CT Payroll Growth
Avg. Avg.
Avg. Ann. 2003- Ann. 2003- Ann. 2003- # Establish-
REMI NAICS RE/EE Jobs 2007 Growth, 2007 Growth, 2007 Growth, 2007 ments # Est. # Est. # Est. # Est. # Jobs # Jobs # Jobs # Jobs # Jobs
REMI 70-Sector Model NAICS Aggregation Sectors Low Est. High Est. 2003-07 Growth 2003-07 Growth 2003-07 Growth 2007 2006 2005 2004 2003 2007 2006 2005 2004 2003 Payroll 2007 Payroll 2006 Payroll 2005 Payroll 2004 Payroll 2003
Forestry and logging; Fishing, hunting, and
trapping 113, 114 1 3 0.28% 0.00% -20.14% -62.96% -11.36% -67.40% 10 10 9 10 10 10 19 19 27 28 $293,049 $578,332 $656,135 $973,044 $899,039
Construction 23 313 805 1.18% 4.79% 3.48% 5.62% 4.73% 34.65% 2,035 2,034 2,013 1,975 1,942 16,870 15,900 15,832 15,972 14,754 $944,883,336 $797,700,343 $806,776,279 $915,918,655 $701,752,720
Wood product manufacturing 321 19 36 0.38% 0.00% -13.64% -59.34% -14.71% -60.76% 14 13 15 15 14 74 69 200 182 194 $3,368,059 $3,155,440 $10,073,701 $8,449,881 $8,582,246
Nonmetallic mineral product manufacturing 327 113 192 -1.32% -5.26% 4.51% 16.13% 4.10% 33.98% 18 18 18 19 19 360 338 368 310 307 $13,123,185 $11,655,065 $11,691,673 $9,549,154 $9,794,607
Fabricated metal product manufacturing 332 161 251 1.54% 5.26% -3.38% -2.83% -0.78% 13.52% 20 20 22 20 19 584 631 736 601 701 $34,293,651 $33,503,302 $45,778,794 $28,954,967 $30,208,578
Machinery manufacturing 333 270 564 -0.81% -3.64% -5.27% -19.17% 7.91% -5.73% 53 52 54 58 55 3,314 3,169 3,102 4,100 4,248 $270,342,179 $234,792,893 $214,162,745 $278,045,465 $286,788,205
Computer and electronic product manufacturing 334 89 174 0.11% 0.00% 3.26% 7.30% 1.64% 24.60% 52 53 53 56 52 2,601 2,520 2,508 2,424 2,289 $175,557,102 $165,902,188 $166,562,636 $149,606,258 $140,901,870
Electrical equipment and appliance
manufacturing 335 1,530 1,867 1.05% 3.75% 0.72% 6.24% 4.87% 40.59% 83 83 89 84 80 4,464 4,197 4,412 4,202 4,359 $422,597,479 $382,054,674 $365,355,278 $296,918,711 $300,595,186
Plastics and rubber products manufacturing 326 191 267 -1.77% -9.09% 1.24% 17.23% 6.16% 47.16% 10 10 9 9 11 381 372 351 325 367 $22,669,380 $21,132,354 $18,644,697 $15,264,622 $15,404,126
Wholesale trade 42 470 824 0.31% 1.22% -0.14% 0.04% 4.60% 10.82% 665 665 658 653 657 7,340 7,216 6,948 7,337 7,400 $711,120,950 $780,408,309 $613,332,853 $622,385,909 $641,698,521
Retail trade 44-45 390 577 -2.17% -8.43% -1.71% -3.10% 0.56% 6.20% 652 652 666 688 712 5,814 5,938 5,996 6,000 6,232 $274,880,915 $307,864,304 $272,821,174 $263,580,240 $258,828,655
Professional and technical services 54 36 101 5.97% 25.00% 3.14% -0.69% 2.62% 30.62% 180 164 160 139 144 720 686 679 725 642 $62,896,956 $60,141,401 $57,093,170 $52,959,868 $48,151,158
Waste management and remediation services 562 80 169 -4.69% -18.75% -3.72% -12.37% 0.18% -0.40% 26 27 33 33 32 411 389 448 469 483 $28,990,149 $27,787,193 $28,829,902 $29,125,037 $29,106,914
Totals 3,661 5,830
Average of High-Low Job Est. 4,746
Source: CT Dept. of Labor and author‟s calculations
Page 27You can also read