2020 INDIANA TAX INCENTIVE REVIEW - OFFICE OF FISCAL AND MANAGEMENT ANALYSIS LEGISLATIVE SERVICES AGENCY
←
→
Page content transcription
If your browser does not render page correctly, please read the page content below

OFFICE OF FISCAL AND
M A N AG E M E N T A N A LY S I S
L E G I S L AT I V E S E RV IC E S AG E NC Y

2020 INDIANA TA X
INCENTIVE REVIEW
T h e O f f i c e o f Fi s c a l a n d M a n a ge m e n t A n a l ys i s
(OFMA) i s a divi s ion of t he Leg i s lat ive Ser vic e s
A g e n c y t h a t p e r f o r m s f i s c a l , b u d g e t a r y, a n d
m a n a g e m e n t a n a l ys i s f o r t h e I n d i a n a G e n e r a l
As sembly.

                              D i rec tor
                          JESSICA HARMON

                        D e pu t y D i rec tor s
                            HEATH HOLLOWAY
                          ALLISON LEEUW

                    I n c e ntive R e vi e w T e am
                         RANDHIR      JHA
                            SETH      PAYTON
                      ALEXANDER       RAGGIO
                        ROBERT J.     SIGALOW
                           OLIVIA     SMITH
                          LAUREN      TANSELLE

                                 S taff
                   CHRISTOPHER        BAKER
                          JASON       BARRETT
                            BILL      BRUMBACH
                           MARK       GOODPASTER
                         CORRIN       HARVEY
                           DAVID      LUSAN
                       HEATHER        PULETZ
                          KAREN       FIRESTONE ROSSEN
                          KASEY       SALT
                            RAVI      SHAH
                         AUSTIN       SPEARS
                        CAMILLE       TESCH
                             LIA      TREFFMAN
                           ADAM       WHITE

                               October 2020 | Office of Fiscal and Management Analysis   II
CONTENTS

PREFACE                                                          i
EXECUTIVE SUMMARY                                               1
INTRODUCTION                                                     2
 Tax Incentive Review Process                                    2
 Definition of Tax Incentive                                     3
 Tax Incentive Review Purposes and Approaches                    3
 Tax Incentive Review Report                                    4
 Tax Incentive Review Schedule                                  4
ENTERPRISE ZONE PROGRAM (IC 5-28-15)                            7
 Administration                                                 10
 Tax Incentives to Businesses and Employees                     11
 Enterprise Zone E stablishments                                13
 Effectiveness of the Program: Literature Review                15
 Analysis                                                       16
ENTERPRISE ZONE EMPLOYMENT EXPENSE
CREDIT (IC 6-3-3-10)                                             21
ENTERPRISE ZONE EMPLOYEE INCOME
DEDUCTION (IC 6-3-2-8)                                           22
 Individuals                                                     24
 Employment by Firms                                             24
ENTERPRISE ZONE OBSOLESCENCE DEDUCTION
(IC 6-1.1-12-40)                       26
ENTERPRISE ZONE INVESTMENT DEDUCTION
(IC 6-1.1-45)                                                    27

                     October 2020 | Office of Fiscal and Management Analysis   III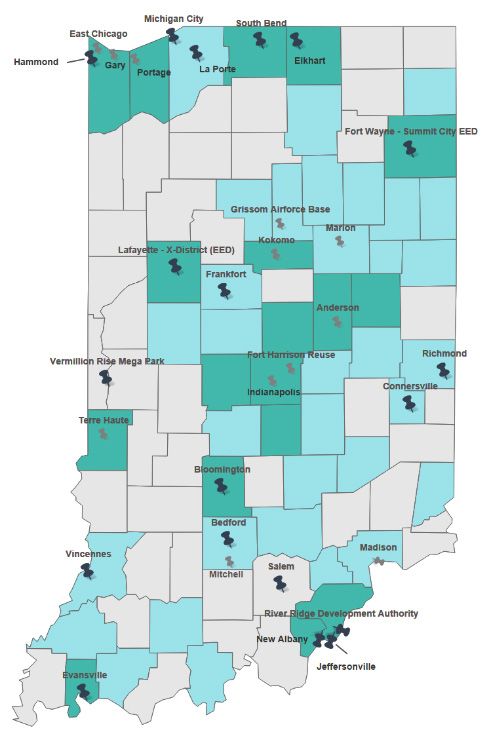
ENTREPRENEUR AND ENTERPRISE DISTRICT
(IC 5-28-15.5) 29
Administration CONTENTS 30
Funding 30
EED Incentives 31
Implications of EED Program from E xisting
Research 31
Program Implementation 32
ABATEMENT DEDUCTION FOR VACANT
BUILDINGS (IC 6-1.1-46.2) 34
EXEMPTION FROM PERSONAL PROPERTY
ASSESSMENT FLOOR (IC 6-1.1-3-25) 35
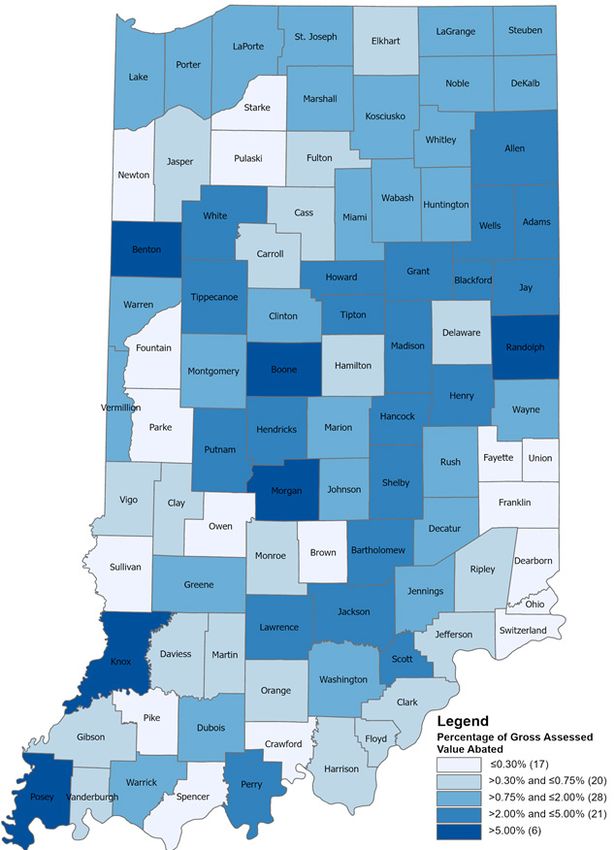
PROPERTY TAX ABATEMENTS (IC 6-1.1-12.1) 36
Indiana Property Tax Abatement 36
C haracteristics of the Indiana Abatement Program 38
Indiana Abatement C laims Data 41
Indiana Abatement Savings and Property Tax
Relief 41
Previous Research 46
Analysis 48
Conclusion 52
APPENDIX A: ENTREPRENEUR AND ENTERPRISE
DISTRICS (MAPS) A
APPENDIX B: TAX INCENTIVE REVIEW STATUTE
(IC 2-5-3.2-1) B
APPENDIX C: TAX INCENTIVE AND INCENTIVE
PROGRAM DESCRIPTIONS E
REFERENCES I
October 2020 | Office of Fiscal and Management Analysis IV
PREFACE

PREFACE
IC 2-5-3.2-1 establishes an annual review, analysis, and evaluation
process for state and local tax incentives.

T
      he original statute required the evaluation of each tax incentive at
     least once during two consecutive five-year cycles. The first five-year review cycle
     began during the 2014 legislative interim and was completed during the 2018 interim.
During the 2019 legislative session, the legislature extended the second tax incentive
review schedule from a five-year cycle to a seven-year cycle. The annual tax incentive
review is conducted by the Office of Fiscal and Management Analysis, Legislative
Services Agency. The prior year reports can be found on the Indiana General Assembly’s
website at https://iga.in.gov/legislative/2020/publications/tax_incentive_review/.

Pursuant to IC 2-5-3.2-1, the report:

  •    Specifies the review schedule for 2020-2025
  •    Reviews, analyzes, and evaluates the following tax incentives and incentive
       programs:
       • Enterprise Zone Employment Expense Credit
       • Enterprise Zone Employee Deduction
       • Enterprise Zone Obsolescence Deduction
       • Enterprise Zone and Entrepreneur and Enterprise District Investment
           Deduction
       • Entrepreneur and Enterprise District Pilot Program
       • Entrepreneur and Enterprise District Vacant Building Abatement
       • Entrepreneur and Enterprise District Personal Property Minimum Value
           Exemption
       • Property Tax Abatements
  •    Provides descriptive information and data relating to the tax incentives and
       incentive programs subject to review in 2020.
  •    Analyzes and evaluates the effectiveness of the tax incentives and incentive
       programs subject to review in 2020.

We would like to acknowledge the following agencies and non-profit organizations for
their assistance in providing data that is presented and analyzed in this report:

  •    Department of State Revenue
  •    Indiana Economic Development Corporation
  •    Department of Local Government Finance
  •    Association of Indiana Enterprise Zones

                                        October 2020 | Office of Fiscal and Management Analysis   i
EXECUTIVE SUMMARY
EXECUTIVE SUMMARY
2 0 2 0 R E V I E W O F TA X I N C E N T I V E S
The Legislative Services Agency (LSA) analyzed various tax
incentives this year that largely focus on activities such as regional
development, job creation, business attraction, and wage growth.
T
he incentives reviewed this a small and declining portion of all tax
year were among the incentives incentives claimed by EZ businesses, but
included in LSA’s annual tax recently those businesses claiming the
incentive evaluations in 2016 and 2017, credit have been investing at higher levels
with the exception of the Entrepreneur relative to their incentives received. While
and Enterprise District program and the employee income tax deduction
its related incentives. This is the second has seen an increase in repeat tax
report in the second tax incentive review claimants in recent years, overall claims
cycle that started in 2019. continue to decline as the vast majority of
The Indiana Enterprise Zone (EZ) zone businesses are primarily employing
program and its related tax incentives were workers outside of the zones. A review
established to encourage the development of the most popular EZ incentive, the
of distressed areas. The conclusions from property tax investment deduction,
the prior LSA report on EZs were revisited shows that not only has the total tax
alongside a new analysis that focused on savings increased year over year, but the
aggregate trends and long-term impacts. tax savings have increased at a higher rate
Academic literature provided many areas than tax bills for deduction recipients.
of interest to evaluate including the impact Beginning in 2018, the Entrepreneur
of incentive types on employment levels, and Enterprise District (EED) pilot
the relationship between employment program was launched in Fort Wayne
and wages, and the changes in property and Lafayette to encourage, develop,
values over time. This nuanced approach and support entrepreneurship and
to evaluation precludes the report from small business development. This
making any new causal claims related to program is administered by the same
the impacts of EZs, but it does develop a urban enterprise associations (UEA)
broader understanding of what economic that previously ran the EZ programs
changes have occurred in these zones. in each city. While the program had
With the expiration of two EZ incentives not been operational long enough for
since the prior LSA evaluation, there were a quantitative analysis to be conducted
three remaining active EZ incentives on EED effectiveness, suggestions for
to analyze this year. The employment future evaluation techniques and focus
expense income tax credit represents are discussed. The EZ property tax
October 2020 | Office of Fiscal and Management Analysis 1INTRODUCTION
investment deduction was expanded to caps reduce the value. The actual savings
also apply to businesses in the EEDs. Two from an abatement are reduced to the
new property tax deductions were also extent that a property receives a tax cap
created for use in the EEDs: the personal credit.
property minimum value exemption While the exact discount necessary to
and the vacant building abatement. influence a business’ decision to invest or
At this time, there is insufficient data to locate in a region is unknown, the value
analyze the effectiveness of these EED of abatement savings relative to the costs
incentives. of doing business and output for each
Property tax abatements were industrial sector provides insight on the
analyzed in the first review cycle in potential influence of abatements.
2017. That report showed that both the Comparing abatements against major
personal and real property abatements expenses shows that the value of an
represented a small savings for the typical abatement is somewhat low. The v alue
firm. The analysis conducted for this varies across sectors, which implies it
report continues to demonstrate that could be more influential to certain types
the attributes of Indiana’s property tax of industries. The general conclusion from
system also affect the value of abatements. long-standing and advancing research is
The scenarios show how a higher local that on average there may be a small, if
property tax rate makes the value of an any, effect of property tax abatements on
abatement increase, while property tax business location decisions.
INTRODUCTION
DE F I N I N G TA X I NC E N T I V E S , T H E R E V I E W PRO C E S S , A N D
P U R P O S E A N D A P P R OAC H
IC 2-5-3.2-1 defines a tax incentive as a benefit provided through
a state or local tax that is intended to alter, reward, or subsidize a
particular action or behavior by the tax incentive recipient, including
a tax incentive providing a benefit intended to encourage economic
development.
A
tax incentive includes an in an economic or sports development
exemption, deduction, credit, area, community revitalization area, an
preferential rate, or other tax enterprise zone, a tax increment financing
benefit that reduces a taxpayer’s state district, or a similar district.
or local tax liability or results in a tax
refund. A tax incentive, for the purposes Tax Incentive Review Process
of the evaluation, also includes a program IC 2-5-3.2-1 establishes an annual review,
where revenue is dedicated by a political analysis, and evaluation process for state
subdivision to pay for improvements and local tax incentives. Appendix B
October 2020 | Office of Fiscal and Management Analysis 2contains the text of IC 2-5-3.2-1. (2) is provided at a cost that can be
The review of Indiana tax incentives accommodated by the state’s biennial
is conducted by the Office of Fiscal budget, and (3) should be continued,
and Management Analysis, LSA. The amended, or repealed.
original staute required the evaluation
of each tax incentive at least one time Tax Incentive Review Purposes
during two consecutive five-year cycles. and Approaches
The first five-year review cycle began IC 2-5-3.2-1 specifies that the purpose
during the 2014 legislative interim and of the annual tax incentive review is to
was completed during the 2018 interim. (1) ensure tax incentives accomplish the
During the 2019 legislative session, the purpose for which they were enacted,
legislature extended the second tax (2) provide information to allow the
incentive review schedule from a five-year inclusion of the cost of tax incentives
cycle to a seven-year cycle. in the biennial budgeting process, and
The statute requires the LSA to (3) provide information needed by the
submit a report containing the results General Assembly to make policy choices
of the annual tax incentive review to the about the efficacy of tax incentives.
Legislative Council and the Interim Study IC 2-5-3.2-1 lists a variety of descriptive
Committee on Fiscal Policy. The report and analytical information that could
must be submitted before October 1 each accomplish tax incentive review goals.
year. The statute requires the Committee The information is as follows:
to hold at least one public hearing • The attributes and policy goals of the
between September 30 and November 1 at tax incentive.
which the LSA presents the report to the • The tax incentive’s equity, simplicity,
Committee. The Committee is required competitiveness, public purpose,
to submit any recommendations from adequacy, and conformance with the
information reported in the tax incentive purposes of the legislation enacting
review to the Legislative Council. The the incentive.
statute requires the General Assembly to • The activities the tax incentive
use the LSA’s report and the Committee’s is intended to promote and the
recommendations to determine whether effectiveness of the tax incentive in
or not a tax incentive (1) is successful, promoting those activities.
What is a tax incentive?
A tax incentive is a provision of Tax incentive programs also are of state tax incentive review
the tax code aimed at reducing not subject to the periodic scrutiny procedures. That assessment was
a taxpayer’s liability in order to that direct-spending programs based on three criteria: making
encourage certain behavior or to are subject to through the normal a plan, measuring impact, and
participate in targeted activities. budgetary process. informing policy choices. Research
Tax incentives are a significant The LSA produces an expenditure by PEW indicates that tax incentive
part of local tax laws, state tax report on November 1 of the first evaluations are more effective
codes, and the federal Internal year of the Indiana biennium when the analysis of incentives
Revenue Code. Tax incentives (https://iga.in.gov/legislative/2019/ is regularly and strategically
contrast with direct spending publications/tax_expenditure_ scheduled. The analyses of tax
programs. reports/#document-524f35ff). incentives should include clear
Tax incentive programs direct In 2017, The PEW Charitable policy relevant conclusions from an
public funding to certain purposes Trusts identified Indiana as one of impartial, nonpartisan perspective
by foregoing tax revenue. 10 “leading states” in an evaluation (PEW Charitable Trusts, 2017).
October 2020 | Office of Fiscal and Management Analysis 3• The number of taxpayers applying tax incentive review to the Legislative
for, qualifying for, or claiming the Council and the Interim Study Committee
tax incentive, and the tax incentive on Fiscal Policy. The report must be
amounts (in dollars) claimed by submitted before October 1 each year. The
taxpayers. report must include at least the following:
• The tax incentive amounts (in dollars)
claimed over time. • A detailed description of the review,
• The tax incentive amounts (in dollars) analysis, and evaluation for each tax
claimed by industry sector. incentive reviewed.
• The amount of income tax credits • Information to be used by the General
that could be carried forward for the Assembly to determine whether a
ensuing five-year period. reviewed tax incentive should be
• An estimate of the economic impact continued, modified, or terminated,
of the tax incentive, including a return the basis of the recommendation,
on investment calculation, cost benefit and the expected impact of the
analysis, and direct employment recommendation on the state’s
impact estimate. economy.
• The estimated state cost of • Information to be used by the General
administering the tax incentive. Assembly to better align a reviewed
• The methodology and assumptions of tax incentive with the original intent
the tax incentive review, analysis, and of the legislation that enacted the tax
evaluation. incentive.
• The estimated leakage of tax incentive
benefits out of Indiana. Tax Incentive Review Schedule
• Whether the tax incentive could A total of 62 tax incentives were evaluated
be made more effective through during the first five-year cycle (2014-
legislation changes. 2018). A total of 53 incentives are
• Whether measuring the economic scheduled for a second review over seven
impact of the tax incentive is limited years (2019-2025). The tax incentives
due to data constraints and whether reviewed in 2020 include the enterprise
legislative changes could facilitate data zone program, entrepreneurship and
collection and improve the review, enterprise district program, the tax
analysis, or evaluation. incentives related to those programs, and
• An estimate of the indirect economic property tax abatements. Table 1 specifies
activity stimulated by the tax incentive. the tax review schedule, and Appendix C
contains the descriptions of tax incentives
Tax Incentive Review Report and incentive programs on the review
IC 2-5-3.2-1 requires the LSA to submit a schedule.
report containing the results of the annual
October 2020 | Office of Fiscal and Management Analysis 4TABLE 1.
TA X I N C E N T I V E S A N D I N C E N T I V E P R O G R A M S
S C H E D U L E D F O R R E V I E W, 2 0 2 0 -2 0 2 5
Tax Tax Provision
2020
Corporate Income • Enterprise Zone Employee Deduction (I)
Tax (C)/ Individual • Enterprise Zone Employment Expense Credit (C)(I)
Income Tax (I)
• Enterprise Zone and Entrepreneur and Enterprise District
Investment Deduction
• Enterprise Zone Obsolescence Deduction
• Entrepreneur and Enterprise District Personal Property
Property Tax Minimum Value Exemption
• Entrepreneur and Enterprise District Vacant Building
Abatement
• Personal Property Abatements in an Economic
Revitalization Area
• Real Property Abatements in an Economic Revitalization Area
Other • Enterprise Zones
• Entrepreneur and Enterprise District Pilot Program
2021
Corporate Income
Tax (C)/ Individual • Community Revitalization Enhancement District Credit (C)(I)
Income Tax (I)
• Brownfield Revitalization Zone Deduction
Property Tax • Certified Technology Park Deduction
• Infrastructure Development Zone Deduction
• Low-Income Housing Deduction
Other • Certified Technology Parks
• Community Revitalization Enhancement District
2022
• Coal Gasification Technology Investment Credit (C)(I)
Corporate Income • Economic Development for a Growing Economy (EDGE)
Tax (C)/ Individual Credit (C)(I)
Income Tax (I) • Headquarters Relocation Credit (C)(I)
• Hoosier Business Investment Credit (C)(I)
2023
• Regional Development Authority Infrastructure Fund
Corporate Income Contribution Deduction (C)(I)
Tax (C)/ Individual • Patent-Derived Income Deduction (C)(I)
Income Tax (I) • Research Expense Credit (C)(I)
• Venture Capital Investment Credit (C)(I)
• Aircraft Parts Exemption
• Aviation Fuel Exemption
Sales Tax • Cargo Trailers/RVs Sold to Certain Nonresidents Exemption
• Certain Aircraft Exemption
• Research and Development Property
October 2020 | Office of Fiscal and Management Analysis 5Tax Tax Provision
2024
Corporate Income
Tax (C)/ Individual • Redevelopment Tax Credit (C)(I)
Income Tax (I)
Property Tax • Data Center Property Tax Exemption
• Resource Recovery System Deduction
Sales Tax • Certain Racing Equipment Exemption
• Data Center Equipment Exemption
• Professional Sports and Convention Development Areas
Other • Promotional Free-Play Deduction
• Motorsports Investment District
2025
• Adoption Tax Credit (I)
• Earned Income Tax Credit (I)
Corporate Income • Indiana 529 College Savings Account Contribution (I)
Tax (C)/ Individual • Indiana Colleges and Universities Contribution Credit (C)(I)
Income Tax (I) • Indiana Partnership Long-Term Care Insurance Premiums
Deduction (I)
• School Scholarship Contribution Credit (C)(I)
• Geothermal Energy Device Deduction
• Hydroelectric Power Device Deduction
Property Tax • Solar-Energy Heating or Cooling System Deduction
• Solar Power Device Deduction
• Wind-Powered Device Deduction
October 2020 | Office of Fiscal and Management Analysis 6ENTERPRISE ZONE PROGRAM
(IC 5-28-15)
ENTERPRISE ZONE PROGRAM
I C 5 -2 8 -15
Over the last 40 years, states and the federal government have adopted
various programs to stimulate economic activity in economically
distressed urban and rural locations. Enterprise zones have been
one of the most widely used programs toward the goal.
E
nterprise zones are designed the first to be designated were Evansville,
to stimulate business investment, Fort Wayne, Michigan City, Richmond,
growth, and job creation in and South Bend in 1984. Indiana law
communities where market forces sets out the criteria for an area to be
would not be able to achieve those designated as an EZ. Before being phased
objectives. Forty-five states and the out, an application by a municipality for
federal government have some version of designation as an EZ had to show the
an enterprise zone program. States began following:
enacting enterprise zones in the U.S. in
the early 1980s. This type of program is • At least 25% of the households in the
referred to by a variety of different names zone are below the poverty level.
including Enterprise Zones (Indiana), • The population of the area is more
Empowerment Zones (federal), Empire than 2,000 but less than 10,500 people.
Zones (New York), Renaissance Zones
(Michigan), or Economic Target Areas • The area is greater than 3/4 of a square
(Massachusetts). mile but less than four square miles.
In order to discourage businesses from • The area contains property suitable for
moving out of an area designated as an economic development.
enterprise zone or to encourage businesses
to locate or expand within the enterprise About 2,145 federal empowerment
zone, state and local units provide various zones were designated between the
incentives. Businesses within enterprise mid-1990s and 2010. Of those, 18%
zones often receive some combination were located in urban areas, 80% were
of tax incentives such as property tax located in rural areas, and 2% were not
abatements and income tax deductions classified in either category (HUD, 2018).
and credits for employment creation and Indiana EZs are mostly located in urban
capital investment. counties. For this analysis, U.S. census
Indiana’s Enterprise Zone (EZ) program data was used to determine the urban
was established in 1983 and allows EZs to share of county population. Counties
be located in municipalities or on closed with more than 75% of the population
military bases. Since the inception of the residing in urban areas were considered
program, 31 EZs have been designated in urban, counties with 40% to 75% of
Indiana. There are currently 18 active EZs; population in urban areas were classified
the other 13 EZs have expired. Among as an urban-rural mix, and counties with
October 2020 | Office of Fiscal and Management Analysis 7less than 40% of population in urban FIGURE 1.
areas were considered rural counties. Of L O C AT I O N A N D S TAT U S
the 31 EZs that have been approved in the O F E Z s B Y U R B A N -RU R A L
last four decades, 18 have been in urban COU N T I E S
counties, 11 in urban-rural mix counties
and only two in rural counties (Salem in
Washington County and Vermillion Rise
Mega Park in Vermillion County).
The average area of an EZ in Indiana is
approximately 3.2 square miles, and about
68% of EZs occupy areas smaller than this.
The largest EZs are Hammond at 6.38
square miles and River Ridge at 12.75
square miles. While the relatively large
EZs are concentrated in the northern and
southern parts of the state, the smaller
EZs, with areas of 2.7 square miles or
less, are generally located in the central
part of the state. Some of the largest EZs
(e.g., Michigan City, Hammond) were
also among the first to be designated in
1984 and 1985. However, none of those
EZs are geographically close to each other.
Similarly, several small EZs (e.g., Marion,
Bloomington) were designated in the early
1990s. None of those EZs are close to each
other, which seems to dispel the notion
of spillover (the concept that one area
SOURCE: Indiana Association of Enterprise
may adopt a program in response to its Zones, Indiana Department of State Revenue.
neighbor’s decision to adopt a program).
The designation of EZs appears to have that is established in an inactive or closed
been largely case-by-case considerations military base for not more than 10 years
by local units. subject to certain criteria. This qualified
Originally, an EZ was in effect for 10 four EZs that had expired or were going
years upon designation with the potential to sunset to receive extensions. Since
for two five-year renewals. A 2016 law the passage of this law, Vermillion Rise
allowed for a further extension of one Mega Park in Vermillion County and
year under certain stipulations. In 2019, River Ridge Development Authority in
the General Assembly provided that Clark County have received extensions to
the Indiana Economic Development continue the EZ program.
Corporation (IEDC) may renew an EZ
October 2020 | Office of Fiscal and Management Analysis 8TABLE 1.
E Z D E S I G N AT I O N S A N D E X P I R AT I O N S
Enterprize Zone EZ Designation Dates EZ Expiration Dates
Fort Wayne - Summit City EED* 1984 2022
Evansville 1984 2023
Michigan City 1984 2023
South Bend 1984 2023
Richmond 1984 2024
Hammond 1985 2024
Bloomington 1992 2023
Lafayette - X-District (EED)* 1993 2022
Bedford 1993 2023
Connersville 1995 2024
River Ridge Development Authority 1998 2023
Elkhart 1999 2024
New Albany 2000 2024
La Porte 2002 2021
Vincennes 2002 2022
Frankfort 2003 2022
Salem 2003 2022
Vermillion Rise Mega Park N/A 2027
Anderson 1984 Expired
East Chicago 1985 Expired
Gary 1985 Expired
Madison 1986 Expired
Indianapolis 1990 Expired
Kokomo 1990 Expired
Marion 1992 Expired
Terre Haute 1994 Expired
Grissom Airforce Base 1995 Expired
Fort Harrison Reuse 1997 Expired
Jeffersonville 2000 Expired
Mitchell 2001 Expired
Portage 2001 Expired
*The Fort Wayne and Lafayette EZ have transitioned into an entrepreneur and enterprise district
(EED).
SOURCE: Association of Indiana Enterprize Zones.
October 2020 | Office of Fiscal and Management Analysis 9Administration interest tax credit. IEDC annually received
Each EZ is coordinated and promoted by $200,000 to $300,000 in registration fees
an urban enterprise association (UEA) through the end of 2018. Starting in 2019,
comprised of 12 members, and two of the each zone business receiving incentives
members are appointed by the Governor. in excess of $1,000 per year must pay an
The executive of the municipality in which annual registration fee of 1% of its tax
the zone is located appoints five members- savings to the local UEA that administers
-two must be representatives of businesses the EZ.
located in the zone, and one must be All UEAs require zone businesses to
a resident of the zone. The legislative submit a percentage of their tax incentive
body of the municipality appoints the savings for their operations (although
remaining five members. Each member some UEAs have granted clemency for
of the UEA serves a four-year term. The certain businesses claiming only one
UEA in an EZ may adopt guidelines for incentive, for example). Fees range from
the disqualification of a zone business. 15% to 50% of a firm’s total tax savings, and
The UEA may also modify the boundaries a UEA is allowed to change its percentage
of the EZ. at any time. The local legislative body may
Beginning on January 1, 2019, pass an ordinance disqualifying a zone
administrative responsibilities for the business from eligibility for incentives
program were shifted from the IEDC to if the zone business does not assist the
the local enterprise zone associations. As UEA with the participation fees. Since
a result, zone businesses are no longer UEAs are 501(c)(3) organizations, they
required to file their annual Enterprise can apply for most types of grant funding
Zone Business Registration (EZB-R) with from local, state, or federal governments,
the IEDC. Each zone business must now community foundations, or private
file an annual registration with its UEA corporations. However, the majority of, or
to claim tax savings and stay in good in many cases, the entirety of the revenues
standing. A zone business must file its of most UEAs come from participation
EZB-R or Request for Extension (EZB-E) fees. These fees are used to fund the vast
with its local fiscal body by June 1 of each majority of UEA operations and their
year. programs, which provide intangible
Until calendar year 2019, a business benefits to the areas. The local UEAs use
located in an EZ also paid an annual their revenue for administrative costs and
registration fee equal to 1% of the community development projects such as
business’s total incentives exceeding infrastructure and utility construction,
$1,000. The fee only applied to incentives commercial building rehabilitation
associated with the EZ program: and improvements, and training and
enterprise zone investment deduction, educational programs.
employment expense tax credit, and loan
October 2020 | Office of Fiscal and Management Analysis 10TABLE 2.
T O TA L R E V E N U E S B Y S E L E C T U E A s , 2 017-2 0 2 0
2017-2018 2018-2019 2019-2020
Participation Participation Participation
UEA Fee % Fee % Fee %
Total of Total Total of Total Total of Total
Revenue Revenue Revenue Revenue Revenue Revenue
Bedford $77,331 100% $80,841 100% $130,767 100%
East
Chicago 230,367 77% 202,190 76% N/A N/A
Hammond N/A N/A 762,472 100% 491,057 100%
New Albany 96,200 100% 95,000 100% 122,000 100%
River
Ridge Dev
Authority 3,579,316 100% 4,385,870 100% 4,716,755 100%
South Bend 103,431 97% 63,518 93% 50,952 93%
Vincennes 84,339 96% 170,001 97% 132,000 100%
SOURCE: Indiana Urban Enterprise Associations.
NOTE: 2017-2018 data for Hammond is not available. East Chicago EZ expired in 2019.
Tax Incentives to Businesses available for employers that hire
and E mployees qualified employees. The credit is
Two state tax incentives and one local the lesser of 10% multiplied by the
property tax incentive are provided to qualified increased employment
encourage businesses to locate in a zone. expenditures of the taxpayer for the
Two additional income tax credits were taxable year, or $1,500 multiplied by
offered before their expiration on January the number of qualified employees
1, 2018. The state and local tax incentives employed by the taxpayer during the
that are available include: taxable year.
• Employee income tax deduction – An • Loan interest income tax credit (expired) –
income tax deduction is available for Prior to January 1, 2018, a taxpayer
qualified employees of an enterprise was entitled to an income tax credit
zone business. The qualified employee if the taxpayer received interest on
is entitled to a deduction from their a qualified loan in that taxable year.
adjusted gross income equal to the The amount of the credit to which
lesser of 50% of their adjusted gross the taxpayer was entitled was 5%
income for the taxable year that multiplied by the amount of interest
the employee earns as a qualified received during the taxable year
employee; or $7,500. from the qualified loans. The credit
can be carried forward for 10 years.
• Employment expense income tax Notwithstanding any other law, a
credit – An income tax credit is taxpayer is not entitled to receive an
October 2020 | Office of Fiscal and Management Analysis 11enterprise zone loan credit for interest property due to real and personal
received on a qualified loan made property investment by the business.
after December 31, 2017. However, The added valuation may be deducted
a taxpayer may continue to claim for up to 10 years.
a credit for interest on a qualified The three active incentives are further
loan made before January 1, 2018. In analyzed in this report.
addition, a taxpayer may carry an
unused tax credit attributable to a Although the employee income tax
qualified loan made before January deduction and investment cost tax credit
1, 2018, forward to a taxable year were designed to support the objectives
beginning after December 31, 2017, of the EZ program, these incentives are
and before January 1, 2028. not directly claimed by EZ businesses.
These two incentives are claimed by
• Investment cost income tax credit
individual taxpayers, and the UEA is
(expired) – Prior to January 1, 2018, a
not entitled to receive a percentage of the
taxpayer was permitted to make a
tax savings provided by those incentives.
qualified investment (the purchase of
Table 3 shows the three tax incentives
an ownership interest in a business
that are designed to directly support EZ
located in an EZ) and receive a tax
businesses. Each incentive is claimed
credit approved by the IEDC. The
by the business directly, and a portion
amount of the credit was a percentage
of the tax savings a business receives is
determined by the IEDC multiplied by
remitted as participation fees to the UEAs.
the price of the qualified investment
EZB-R filings by zone businesses provide
made by the taxpayer in the taxable
information on the incentives claimed
year. A taxpayer continues to be
as well as the investments made by those
entitled to receive a credit for a qualified
zone businesses.
investment made after December 31,
Table 3 shows the annual reported
2017, and before January 1, 2028, only
capital investment by businesses
if the qualified investment is approved
claiming incentives alongside the ratio
by the IEDC before January 1, 2018.
of tax incentives to capital investment.
A taxpayer may carry an unused
This ratio highlights how many dollars
tax credit attributable to a qualified
investment made before January 1, of investment occur for each dollar of
2018, or approved by the IEDC before incentive awarded; a lower percentage
January 1, 2018, forward in the manner indicates that fewer dollars of incentive
provided by IC 6-3.1-10-7. were awarded for each dollar of investment
made. While this relationship between
• Property tax investment deduction – A incentives and investments cannot
property tax deduction is available for reasonably be presented as causal, it still
the increased value of an EZ business illustrates the investment trends by EZ
businesses relative to incentives received.
October 2020 | Office of Fiscal and Management Analysis 12TABLE 3.
I N C E N T I V E S A N D C A P I TA L I N V E S T M E N T F O R E Z
B U S I N E S S E S , 2 0 0 6 T O 2 018
Total Tax Incentives
Investment Employment Loan Interest Capital as Share of Capital
Year Deduction Expense Credit Credit Investment Investment
2006 $3,023,962 $1,203,593 $123,666 $202,600,000 2.1%
2007 1,840,224 1,486,813 98,050 133,200,000 1.7%
2008 4,587,063 1,306,002 134,583 168,200,000 3.0%
2009 4,317,078 1,396,207 1,322,806 121,500,000 5.8%
2010 9,508,162 1,343,279 1,131,358 234,700,000 5.1%
2011 9,395,852 1,136,793 1,386,091 155,900,000 7.6%
2012 11,479,340 1,242,648 1,207,353 189,300,000 7.4%
2013 14,428,262 1,368,569 1,150,104 235,500,000 7.2%
2014 18,499,966 1,552,828 1,297,263 247,200,000 8.6%
2015 18,563,708 1,575,961 1,317,925 251,300,000 8.5%
2016 16,812,354 1,284,273 1,096,913 153,300,000 12.5%
2017 17,016,924 1,292,475 1,127,188 170,700,000 11.4%
2018 20,325,152 1,201,945 1,355,156 230,200,000 9.9%
SOURCE: Raw data provided by Indiana Economic Development Corporation, data analysis by the
Office of Fiscal and Management Analysis.
NOTE: The figures reported in this table are derived from the EZB-R forms filed by the businesses vs.
the data presented in each incentive analysis that are derived from OFMA’s income tax and property
tax databases.
Enterprise Zone EZ contains the largest number of
E stablishments establishments at above 400, and some
Data on Indiana business establishments, zones with the fewest businesses are
provided by Department of Workforce located in Connersville, Bedford, and
Development Unemployment Insurance Salem.
Tax Administrative Records, were Figure 2 shows the percentage of EZ
geocoded by LSA by their geographical establishments by industry. Real estate,
coordinates and physical addresses and technical services, and management of
matched to EZ shape files in order to companies (NAICS codes 53-55) make up
identify those establishments located the largest percentage of zone businesses,
within EZs. Based on recently available followed by retail trade (NAICS codes
quarterly employer reports filed during 44-45).
2018, approximately 5,600 establishments Approximately 4% to 5% of all
were located within the EZs active in 2018. businesses in an EZ claim tax incentives
As the EZs are restricted in size and scope, annually based on historical EZB-R
this represents approximately 3.3% of filings. The vast majority of EZ tax
businesses in the state. The Bloomington incentive dollars tend to be claimed by
October 2020 | Office of Fiscal and Management Analysis 13manufacturing firms (NAICS codes 31-33; see Figure 3 for an industry-level
breakdown of EZ incentive claims). Despite their high level of incentives received,
manufacturing firms only make up about 9% of all zone establishments. However,
these firms also tend to employ about three times as many workers as other industries.
FIGURE 2.
PERCENTAGE OF EZ ESTABLISHMENTS BY INDUSTRY, 2018
SOURCE: Raw data provided by Quarterly Census of Employment and Wages and IEDC, data analysis
by the Office of Fiscal and Management Analysis.
FIGURE 3.
SHARE OF EZ TAX INCENTIVES BY INDUSTRY SECTOR, 2012 - 2018
SOURCE: Raw data provided by Quarterly Census of Employment and Wages and IEDC, data analysis
by the Office of Fiscal and Management Analysis.
October 2020 | Office of Fiscal and Management Analysis 14Effectiveness of the Program: receive tax incentives, and firms that
Literature Review receive much more in tax incentives do
There is an enormous body of research not invest any differently than firms that
that has been conducted on the design and receive smaller amounts. Finally, while
impacts of EZs going back to the 1980s. GAV increases for firms receiving $20,000
However, the findings across different compared to $10,000, this effect starts
academic works vary, providing little declining for firms receiving $30,000.
consensus on the overall effectiveness of This means that the property values of
EZs. Many researchers have found that firms receiving a greater amount in tax
EZs have not been successful at increasing incentives do not fare any better than
employment for workers who live in the firms receiving very little.
zones (Elvery, 2009; Greenbaum and While this model provides insight into
Landers, 2009; Peters and Fisher, 2002). the detailed impacts of the incentives in
At the same time, other scholarly works Indiana, the long duration of the EZs
have identified positive impacts from EZs suggests a broader approach may be
that suggest Enterprise Zone designation necessary in LSA’s second review. Recent
results in increased resident employment scholarly work has analyzed individual
(Freedman, 2012; O’Keefe, 2004), and programs and existing EZ studies to
that it also generates wage increases for find where commonality exists and to
workers from zone neighborhoods (Busso determine what conclusions can be drawn
et al., 2013). on the macro level. Hanson and Rohlin
LSA constructed an econometric (2017) look at the federal empowerment
model to analyze the impacts of EZs on zone program and use several different
employment and wages in its 2016 Indiana analytical methods to see how results
Tax Incentive Evaluation. Looking at the vary by the technique used. Their results
positive results of the analysis, LSA found show common findings across methods
that on average, employment tends to rise related to short-term increases in the
for firms receiving less than $20,000 in number of firms in targeted areas, but
tax incentives, and that firms with fewer longer-term results were inconsistent. The
than 50 employees receiving less than authors caution that no single evaluation
$100,000 tend to create jobs. LSA also method should be considered definitive
found that capital investment by firms when looking at EZ impacts, and often the
is positively related to tax incentives effect of EZ programs on factors such as
received, and that firms that receive employment or wages remains uncertain.
$20,000 tend to experience a 68% higher Hooten and Tyler (2018) examined
gross assessed value (GAV) than firms selected cities participating in the federal
that receive $10,000. However, LSA also empowerment zone program. Their
concluded that on average, employment research suggests that it is possible that an
tends to decline for firms receiving more EZ program can have an impact, but that
than $20,000, and employment tends it might only be able to mitigate decline or
to decline for firms with fewer than 50 accelerate growth in an area. Ultimately,
employees receiving more than $100,000. the authors find that having an EZ may
Additionally, wages did not increase at not be enough to actually reverse the trend
the same pace as the rate at which firms for a distressed area. If the trajectory of a
October 2020 | Office of Fiscal and Management Analysis 15region is independent of the presence relationships in their model with the
of an EZ, it could contribute to why the trends actually present in Indiana
conclusions of different EZ analyses vary. EZs. Next, the analysis undertakes an
Using a more conceptual approach, examination of employment and wage
Chaudhary and Potter (2019) present a trends in EZs by industrial sector, in light
theoretical framework for EZ evaluation. of incentives awarded and goals of the
Their framework provides potential EZs. Finally, looking at trends in property
mediating influences on the EZ’s goal values for certain EZ properties can help
of increasing employment and property determine some of the lasting impacts of
demand. It includes looking at the ratio EZ designations in an area.
of capital subsidies to employment In line with Chaudhary and Potter’s
subsidies and the distribution of profit (2019) theoretical framework for EZ
versus investment, among others. It also evaluation, LSA examines the ratio
outlines some potential explanations of employment subsidies to capital
for the differing findings among EZ subsidies. Their framework suggests that
evaluations such as how new jobs might if capital subsidies are large compared
not be filled by the targeted unemployed, with employment subsidies, then labor
and how wage growth might adversely demand growth could be counterbalanced
affect employment growth. This approach by capital–labor substitution. Capital
provides alternatives to often narrow- subsides may increase capital investment
focused research designs used to analyze but also could decrease the need for
EZs. The framework proposed allows additional employees. They see this
for a richer analysis of the relationship as likely being a more pronounced
between wages, employment, and other problem in manufacturing dominated
factors in EZs. zones since substitution may be easier in
manufacturing jobs than service jobs.
Analysis To look at this relationship in Indiana
While LSA’s previous research already EZs, LSA compares the amount of
provided the estimated impacts of employment expense credit awarded
incentives on certain target metrics, to the amount of investment deduction
this second review of the EZ program awarded in each zone. Figure 4 displays
lends itself to aggregate trends and new this ratio for each EZ, illustrating the
perspectives derived from the trends. percent of incentive dollars coming
First, LSA draws upon Chaudhary and from each of the sources. A preliminary
Potter’s (2019) theoretical framework inspection reveals investment deduction
and connectors between the EZ program dollars tend to make up a much larger
and employment outcomes as a way of share of the overall incentive dollars
interpreting relationships in the data in most EZs. With the large amount
and providing more tangible context for of manufacturing in Indiana EZs, this
the outcomes seen in the analysis. Their warrants evaluating Chaudhary and
report offers multiple angles from which Potter’s (2019) proposition of capital
to examine the trends in the data, and substituting for employment.
LSA can compare some of the predicted To evaluate this claim, the selected
October 2020 | Office of Fiscal and Management Analysis 16FIGURE 4.
SH A R E OF EZ I NCEN TI V E DOLL A R S BY I NCEN T I V E T Y PE
SOURCE: Raw data provided by Indiana Economic Development Corporation, data analysis by Office
of Fiscal and Management Analysis.
EZs in Figure 4 were categorized as Indiana EZs, LSA studied the trends in
either high investment deduction zones employment and wages over several years.
(with investment deduction incentives Figures 5 and 6 illustrate the annual
comprising 80% or more of total percent change in employment and wages
incentive dollars), or mixed incentive in the EZs and statewide, respectively.
zones (with investment deduction Values plotted above 0% represent
incentives comprising less than 80% of growth in wages or employment, and
total incentive dollars). For both groups values plotted below 0% indicate decline
of EZs, the average employment from in wages or employment for that year;
2012 to 2019 decreased by approximately a value of 0% in a given year indicates
2.0%. With no major difference in no change from the previous year.
employment trends across the two groups, If wage growth has a limiting effect
it can be inferred that capital investments on employment growth in the EZs,
were not a substitute for employment. LSA would expect to see the trends for
The relationship between wage growth employment and wages in Figure 5 to
and employment growth in EZs is be inverse of one another; specifically,
another comparison of interest put forth when average wage is growing (above
by Chaudhary and Potter (2019). They the 0% line), employment would
assume wage growth might also reduce decline (below the 0% line). Further,
employment growth, particularly in LSA might also observe a consistent
places and periods of constrained labor percentage of decline in employment
supply. To examine this relationship in for each percentage increase in wages.
October 2020 | Office of Fiscal and Management Analysis 17FIGURE 5. FIGURE 6.
P E RC E N T C H A N G E I N E Z P E RC E N T C H A N G E I N S TAT E
E M P L OY M E N T A N D WAG E S , 2 01 2-2 019 E M P L OY M E N T A N D WAG E S , 2 01 2-2 019
SOURCE: Raw data provided by Bureau of Labor Statistics’ Quarterly Census of Employment and Wages (QCEW),
data analysis by the Office of Fiscal and Management Analysis.
The trends for employment and wages EZs represent such a small percentage
do appear to largely satisfy the first criteria of statewide jobs that any volatility in
of being inverse, with the exception of wages or employment will be more visible.
similar values in 2014 and 2017. However, Another way to analyze EZs is by
there is little evidence in proportionality looking at employment and wage trends
in the magnitude of changes across all by industrial sector. Statewide and EZ
of the years. Taken together, the data employment track relatively well in
is inconclusive on whether there is most industry sectors. Manufacturing
a tradeoff between wage growth and comprises a larger portion of EZ
employment growth. The analysis of employment than its overall share
EZ trends do not provide clear answers statewide. Public administration is
on the relationship between the two also more prominent in the EZs, while
measures, but comparing those trends to educational services, healthcare, and
the same values statewide does provide retail trade are all underrepresented in
additional insight. The graphs show both EZs compared to the rest of the state.
the magnitude and the direction of the At the individual EZ level (not
change. In times of growth, the measure shown here), some of the zones with
will be positive; in times of decline, the the largest share of manufacturing jobs
measure will be negative. Between 2012 are Indianapolis, East Chicago, and
and 2019, statewide wages maintained a Fort Wayne. The next largest sector,
low but consistent level of growth, and education services and healthcare, were
employment statewide experienced most prominent in Evansville, South
growth, with the exception of a minimal Bend, Bloomington, and Jeffersonville.
decline in 2017. EZ employment has been Portage stands out for its large share of
stagnant or in decline since 2014, even as mining, utilities, and construction, and
EZ wages have maintained growth in most Michigan City has by far the largest
years. This implies more employment share of entertainment and food service
volatility in EZs than statewide. However, employment.
October 2020 | Office of Fiscal and Management Analysis 18FIGURE 7.
E M PL OY M E N T BY NA IC S S E C T OR , S TAT E W I DE A N D I N E Z s
SOURCE: Raw data provided by Bureau of Labor Statistics’ Quarterly Census of Employment and
Wages (QCEW) , data analysis by the Office of Fiscal and Management Analysis.
State and EZ wages mirror each program participants in a majority of
other similarly, as wages are roughly the zones experienced increases in both
proportional to sector employment. personal property GAV and real property
However, while manufacturing makes GAV. The median personal property
up just over one quarter of EZ jobs, it GAV change was an increase of about
translates to over 40% of total EZ wages. 41.0%, and the median real property GAV
Retail trade, entertainment, and food change was an increase of roughly 20.1%.
services encompass a lower percentage The value of personal property
of wages relative to their share of total generally depreciates over time, while
employment in the EZs. While this data real property values generally appreciate
shows a large share of employment and over time. Without any additional
wages going to manufacturing businesses, investment, LSA would expect to see
it is still not sufficient to say the large declining personal property values and
amount of incentive dollars claimed by that increasing real property values. Thus, a
industry has resulted in these employment decline in personal property AV for EZ
outcomes. However, it does reflect the claimants in a zone does not necessarily
original EZ emphasis on manufacturing. mean that there is a decline in activity
LSA can also look at trends in GAV in the zone. An increase in personal
for real and personal property among property AV and a more than nominal
businesses claiming the EZ investment increase in real property AV indicate
deduction. Between 2012 and 2020, continued investment by EZ claimants.
October 2020 | Office of Fiscal and Management Analysis 19FIGURE 8.
WAG E S BY NA IC S S E C T OR , S TAT E W I DE A N D I N E Z s
SOURCE: Raw data provided by Bureau of Labor Statistics’ Quarterly Census of Employment and
Wages (QCEW) , data analysis by the Office of Fiscal and Management Analysis.
An important consideration when zones could be related to several factors
evaluating this information is that the independent of the incentive’s impacts.
population for this data is businesses The results from the second evaluation of
in the EZs that claimed the investment the EZ program in Indiana are supported
deduction at least once in the nine-year by much of the new literature discussed,
window. As a result, there could be as well as LSA’s prior causal model.
establishments that claimed the deduction Looking at the data with a longer view
only one year during this period, and and parsing it from multiple perspectives
some businesses may have moved into allows for a thorough understanding of
the EZ in the time window. Further, when what economic changes occurred. While
reflecting on Hooten and Tyler’s (2018) this approach makes it difficult to draw
findings, it is possible that these property any additional causal conclusions about
value trends reflect the trajectory the the impact of the program’s tax incentives
area was already on, independent of its on metrics such as employment and
designation as an EZ. Following from wages, an abundance of new literature
their research in that scenario, it is also suggests that researchers should
possible the GAV growth seen in both be wary of trying to make such claims
categories was amplified by the EZ, and from a single analysis. A broader and
the rate of decline in some of the other more inclusive approach of evaluating
areas was potentially mitigated or slowed the EZ program provides a nuanced
by being part of an EZ. With that in look at the outcomes occurring in EZs.
mind, the values for GAV seen in the
October 2020 | Office of Fiscal and Management Analysis 20ENTERPRISE ZONE EMPLOYMENT
EXPENSE CREDIT (IC 6-3-3-10)
ENTERPRISE ZONE EMPLOYMENT EXPENSE
CREDIT
I C 6 -3 -3 -10
The enterprise zone employment expense credit was established in
conjunction with the EZ program in 1983 to encourage businesses
to hire qualified employees in EZs.
T
he credit equals the lesser of the base wages for pass-through entities
10% of the qualified increase in wages are always zero regardless of the year the
paid to employees of an EZ business, business began operations.
or $1,500 per qualified employee. For a The credit may be used to offset
person to qualify as an eligible employee, individual AGI, corporate AGI, insurance
they must live in an EZ and work at least premiums, and financial institutions tax
50% of the time in an EZ. liabilities. Statute requires the taxpayer to
The qualified increase in wages is offset the taxes in the order listed above.
computed by taking the difference The credit is nonrefundable. However, the
between the wages paid in the taxable credit may be either carried forward for
year and the base period wages. The ten years or back for three years preceding
base period wages equal the wages the the year the credit was awarded.
business paid in the year before the EZ A zone business must also pay a
was established. If the business was not registration fee and a participation fee
operating before the EZ was designated, to the local urban enterprise association
the base wages equal zero. In addition, based on a percentage of its tax savings.
TABLE 1.
E Z E M P L OY M E N T E X P E N S E C R E D I T C L A I M S
H I S T O R Y, 2 010 -2 017
Claims Credits
Tax Year
Individual Corporation Total Individual Corporation Total
2010 250 40 290 $619,377 $805,662 $1,425,039
2011 196 32 228 609,083 590,936 1,200,019
2012 229 32 261 632,170 931,466 1,563,636
2013 242 20 262 778,167 493,387 1,271,554
2014 230 22 252 761,755 446,244 1,207,999
2015 222 35 257 674,671 509,309 1,183,980
2016 197 19 216 719,980 564,293 1,284,273
2017 214 32 246 635,327 336,034 971,361
SOURCE: Raw data provided by the Department of State Revenue, data analysis by the Office of Fiscal
and Management Analysis.
October 2020 | Office of Fiscal and Management Analysis 21ENTERPRI SE ZONE EMPLOY EE
INCOME DEDUCTION (IC 6-3-2-8)
The number of individual claims has approximately $14 in reported capital
remained fairly steady over time, while investment; by 2018, every dollar of tax
the number of corporate claims has savings corresponded to approximately
fluctuated but declined. With respect $26 of capital investment. Thus, despite
to all tax incentives claimed by zone the declining tax savings impact of the
businesses, this credit represents a small credit, EZ businesses claiming the credit
and declining portion. As zone businesses are investing at higher levels relative to
are required to reinvest their tax savings their incentives received.
into their business, it is clear that much of Based on historical EZB-R filings from
the reinvestment must be from incentives 2012 to 2018, the average EZ business that
other than the employment expense credit. claimed the employment expense credit
Tax filings by zone businesses to the IEDC employed approximately 91 employees
(referred to as EZ business registration, annually at an average wage of $41,127
or EZB-R), provide information on the and claimed an average of $12,687 in
incentives claimed and the investments credits. The average zone business that did
made by those zone businesses. In 2012, not claim the employment expense credit
for every dollar in tax savings awarded to employed approximately 37 employees
businesses claiming this credit, there was annually at an average wage of $47,986.
ENTERPRISE ZONE EMPLOYEE INCOME
DEDUCTION
I C 6 -3 -2 - 8
The EZ employee income deduction was established to encourage
individuals to live and work within an EZ. To qualify for the
deduction, the individual must live in an EZ and must perform 50%
of their work at an establishment in the same EZ.
T
he employer can be a private qualifies for the deduction if they:
firm, nonprofit entity, state or
local government, or the federal 1. Have a principal residence in the EZ
government. The deduction equals the where they are employed.
lesser of 50% of the employee’s earned 2. Perform services for the employer,
income for the taxable year, or $7,500. 90% of which are directly related to
Married couples may each take the the conduct of the employer’s business
deduction if both individuals qualify. activities in the zone.
The combined maximum deduction for 3. Perform services for the employer for
married filers is $15,000. at least 50% of the taxable year in the
Taxpayers receive an IT-40QEC from EZ.
their employer if they are eligible to claim 4. Are employed by a business that
the deduction. An IT-40QEC shows the remains eligible to receive benefits
amount of money a person earned from and incentives as provided by EZ
a business operating in an EZ. A person legislation.
October 2020 | Office of Fiscal and Management Analysis 22TABLE 1.
E Z E M P L OY E E I N C O M E D E D U C T I O N C L A I M S
H I S T O R Y, 2 010 -2 017
Tax Year Claims Deduction Tax Impact
2010 3,778 $24,845,773 $844,756
2011 3,711 24,219,058 823,448
2012 3,555 23,598,697 802,356
2013 3,572 23,801,196 809,241
2014 3,740 24,968,346 823,955
2015 3,694 24,530,999 809,523
2016 3,466 22,988,947 758,635
2017 3,361 22,651,090 724,835
SOURCE: Raw data provided by the Department of State Revenue, data analysis by the Office of Fiscal
and Management Analysis.
Table 1 shows the tax deduction claims change in trend from the prior evaluation
have remained relatively low but stable, that examined these same metrics from
until declining in 2016 and again in 2000 to 2013. In that prior analysis, there
2017. There could be factors driving the were twice as many one-time claimants,
stable but lower number of claims. One, and taxpayers claiming the deduction
residents of zones may not be aware of more than four times represented a much
the deduction. Two, the same residents smaller share of the total claimants.
may be claiming the deduction year after Unfortunately, the data does not tell us
year. Three, some residents claiming the why they stopped claiming the deduction.
deduction may move out of the zone, Nevertheless, this is not reflective of the
thereby no longer qualifying for the tax employment trends in all EZs. This is a
incentive. reflection on the number of people who
Another way to examine the number both live and work within EZs.
of taxpayers claiming this deduction is
to look at the share of taxpayers claiming FIGURE 1.
F R E Q U E N C Y O F S A M E T A X PAY E R
the deduction in only one tax year versus C L A I M I NG E Z E M PL OY E E
those who claim the deduction over D E D U C T I O N , 2 0 1 0 -2 0 17
many tax years. This provides insight for
the retention of employees who both live
and work in EZs. Based on individual tax
returns from 2010 to 2017, approximately
17% of the taxpayers claimed the
deduction only once (see Figure 1).
More than half (63%) of these taxpayers
claimed the deduction less than six times,
and almost 20% of taxpayers were repeat
SOURCE: Raw data provided by the Department of State Revenue,
claimants in all eight years. This reflects a data analysis by the Office of Fiscal and Management Analysis.
October 2020 | Office of Fiscal and Management Analysis 23You can also read


