New Zealand Energy Scenarios - TIMES-NZ 2.0 A guide to understanding the TIMES-NZ 2.0 model - EECA
←
→
Page content transcription
If your browser does not render page correctly, please read the page content below
New Zealand
Energy Scenarios
TIMES-NZ 2.0
A guide to understanding the TIMES-NZ 2.0 model
Authors
Dr Silvina Pugliese, Chiraag Ishwar, Vincent Smart, Kate Kolich, Michael Henry, Dr Gareth Gretton,
Andrew Greed, Anand Krishnan, Dr Marcos Pelenur

Citation
Energy Efficiency and Conservation Authority 2021
New Zealand Energy Scenarios TIMES-NZ 2.0 - A guide to understanding the TIMES-NZ 2.0 model
Wellington, New Zealand
ISBN: 978-1-99-115220-6
Published in May 2021 by
Energy Efficiency and Conservation Authority (EECA)
Wellington, New Zealand

Creative Commons Licence

This work is licensed under the Creative Commons Attribution 4.0 International licence. In essence, you
are free to copy, distribute and adapt the work, as long as you attribute the work to the Crown and abide
by the other licence terms. Use the wording ‘Energy Efficiency & Conservation Authority’ or ‘EECA’ in your
attribution, not the EECA Logo.
To view a copy of this licence, visit Creative Commons — Attribution 4.0 International — CC BY 4.0

Liability
While all care and diligence has been used in processing, analysing and extracting data and information in this
publication, the Energy, Efficiency & Conservation Authority gives no warranty it is error free and will not be
liable for any loss or damage suffered by the use directly, or indirectly, of the information in this publication.
Contents
FOREWORD                                                                1

ACKNOWLEDGEMENTS                                                        6
TIMES-NZ 2.0 Project Team Members                                       7

TIMES-NZ 2.0 Assumptions Working Group                                  7

ACRONYMS                                                                8

INTRODUCTION                                                            10
1.1 Energy and the climate change challenge                             11

1.2 TIMES-NZ 2.0 project background                                     11

1.3 Document overview                                                   12

TIMES-NZ 2.0 MODEL OVERVIEW                                             13
2. TIMES-NZ 2.0 model overview                                          14

2.1 TIMES-NZ 2.0 scenario definitions                                   15

2.2 TIMES-NZ 2.0 model structure                                        16

KEY INSIGHTS - NEW ZEALAND ENERGY SCENARIOS TIMES-NZ 2.0                18
3. Key Insights - New Zealand Energy Scenarios TIMES-NZ 2.0             19

3.1 Energy emissions decline strongly in both scenarios                 19

3.2 Demand for fossil fuels decreases significantly in both scenarios   21

3.3 Road transport becomes almost entirely fossil-fuel free             22

3.4 Transport emissions                                                 23

3.5 Industrial emissions                                                24

3.6 Both scenarios reduce overall usage of gas                          25

3.7 Energy efficiency plays a key role in decarbonisation               26

3.8 Major increases in electricity demand and electrification           27

3.9 Demand for wood fuel doubles                                        29

3.10 Storage plays a key role in the electricity system                 30
3.11 Hydrogen plays a role in agricultural niches under both scenarios            31

3.12 Wood and electricity displace coal                                           32

3.13 Biofuels play a relatively modest role                                       32

3.14 Electricity prices                                                           33

3.15 New technology and innovation will be needed to address residual emissions   33

3.16 Solar plays a role, mostly in grid-scale form                                33

MACRO-ECONOMIC ASSUMPTIONS                                                        34
4. Assumptions - New Zealand Energy Scenarios TIMES-NZ 2.0                        35

4.1 Gross Domestic Product (GDP)                                                  35

4.2 Population                                                                    36

4.3 Number of households                                                          37

4.4 Carbon price                                                                  37

4.5 Discount rate                                                                 37

4.6 Energy service demand projections                                             37

PRIMARY ENERGY RESOURCES                                                          39
5. Primary energy resources                                                       40

5.1 Coal                                                                          40

5.2 Oil		                                                                         40

5.3 Natural gas                                                                   41

5.4 Renewables                                                                    41

FUEL PRODUCTION                                                                   42
6. Fuel production                                                                43

6.1 Hydrogen                                                                      43

6.2 Bioenergy                                                                     46

6.3 Oil refining                                                                  47
ELECTRICITY GENERATION                                      48
7. Electricity generation                                   49

7.1 Existing technologies                                   49

7.2 Winter energy and capacity margins                      49

7.3 Technology capacity constraint assumptions              49

7.4 Future technologies                                     49

FUEL DISTRIBUTION                                           53
8. Fuel distribution                                        54

8.1 Fuel distribution costs                                 54

ENERGY DEMAND SECTORS                                       55
9. Energy demand sectors                                    56

9.1 Residential sector                                      57

9.2 Commercial sector                                       59

9.3 Industrial sector                                       61

9.4 Transport sector                                        65

9.5 Agriculture, Forestry and Fishing                       68

NEW ZEALAND ENERGY SCENARIOS TIMES-NZ 2.0 APP               72
10.1 New Zealand Energy Scenarios TIMES-NZ 2.0 app          73

10.2 New Zealand Energy Scenarios TIMES-NZ 2.0 User Guide   74

APPENDICES                                                  79
Appendix 1: Main data sources                               80

Appendix 2: Electricity generation                          83

References                                                  84
Foreword
Foreword

I am very happy to see New Zealand build, develop and use the TIMES-NZ 2.0 model to
explore future energy system scenarios to usefully inform policy decisions on energy
and climate action. I congratulate the Energy Efficiency and Conservation Authority,
BusinessNZ Energy Council and The Paul Scherrer Institut for their important collaborative
efforts in bringing this to fruition.
The TIMES-NZ 2.0 model draws on, and contributes to, a long legacy of international
collaboration over the past 45 years. The Energy Technology Systems Analysis Programme
(ETSAP) is part of the Technology Collaboration Programme initiated under the auspices
of the International Energy Agency. This programme supports the work of independent,
international groups of experts, enabling governments and industries from around the
world to lead programmes and projects on a wide range of energy technologies and related
issues. ETSAP was one of the first of these collaborations and has been working on energy
systems modelling tools since the mid 1970s, building and improving the TIMES modelling
tools, providing training and supporting TIMES modelling teams around the world to
develop future energy scenarios to underpin evidence based policy decisions.
ETSAP is delighted that New Zealand has joined our international collaboration and
looks forward very much to a strong and deep partnership building on methodological
developments and robust scenario analysis such as presented in this report.

Professor Brian Ó Gallachóir
Chair
International Energy Agency - Energy Technology Systems Analysis Program TCP

                                                  2
Foreword
Climate change is one of the most urgent issues of our time. Almost 41% of New Zealand’s
total greenhouse gas emissions come from energy use and the challenge is to get this
number down. The climate emergency means that decisions need to be made now across
all sectors, if we are to have any chance of avoiding the worst effects of climate change.
This is where a modelling tool such as TIMES-NZ can help explore carbon reduction
scenarios across sectors.
EECA, in partnership with the BusinessNZ Energy Council and Paul Scherrer Institut
(Switzerland), is delighted to have played a key role in developing phase two of the TIMES-
NZ New Zealand Energy Scenarios. TIMES-NZ 2.0 is based on the International Energy
Agency (IEA) Energy Transition Systems Analysis Program methodology which is one of the
IEA’s longest running technology collaboration programmes. Throughout this project it has
been invaluable to draw on international best practice and blend it with local knowledge
about New Zealand energy needs across sectors.
The original BEC2060 model was based on the IEA ETSAP Technology Collaboration
Partnership TIMES model - this update includes further New Zealand specific detail
about the renewable energy options, energy needs and associated emissions across the
following sectors: - Transport; Heat, Industry, Power; Agriculture, Forestry and Fishing;
Commercial and Residential. Modelling is based on input from experts across both
government and industry.
Developing the TIMES-NZ 2.0 update aligns with EECA’s strategy of mobilising New
Zealanders to be world leaders in clean and clever energy use by reducing carbon
emissions in business, transport, and housing. EECA focuses on enabling a low-carbon
future by improving New Zealand’s energy efficiency and increasing its use of renewable
energy. TIMES-NZ 2.0 is a useful tool to understand cost effective ways of achieving
emissions reduction across sectors, as it combines global best practice with local insights.
EECA is pleased to have delivered the TIMES-NZ 2.0 model updates and make the findings
from the New Zealand Energy Scenarios TIMES-NZ 2.0 accessible as an online interactive
R Shiny app www.eeca.govt.nz/times-nz with downloadable open datasets, to enable a
continued focus on identifying ways for government, industry and communities to embrace
a low carbon future.
Kate Kolich
Manager
Evidence, Insights and Innovation
3Foreword
How do you tell the story of the future? What if most Kiwis chose to see climate change
as the most important problem to solve? What would happen if they invested now in new
technologies and led the world in decarbonising the economy? How would New Zealand’s
energy sector evolve? What are the choices and trade-offs?
In a year like no other, we have witnessed first-hand challenges and opportunities in the
energy sector. Our energy scenarios have become more important than ever, equipping
energy leaders with a powerful tool in preparing for the unpredictable and supporting
decision-making in a time of uncertainty.
While most modelling arrives at a destination by indicating what needs to change to get there,
our scenarios explore the ‘what-if stories’ rather than the ‘what-musts’. Our internationally
renowned, New Zealand-specific modelling paints a rich picture of both potential and plausible
energy system futures. Using an explorative, scenario-based analysis, we can provide a more
open-ended view of what New Zealand’s future energy mix might look like.
This time round, we are proud to be working with EECA, an organisation that has brought a
wealth of knowledge and insight to the table. Together, BEC and EECA will be the preeminent
source of up-to-date hard data on our energy future. Once again, we have used Kea and Tūī,
both iconic New Zealand birds, matching our scenarios to their characteristics.
It is clear New Zealand, like the rest of the world, faces rapidly changing patterns of
energy use, emerging disruptive technologies and the challenge of living affordably and
sustainably.
Our modelling presents two contrasting stories New Zealand could follow, depending on
how fast the country moves toward decarbonising the economy.
The Kea story represents a future where climate change is the most pressing issue. Kiwis
want to get ahead of the rest of the world and the government transforms the economy
quickly to match. The carbon price is higher than the global price; governments make it
easier for consumers to take up new energy technologies; business aggressively trials and
invests in more energy-efficient solutions, and buses, light rail and other forms of public
transport are preferred.
By contrast, under Tūī, economic growth is not constrained by efforts to decarbonise and
Kiwis are willing to follow other countries in using market mechanisms. Carbon prices are
lower than the global price; the government’s light hand means new energy technologies
are adopted when they become price competitive; business favours the lowest-cost energy
sources and private car ownership dominates the passenger fleet.
We trust our scenario refresh will help you plan for an uncertain future.
Tina Schirr
Executive Director
4Foreword
With the enhanced energy system model for New Zealand, as performed in this second
model development phase of TIMES-NZ, the future challenges for the transformation of
the energy sector can be now analysed in greater detail.
This development builds on the fruitful collaboration of the experts of EECA, BEC and
energy system modellers of the Energy Economics team of the Paul Scherrer Institut (PSI)
in Switzerland.
It was a great pleasure and experience for the PSI team to work on this joint project with
EECA. While the PSI team has many years of experience in TIMES-based energy systems
modelling, it was the close interaction with the EECA team and other collaborators in New
Zealand which allowed us to include a rich set of detailed technical and economic data
in TIMES-NZ 2.0 and makes the model a unique analysis tool for New Zealand. This has
been demonstrated with the current scenarios and will hopefully continue with versatile
applications of the model in future.
Dr Tom Kober
Group Lead
Energy Economics Group of the Laboratory for Energy Systems Analysis
5Acknowledgements
Acknowledgements

TIMES-NZ 2.0 has been a joint effort from across government and industry with the main TIMES-NZ project
team comprised of members of EECA, BEC and PSI.

TIMES-NZ 2.0 Project Team Members
EECA: Chiraag Ishwar, Vincent Smart, Dr Silvina Pugliese, Andrew Greed, Anand Krishnan, Michael Henry,
Kate Kolich, Dr Gareth Gretton, Vij Kooyela, John Duncan, Harry Gates, Matthew Hammond-Blain,
Dr Marcos Pelenur for their work on delivering the TIMES-NZ 2.0 updates including creating the data
structure, data inputs, modelling, analysis and TIMES-NZ 2.0 scenario outputs. Alan Hsieh, Penny St. John,
Carolyn Small for their work on digital communication design.
BEC: Hon David Caygill, Tina Schirr, Emily Calvert, Dane Ambler, Debbie Bougen, Joseph Plunket,
Matthew Patterson.
Paul Scherrer Institut (Switzerland): Dr Tom Kober, Bakytzhan Suleimenov for TIMES-NZ 2.0 model development.
The TIMES-NZ 2.0 project team would like to acknowledge the following consultants that worked closely
with the project team on the TIMES-NZ 2.0 project delivery.
Sapere Consulting: Toby Stevenson, Corina Comendant, Dr Stephen Batstone, Michael Young for their work
on the economic analysis for TIMES-NZ 2.0.
Nicholson Consulting: Dr Kenny Graham, Conrad MacCormick for their work on developing the R-Shiny tool
used for showcasing the TIMES-NZ 2.0 scenario outcomes.

TIMES-NZ 2.0 Assumptions Working Group
Throughout the project we have been grateful for the input from the following organisations and people
who have provided feedback as part of the Assumptions Working Group reviewing the input assumptions
for the model. The inclusion of the Assumptions Working Group in the project have enabled the integrity
checks on data input assumptions.
Agcarm, ARUP, Beca, BP, BRANZ, Contact Energy, Dairy NZ, Environmental Science & Research, Farmlands,
Federated Farmers NZ, Fletcher Building, Flux Federation, Fonterra, Genesis Energy, Hiringa Energy,
Horticulture NZ, Infratec, Kiwi Property Group Limited, LIC, Lion, Massey University, Master Builders, Meat
Industry Association of NZ, Mercury Energy, Meridian Energy, Methanex, Ministry of Business Innovation
and Employment, Ministry for Primary Industries, Ministry of Transport, Motor Trade Association, Naylor
Love, NERI, New Zealand Marine Industry Association, NZ Steel, Oceana Gold, OJI Fibre, OMV, Pan Pac
Forest Products, Powerco, Ravensdown, Rio Tinto, Sanford, Scion Research, Stonewood, The A2 Milk
Company, Todd Energy, Transpower, Trustpower, University of Auckland, Vector, Waka Kotahi New Zealand
Transport Agency, Westland Milk Products, Whakatane Mill, Winstone Pulp Intl, WPMA, Z Energy, Zespri
International Ltd.

                                                     7
Acronyms
AF Availability Factor
BEC BusinessNZ Energy Council
BEV Battery Electric Vehicle
BNEF Bloomberg New Energy Finance
CAGR Compound Annual Growth Rate
CBA Cost Benefit Analysis
CCGT Combined Cycle Gas Turbine
CCS Carbon Capture and Storage
EA Electricity Authority
EDGS Electricity Demand and Generation Scenarios (MBIE)
EECA Energy Efficiency and Conservation Authority
EEPT Energy Economic Potential Tool (EECA)
EEUD Energy End Use Database (EECA)
EMI Electricity Market Information (EA)
EPA Environmental Protection Authority
ETSAP Energy Technology Systems Analysis Program (IEA)
EV Electric Vehicle
GDP Gross Domestic Product
GEM Generation Expansion Model (EA)
GHG Greenhouse Gas
GJ Gigajoule
GW Gigawatt
HDD Heating Degree Days
HEEP Household Energy End-use Project (BRANZ)
HUD Ministry of Housing and Urban Development
HV High Voltage
IATA International Air Transport Association
ICCT International Council on Clean Transportation
ICE Internal Combustion Engine
IEA International Energy Agency
IPPU Industrial Processes and Product Use
kW Kilowatt
kWh Kilowatt-hour
8LCV Light Commercial Vehicle
LED Light-Emitting Diode
LNG Liquefied Natural Gas
LPG Liquefied Petroleum Gas
LPV Light Passenger Vehicle
LV Low Voltage
MBIE Ministry of Business, Innovation, and Employment
MfE Ministry for the Environment
MoT Ministry of Transport
MPI Ministry for Primary Industries
MV Medium Voltage
MW Megawatt
NG Natural Gas
NI North Island
NIWA National Institute of Water and Atmospheric Research
NREL National Renewable Energy Laboratory
NREL ATB National Renewable Energy Laboratory’s Annual Technology Baseline
NZD New Zealand Dollar
NZIER NZ Institute of Economic Research
OCGT Open Cycle Gas Turbine
O&M Operations & Maintenance
PEM Polymer Electrolyte Membrane
PHINZ Process Heat in New Zealand (MBIE and EECA)
PJ Petajoule
PSI Paul Scherrer Institut (Switzerland)
SI South Island
SMR Steam-Methane Reforming
TCP Technology Collaboration Programme
TIMES The Integrated MARKAL-EFOM System
TLA Territorial Local Authority
WCM Winter Capacity Margin
UoW University of Waikato
VFEM Vehicle Fleet Emissions Model (MoT)
VKT Vehicle-Kilometres Travelled
VSD Variable Speed Drive
WEM Winter Energy Margin
Wp-AC Watts Peak Alternating Current
WSR Warehouses, Supermarkets, and Retail
9CHAPTER 1 Introduction
Introduction CHAPTER 1
1.1 Energy and the climate change challenge
The world is facing a huge climate change challenge as greenhouse gas emissions change our atmosphere.
Globally, the majority of these emissions are from energy-related activities, while in New Zealand this
proportion was around 40% in 2018 (Figure 1). How we supply and use energy in the future will have a
big impact on how successfully we respond to the challenge and TIMES-NZ 2.0 seeks to provide more
information and insight into the choices we face about energy use and emissions.
New Zealand’s 14.5% LIGHT VEHICLES Over two thirds of the total energy used in
emissions and 8.1% MANUFACTURING INDUSTRIES
New Zealand comes from non-renewable
energy sources—particularly transport fuels.
energy profile e.g. dairy, meat, textiles, products
& CONSTRUCTION MANUFACTURING INDUSTRIES 205PJ
by sector 5.1% 40.5%
e.g. plumbing, electrical services
6.5% OTHER TRANSPORT
52% 48%
6.5% e.g. freight, buses, rail, domestic aviation LIGHT VEHICLES 157 PJ
Nearly 41% of 4.2% ELECTRICITY GENERATION 99%
NZ’s greenhouse e.g. gas, coal, geothermal
sources for electricity production
gas emissions OTHER TRANSPORT 82 PJ
come from the 2.7% AGRICULTURE, FORESTRY, FISHING
e.g. dairy/stock farming, horticulture, aquaculture, fishing 99.9%
energy sector
& COMMERCIAL
e.g. retail, hospitality, education, healthcare AGRICULTURE, FORESTRY, FISHING 80 PJ
WASTE 2.3% FUGITIVE EMISSIONS 51% 49%
e.g. methane release from coal seams in mining,
flaring of waste gases in oil and gas production HOUSEHOLDS
ENERGY 65 PJ
1.3% OTHER ENERGY INDUSTRIES 27% 73%
AGRICULTURE e.g. petroleum refining, manufacture of coal and wood
0.9% HOUSEHOLDS
INDUSTRIAL PROCESSES Non-renewable Renewable
Figure 1: Breakdown of NZ’s 2018 greenhouse gas emissions by source
Productive and low-emissions business Efficient and low emission transport Energy efficient homes Government leadership Engage hearts and minds
Barriers: Barriers: Barriers: Barriers: Barriers:
• Higher fuel cost of low emission technologies, • Affordability and supply of low emission • Continued availability of low efficiency • Many State sector agencies are not • Kiwis acknowledge climate change, but
compared to fossil fuel equivalents vehicles products and appliances measuring/reporting their their energy use they don’t know what they can do as
1.2 TIMES-NZ 2.0 project background
• Lack of information and expertise on low • Affordability of low emission fuels (e.g. • Poor quality building stock and related emissions individuals, households and businesses
emissions technologies biofuels and hydrogen) • Relatively weak energy efficiency and • Capital and operational costs of meeting • Behavioural barriers to change (e.g. cost,
• Cost-effective and equitable measures to thermal performance standards for buildings Government targets requires new funding, information and split incentives)
Options:
address the efficiency of the existing fleet reprioritising funding or defaulting to
Options: Options:
• Provide support to all businesses to higher-emissions technologies.
Options:
The TIMES-NZ
help them 2.0use,project
understand their energy
emissions profile and transition pathway
grew out of BEC20601,
• Financial incentives
• Regulate which wasappliances,
to remove low efficiency
particularly lighting and hot water
developed
Options: by BEC as an exploration of possible
• Mobilising New Zealanders to reduce
emissions by improving their energy
energy
optimise theirfutures
energy use based on
• Continue to support businesses to
contrasted
• Planning scenarios.vulnerable households and those in
• Vehicle fuel efficiency standards
for the phase out of internal
• Target housing improvements for • Provide clear expectations and requirements
for State sector emission reduction, including
decisions through our Gen Less platform:
— Heart (inspire and mobilise)
• Provide innovative funding mechanisms combustion vehicles energy hardship measuring and reporting on progress and
— Head (inform and empower)
to allow the more rapid transition to a low • Improve the energy efficiency transition pathways
ThecarbonTIMES-NZ
future model is based on the IEA ETSAPrequirements Technology in the buildingCollaboration
code • ProvidingProgram modelling
State sector agencies with methodology.
the knowledge, tools and funding to
TIMES is an internationally recognised modelling approach used in overmake 60thecountries.
transition
TIMES-NZ is an instance of
the international modelling standard which has been adapted to cater for New Zealand’s energy system needs
Source: Greenhouse Gas Inventory 1990-2018, MfE (2020); Light vehicles and Other transport estimates are based on data from the MBIE 2017 energy balances and MBIE Energy in New Zealand (2018)
across sectors. EECA represents New Zealand as the contracting party for IEA ETSAP.
This latest iteration of TIMES-NZ 2.0 builds on the BEC2060 work, and has been developed in partnership
between EECA, BEC and Paul Scherrer Institut adding more detail and sophistication to sectors, subsectors,
technologies, and end uses.
Assumptions and data inputs are based on EECA’s efforts to include the best available data and have been
subjected to a validation process by external experts.
The 2020 update of EECA’s Energy End Use Database (EEUD) provides a greatly improved input dataset for
describing demand sectors.
The results presented in this document are from the model run from 28 April 2021.
11Introduction CHAPTER 1
1.3 Document overview
This document provides the reader with additional information to understand and interpret the results from
the TIMES-NZ New Zealand Energy Scenarios.
Throughout this document the terms “TIMES-NZ” and “TIMES-NZ 2.0” are used interchangeably and refer to
the current version of the model.
Chapter 2 provides a high-level introduction to the TIMES-NZ model, including the sophisticated TIMES
model generator, a historical review of how the model was developed over time, and an overview of the
current model structure, i.e. TIMES-NZ 2.0.
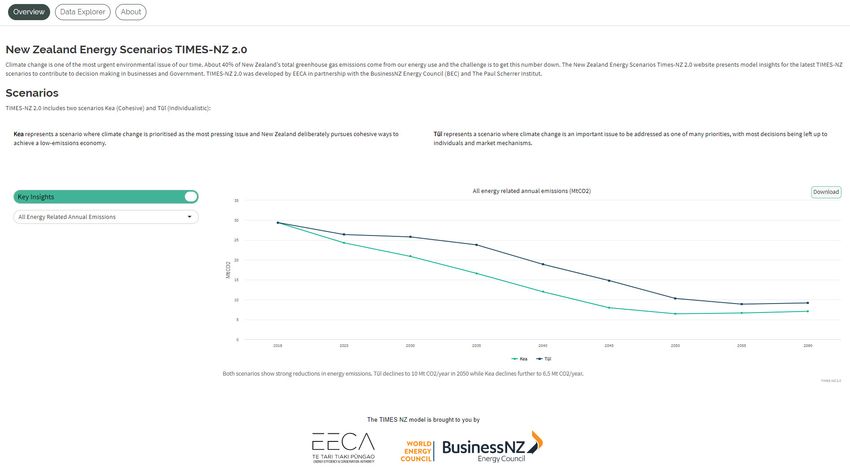
Chapter 3 contains a summary of key modelling results from the two contrasting scenarios Kea and Tūī.
For these selected results, which we have termed key insights, we have provided charts enabling direct
comparison of the two scenarios, like the annual emissions chart (Figure 2) below. For more detailed
scenario outputs, see the TIMES-NZ R Shiny app www.eeca.govt.nz/times-nz which provides an interactive
experience to understand the scenario outcomes.
Chapter 4 outlines the macro-economic assumptions underlying data inputs and demand projections to
the model.
Chapters 5 to 9 describe the main data inputs and assumptions currently used in the model, with each
chapter focusing on a particular sector of the energy system.
All Energy Related Annual Emissions (MtCO2)
35
30
25
20
MtCO2/year
15
10
5
0
201 8 2025 2030 2035 2040 2045 2050 2055 2060
Kea Tūī
Figure 2: Total energy related annual emissions under Kea and Tūī
12CHAPTER 2 TIMES-NZ 2.0 model overview
TIMES-NZ 2.0 model overview                                                                      CHAPTER 2

2. TIMES-NZ 2.0 model overview
TIMES-NZ is a technology-based optimisation model that represents the entire New Zealand energy
system, encompassing energy carriers and processes from primary resources to final energy consumption.
TIMES-NZ is based on the IEA ETSAP TCP TIMES2 energy model generator, it models scenarios3 for the
energy system, incorporating both technical, engineering and economic considerations. TIMES-NZ 2.0
Model is a bottom-up model which requires a detailed description of energy technologies, processes and
costs, plus additional infrastructure such as transmission and distribution systems, fuel production and
processing, and energy security considerations.
TIMES is an integrated energy system model, meaning that it simultaneously models all components of the
energy system, ensuring that any interdependencies and trade-offs are reflected.
TIMES uses a linear-programming solver to minimise the total discounted energy system cost4 over the
entire modelled time horizon. The cost minimisation is achieved by choosing between technologies and
fuels to meet expected energy demand. The model effectively ‘invests in’ the various available technologies
based on the combinations of cost, efficiency and fuel availability. TIMES models are particularly suited to
explore the evolution of possible least-cost configurations of the system.
If the model sees a technology as ‘optimal’ – even only fractionally more economic than another technology
- it will try to maximise the use of that technology. TIMES has a high degree of sophistication in it, which
ameliorates this to some extent (which is the natural tendency of any linear model), in some cases it
utilises constraints to prevent unfeasible results.
A feature only available to linear programming optimization models, is that TIMES produces a rich array
of economic information as part of its solution. Rather than simply tell us what the optimal quantities of
different fuels and technologies are for each scenario, it also tells us what the implied commodity prices
are, and how far away technologies are (economically) from becoming ‘optimal’. TIMES tells us the optimal
commodity prices associated with the solution at every point in time, as well as information about how far
it was from finding a different solution.
It is important to note that the core version of TIMES is a partial equilibrium model, which does not account
for economic interactions outside of the energy sector.
Different scenarios can be generated depending on model inputs, which can be classified as:
•   Potential energy service demand over time
•   Potential primary resource supply over time
•   Policy settings
•   Descriptions of the existing and future technologies available for each energy sector.
The preparation of high-quality data inputs to feed the model is essential for establishing the model
structure and for providing confidence in the model's results. In this way, data inputs and even the model
structure can change over time due to access to new or improved data sources.

                                                     14
TIMES-NZ 2.0 model overview CHAPTER 2
2.1 TIMES-NZ 2.0 scenario definitions
BEC2060 provided two plausible and coherent scenarios about New Zealand’s energy future: Kea and Tūī.
These scenarios have been extended in this latest iteration to include more granular data.
Kea (cohesive) Tūī (individualistic)
Kea represents a scenario where climate Tūī represents a scenario where climate
change is prioritised as the most pressing change is an important issue to be addressed
issue and New Zealand deliberately pursues as one of many priorities, with most decisions
cohesive ways to achieve a low-emissions being left up to individuals and market
economy. mechanisms.
It is important to note that the TIMES-NZ Kea and Tūī scenarios are not predictions about the future or
an attempt to pick winners – they show energy and emissions scenarios in five-year time steps based on
data and assumption inputs. From a modelling perspective, these two scenarios differ in terms of the
assumptions and data inputs to the model.
The key model input differences between Kea and Tūī are:
• GDP assumptions
• Carbon price input assumptions
• Technology cost curves
• Discount rates
15TIMES-NZ 2.0 model overview CHAPTER 2
2.2 TIMES-NZ 2.0 model structure
TIMES-NZ has a modular structure that encompasses resource supply, electricity generation, other fuel supply,
fuel distribution, and demand sectors as illustrated in Figure 3. The five demand sectors are Residential,
Commercial, Industrial, Agriculture Fishing and Forestry, and Transport, which are disaggregated further into
subsectors as described in Table 1.
Primary Energy Resources
Electricity Generation Other Fuel Supply
Fuel Distribution
Residential Sector Commercial Sector Transport Industrial Sector Agriculture, Forestry and Fishing
Figure 3: Illustration of the TIMES-NZ model structure
Table 1: Disaggregation of energy demand sectors in TIMES-NZ 2.0
Demand Sector Subsectors
Residential Detached Dwellings, Joined Dwellings
Commercial Education, Healthcare, Office blocks, Warehouses Supermarkets and Retail (WSR),
and Other (e.g. Recreation)
Transport Road Transport (including Light Road and Heavy Road), Aviation, Shipping, Rail
Industrial Aluminium, Petroleum/Chemicals, Construction, Dairy Product Manufacturing,
Food Processing, Iron/Steel Manufacturing, Meat Processing, Metal Product
Manufacturing, Methanol Production, Mineral Production, Mining, Wood
Pulp and Paper Processing, Refining of Petroleum Products, Wood Product
Manufacturing, Urea Production
Agriculture, Forestry and Fishing Dairy Cattle Farming, Livestock Farming, Outdoor Horticulture, Indoor Cropping,
Forestry, Fishing
All fuels included in the TIMES-NZ model are shown in Table 2. They have been grouped as “Fossil Fuels”,
“Renewables (direct use)”, and “Electricity”. Green Hydrogen, which is produced from electrolysis, is
included in the Electricity group. Blue Hydrogen, produced from Steam Methane Reforming (SMR) with
Carbon Capture and Storage (CCS), is included in the Fossil Fuels group.
Table 2: Fuels included in the TIMES-NZ model
Coal, Diesel, Fuel Oil, Jet Fuel, LPG, Natural Gas, Petrol, Waste Incineration,
Fossil Fuels
Blue Hydrogen
Biogas, Biodiesel, Drop-in Biofuels (Drop-in Diesel, Drop-in Jet), Geothermal,
Renewables (direct use)
Hydro, Solar, Wind, Wood
Electricity Electricity, Green Hydrogen
16TIMES-NZ 2.0 model overview CHAPTER 2
In the TIMES-NZ model New Zealand has two regions, North Island (NI) and South Island (SI).
The model has a time horizon of 2018-2060. The time horizon is split into 5-year periods in general:
• The first period is for a single year (2018) in order to facilitate the calibration of the model to national
energy balances.
• The following period has a length of 4 years (represented by milestone year 2020).
• All following periods have a length of 5 years (represented by milestone years 2025, 2030, 2035…
2060). Time periods are described in Table 3.
Table 3: Model time periods and associated
middle years (also known as milestone years)
Time Period Milestone Year
2018 2018
2019-2022 2020
2023-2027 2025
2028-2032 2030
2033-2037 2035
2038-2042 2040
2043-2047 2045
2048-2052 2050
2053-2057 2055
2058-2062 2060
Additionally, each year is temporally split by season, time of week, and time of day as detailed in Table
4, resulting in 24 time slices per year. Such time slices are helpful in representing generation patterns
of different technologies, which is particularly important in the case of renewable resources. The most
important function of time slices in the TIMES-NZ model is representing variable electricity supply and
demand and subsequent security of supply calculations.
GHG emission factors have been defined in accordance to MBIE estimates of greenhouse gas emissions
from the energy sector in New Zealand5.
Only domestic emissions are counted in TIMES-NZ, which is consistent with other government models.
International aviation and shipping emissions are therefore excluded in the results, however, fuel
consumption from international aviation and shipping was included to account for the availability of
domestic supply of fuel.
Fugitive emissions from natural gas extraction and refinery emissions are accounted for in TIMES-NZ in
order to capture the carbon tax for each fuel accurately. However, these are not included in the results for
output emissions as they are not directly energy related.
Table 4: Sub annual time resolution
Category Values
Season Summer, Autumn,
Winter, Spring
Weekday type Weekday, Weekend
Time of day Day Time, Peak Time,
Night Time
17CHAPTER 3 Key insights - New Zealand Energy Scenarios TIMES-NZ 2.0
Key insights - New Zealand Energy Scenarios TIMES-NZ 2.0                                                               CHAPTER 3

3. Key Insights - New Zealand Energy Scenarios TIMES-NZ 2.0
The following is a short summary of some of the key insights from the TIMES-NZ 2.0 scenario run on the
28th April 2021. They highlight a number of cost-effective pathways for increasing renewable energy use
and accelerating decarbonisation across sectors.

3.1 Energy emissions decline strongly in both scenarios
Both scenarios show strong reductions in energy emissions. In Tūī, energy emissions decline to 10 Mt
CO2/year in 2050 while in Kea they fall further to 6.5 Mt CO2/year. Moreover, Kea’s more rapid emissions
decrease means that the model output indicates cumulative emissions through to 2050 as almost 25%
lower in the Kea scenario than the Tūī scenario.

                                                         All Energy Related Annual Emissions
                    35

                    30

                    25

                    20
      MtCO2 /year

                    15

                    10

                     5

                    0
                         2018          2025       2030         2035        2040         2045    2050        2055     2060

                                                                      Time step

                                                                      Kea Tūī

                                Figure 4: Total energy related annual emissions TIMES-NZ 2.0 Kea and Tūī scenarios

                                                                         19
Key insights - New Zealand Energy Scenarios TIMES-NZ 2.0 CHAPTER 3
All Energy Related Cumulative Emissions
900
800
700
600
500
MtCO2
400
300
200
100
0
2018 2025 2030 2035 2040 2045 2050 2055 2060
Time step
Kea Tūī
Figure 5: Total energy related cumulative emissions TIMES-NZ 2.0 Kea and Tūī scenarios
20Key insights - New Zealand Energy Scenarios TIMES-NZ 2.0 CHAPTER 3
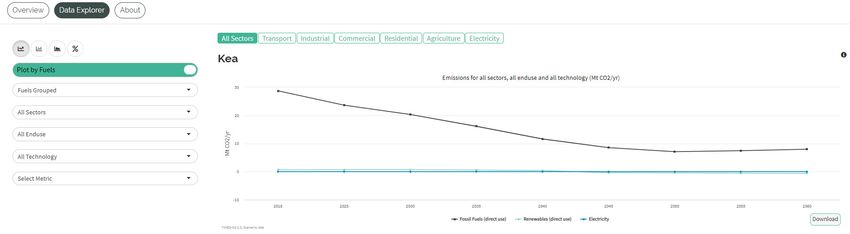
3.2 Demand for fossil fuels decreases significantly in
both scenarios
Both scenarios indicate that between 2018 and 2050, energy demand (excluding feedstocks) met by fossil
fuels goes from 63% to 22% under Kea and 33% under Tūī. In some sectors, particularly road transport, food
processing, residential and commercial, fossil-fuel demand falls to a small fraction of current levels. Most
remaining demand is in hard-to-abate sectors (such as aviation, shipping and fishing). This means renewables
provide 78% of energy demand (excluding for feedstocks) under Kea and 67% under Tūī in 2050.
Renewable Energy Percentage
90%
80%
70%
60%
50%
%
40%
30%
20%
10%
0%
2018 2025 2030 2035 2040 2045 2050 2055 2060
Time step
Kea Tūī
Figure 6: Total renewable energy percentage TIMES-NZ 2.0 Kea and Tūī scenarios
21Key insights - New Zealand Energy Scenarios TIMES-NZ 2.0 CHAPTER 3
3.3 Road transport becomes almost entirely fossil-fuel free
Both scenarios see a transition of the light vehicle fleet from being almost completely fossil-fuelled to
being almost completely electric by 2050 in Kea and by 2055 in Tūī. Kea sees markedly slower growth in the
overall number of vehicles due to a lower distance travelled assumption in the model. Both scenarios also
show conventional hybrid vehicles as transitional technologies as a result of modelled economic and supply
limitations for battery electric vehicles.
There is a large reduction in the use of fossil-fuel across the heavy vehicle fleet in both scenarios as the
model selects only electric heavy vehicles by 2050 for Kea and 2055 for Tūī (based on lowest cost to
service demand). While there are many other options available for heavy fleet decarbonisation available,
the cost of these options (such as biofuels and hydrogen technologies) resulted in them not emerging in the
model results. As these are rapidly evolving technologies, the TIMES-NZ model will be frequently reviewed
and updated as technology develops, and future model versions may explore further disaggregation of
heavy duty vehicles to provide the model with more decarbonisation alternatives.
Road Transport Fuel Consumption
250
200
150
PJ
100
50
0
2018 2025 2030 2035 2040 2045 2050 2055 2060
Time step
Fossil Fuels (Kea) Fossil Fuels (Tūī) Electricity (Kea) Electricity (Tūī)
Figure 7: Road transport consumption of fossil fuels and electricity TIMES-NZ 2.0 Kea and Tūī scenarios
22Key insights - New Zealand Energy Scenarios TIMES-NZ 2.0 CHAPTER 3
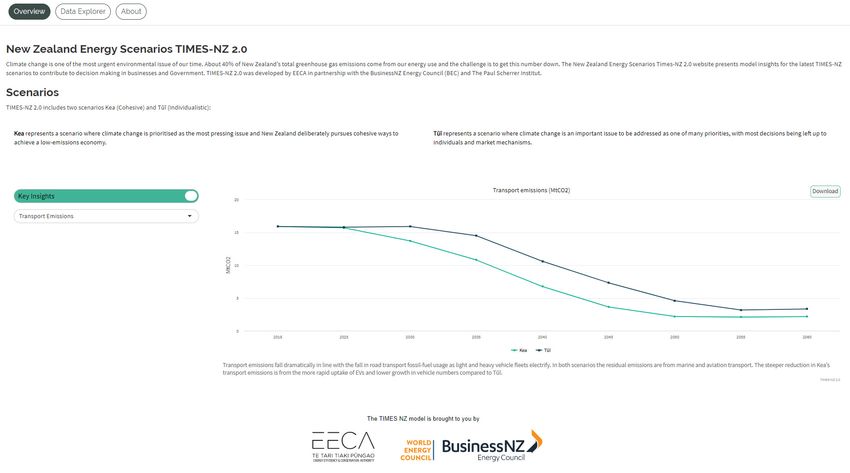
3.4 Transport emissions
Transport emissions fall dramatically in line with the fall in road transport fossil-fuel usage as light and
heavy vehicle fleets electrify. In both scenarios the residual emissions are from marine and aviation
transport. The steeper reduction in Kea’s transport emissions is from the more rapid uptake of EVs and
lower growth in vehicle numbers compared to Tūī.
Transport Annual Emissions
18
16
14
12
MtCO2 /year
10
8
6
4
2
0
2018 2025 2030 2035 2040 2045 2050 2055 2060
Time step
Kea Tūī
Figure 8: Transport annual emissions TIMES-NZ 2.0 Kea and Tūī scenarios
23Key insights - New Zealand Energy Scenarios TIMES-NZ 2.0 CHAPTER 3
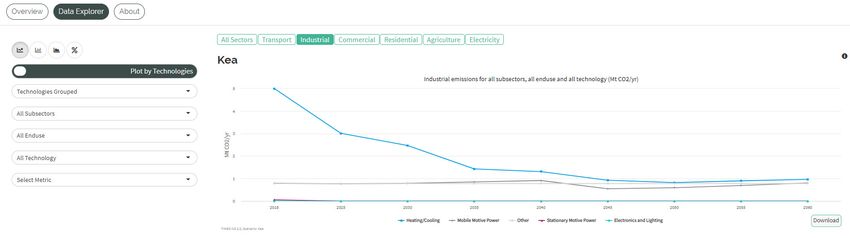
3.5 Industrial emissions
Industrial emissions see a sharp decline in Kea to 2.7 Mt CO2/year in 2050 due to the uptake of direct use of
renewables and electrification.
Industrial Annual Emissions
7
6
5
4
MtCO2/year
3
2
1
0
2018 2025 2030 2035 2040 2045 2050 2055 2060
Time step
Kea Tūī
Figure 9: Industrial annual emissions TIMES-NZ 2.0 Kea and Tūī scenarios
24Key insights - New Zealand Energy Scenarios TIMES-NZ 2.0 CHAPTER 3
3.6 Both scenarios reduce overall usage of gas
Overall gas demand remains below potential levels of domestic supply, avoiding any import of LNG or other
substitutes. The model output sees gas demand cease entirely in the residential sector by 2040 in both
Kea and Tūī scenarios, due to a combination of rising carbon prices and increasingly attractive alternative
technologies, making switching away from gas economically optimal.
Natural Gas Consumption for All Sectors (excluding feedstocks)
140
120
100
80
PJ
60
40
20
0
2018 2025 2030 2035 2040 2045 2050 2055 2060
Time step
Kea Tūī
Figure 10: Total consumption of Natural Gas (excluding feedstocks) TIMES-NZ 2.0 Kea and Tūī scenarios
25Key insights - New Zealand Energy Scenarios TIMES-NZ 2.0 CHAPTER 3
3.7 Energy efficiency plays a key role in decarbonisation
In both scenarios adoption of more efficient technologies increases energy efficiency and results in
significantly decreased energy consumption. For example, road transport energy-use per distance travelled
reduces by nearly 80% as a result of EV adoption because EVs are much more efficient than the fossil-
fuelled ICE technologies they replace. Similarly, the electricity required for residential lighting falls by
70% as incandescent lights and fluorescent lights are phased out and replaced by more efficient LED
options. The model finds a 35% increase in industrial energy efficiency – mainly due to electric boilers and
conversion to biomass. Our scenarios also find a 70% increase in agricultural energy efficiency – mainly due
to fuel switching off-road fuels and high temperature heat pumps in indoor cropping.
Road Transport Energy Use per Distance Travelled
5
4.5
4
3.5
3
PJ/Billion VKT
2.5
2
1.5
1
0.5
0
2018 2025 2030 2035 2040 2045 2050 2055 2060
Time step
Kea Tūī
Figure 11: Road transport energy use per vehicle-kilometres travelled TIMES-NZ Kea and Tūī scenarios
Electricity Consumption Residential Lighting
4
3.5
3
2.5
2
PJ
1.5
1
0.5
0
2018 2025 2030 2035 2040 2045 2050 2055 2060
Time step
Kea Tūī
Figure 12: Electricity consumption residential lighting TIMES-NZ Kea and Tūī scenarios
26Key insights - New Zealand Energy Scenarios TIMES-NZ 2.0 CHAPTER 3
3.8 Major increases in electricity demand and electrification
Electrification across all sectors results in electricity demand roughly doubling in both scenarios, from
144 PJ in 2018 to around 270 PJ in 2050. Electricity supplies up to 59% in Kea and 54% in Tūī of all energy
demand by 2050. Under both scenarios, this increased demand is met by very large increases in wind
generation accompanied by large increases to solar (primarily grid-scale) in later years by the model. Both
scenarios converge on a very high renewable electricity percentage of around 95%. Under both scenarios,
winter gas peaking is retained, and there is a gradual decline in geothermal generation. Under the Tūī
scenario, hydro generation expands where possible, reducing dependence on gas peakers.
Electrification Percentage
70%
60%
50%
40%
%
30%
20%
10%
0%
2018 2025 2030 2035 2040 2045 2050 2055 2060
Time step
Kea Tūī
Figure 13: Electrification percentage TIMES-NZ 2.0 Kea and Tūī scenarios
Renewable Electricity Percentage
100%
90%
80%
70%
60%
50%
%
40%
30%
20%
10%
0%
2018 2025 2030 2035 2040 2045 2050 2055 2060
Time step
Kea Tūī
Figure 14: Renewable electricity percentage TIMES-NZ 2.0 Kea and Tūī scenarios
27Key insights - New Zealand Energy Scenarios TIMES-NZ 2.0 CHAPTER 3
Electricity Generation Kea
350
300
250
200
PJ
150
100
50
0
2018 2025 2030 2035 2040 2045 2050 2055 2060
Time step
Wind Hydro Solar Geothermal Natural Gas Coal Waste Incineration
Figure 15: Electricity Generation by Fuel TIMES-NZ 2.0 Kea scenario
Electricity Generation Tūī
350
300
250
200
PJ
150
100
50
0
2018 2025 2030 2035 2040 2045 2050 2055 2060
Time step
Wind Hydro Solar Geothermal Natural Gas Coal Waste Incineration
Figure 16: Electricity Generation by Fuel TIMES-NZ 2.0 Tūī Scenario
28Key insights - New Zealand Energy Scenarios TIMES-NZ 2.0 CHAPTER 3
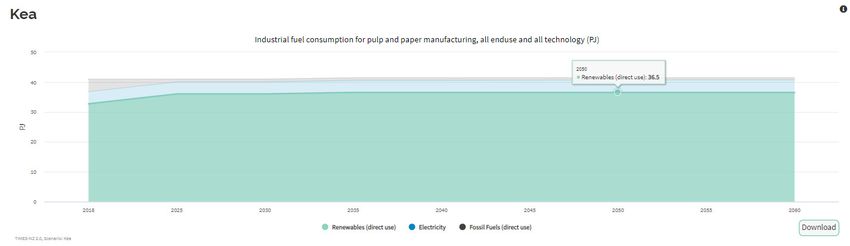
3.9 Demand for wood fuel doubles
The model indicates the amount of energy supplied. Wood fuel roughly doubles from 50 PJ to between 100
and 115 PJ in 2050. Most of the wood is is selected by the model to replace coal and gas for process heat.
Wood Consumption for All Sectors
120
100
80
60
PJ
40
20
0
2018 2025 2030 2035 2040 2045 2050 2055 2060
Time step
Kea Tūī
Figure 17: Wood consumption TIMES-NZ 2.0 Kea and Tūī scenarios
29Key insights - New Zealand Energy Scenarios TIMES-NZ 2.0 CHAPTER 3
3.10 Storage plays a key role in the electricity system
Both TIMES-NZ scenarios use electricity storage to meet demand peaks, particularly from lithium-ion
batteries, with capacity from storage technologies of 1.9 GW in Kea and 2.9 GW in Tūī by 2050. Both
scenarios make limited use of large-scale pumped hydro from 2050 onwards, while Tūī makes greater use
of battery storage. TIMES-NZ does not specifically model dry years, so the storage requirement findings
represent average hydro years only.
Electricity Storage
16
14
12
10
8
PJ
6
4
2
0
2018 2025 2030 2035 2040 2045 2050 2055 2060
Time step
Kea Tūī
Figure 18: Electricity storage TIMES-NZ 2.0 Kea and Tūī scenarios
30Key insights - New Zealand Energy Scenarios TIMES-NZ 2.0 CHAPTER 3
3.11 Hydrogen plays a role in agricultural niches under
both scenarios
Hydrogen plays a limited role under both scenarios (due to the higher cost compared to other available
technology types). This is based on current technology performance and cost curves for meeting energy
demand. Hydrogen finds its niche in agricultural machinery, where the model determines it can decarbonise
equipment working in remote areas, such as farms and forests. The model shows that it makes up around
to 20% of agricultural fuel consumption in Kea and 16% in Tūī towards the end of the modelled period.
Percentage of Hydrogen in Agriculture Forestry and Fishing Energy Consumption
25%
20%
15%
%
10%
5%
0%
2018 2025 2030 2035 2040 2045 2050 2055 2060
Time step
Kea Tūī
Figure 19: Percentage of hydrogen in Agriculture Forestry and Fishing energy consumption TIMES-NZ 2.0
Kea and Tūī scenarios
31Key insights - New Zealand Energy Scenarios TIMES-NZ 2.0 CHAPTER 3
3.12 Wood and electricity displace coal
Under both scenarios, coal is replaced for all non-feedstock uses by wood and electricity by 2045. Under Kea,
the dairy sector is nearly at zero emissions by 2035 (while it takes until nearly 2055 under Tūī). Similar results
are found in the wider food sector although the model indicates natural gas is retained at reduced levels.
3.13 Biofuels play a relatively modest role
Biofuels play a relatively modest role, with drop-in diesel reducing emissions by up to 1.5Mt by 2050
under the Kea scenario. This is because of the high production costs for biofuels, resulting in the model
preferring electricity for road transport.
Biofuel Consumption for All Sectors
18
16
14
12
10
PJ
8
6
4
2
0
2018 2025 2030 2035 2040 2045 2050 2055 2060
Time step
Kea Tūī
Figure 20: Biofuel consumption TIMES-NZ 2.0 Kea and Tūī scenarios
32Key insights - New Zealand Energy Scenarios TIMES-NZ 2.0 CHAPTER 3
3.14 Electricity prices
TIMES-NZ produces estimates of energy costs, which are not the same as market prices. Shadow prices
for electricity show electricity costs that are around ten times cheaper in summer, and around twice as
expensive in winter, relative to current long-term averages, reflecting the increased use of solar and wind,
and the move from baseload to peaking for thermal generation. Kea assumes Tiwai closes in 2024, with an
associated demand reduction, and Tūī assumes it stays open indefinitely or is replaced by new demand of
the same size.
3.15 New technology and innovation will be needed to
address residual emissions
In both scenarios, most of the residual emissions are from sectors where the model did not have
economically viable low-emission technology options to select. Approximately half of these residual
emissions come from aviation, shipping and fishing sectors. While there are some other potential low-
emissions options in these areas, these were either not well-enough defined to include in the model inputs,
or were more expensive than the options selected by the model. Further technological improvements and
innovation will be needed so that low-emission options are available at a lower cost.
3.16 Solar plays a role, mostly in grid-scale form
Both scenarios pick up a lot of solar PV from 2040 onwards, with up to 50 PJ in Tūī by 2060. In both
scenarios, the model picks grid-scale solar as more economic and cost-effective than rooftop systems.
Electricity Generation from Solar
70
60
40
30
PJ
20
10
0
2018 2025 2030 2035 2040 2045 2050 2055 2060
Time step
Kea Tūī
Figure 21: Electricity generation from solar TIMES-NZ 2.0 Kea and Tūī scenarios
33CHAPTER 4 Macro-economic assumptions
Macro-economic assumptions                                                                                 CHAPTER 4

4. Assumptions - New Zealand Energy Scenarios
TIMES-NZ 2.0
A conventional TIMES model is driven by estimations of service demand within available supply constraints,
which involves the forming of robust input assumptions. TIMES-NZ considers two scenarios each with
different economic, social, carbon and energy-related inputs that lead to the distinct outcomes modelled.
Below the key assumptions such as GDP, population, and carbon prices for each scenario are described. We
note that these assumptions are not predictions or forecasts, rather they illustrate two possible pathways
for each of the parameters.

4.1 Gross Domestic Product (GDP)
GDP growth is often used to indicate the performance of an economy and is well understood even though
economic health and well-being are not solely captured by GDP. In the case of scenarios focused on the
energy system, GDP is a key driver of the demand for energy services, and thus is a core component of the
quantification of the scenarios. The two narratives are essentially two strongly different economic paths
that governments might take towards a sustainable economy in the long term.

  Kea:                                                          Tūī:
  •        New Zealand takes the risk of                        •      New Zealand continues to capitalise on its
           transforming its economy with climate                       natural assets and the pursuit of GDP growth.
           change being the catalyst.                           •      New Zealand balances its international
  •        New Zealand pursues global leadership in the                emissions targets with protecting its key
           energy transition.                                          wealth-generating sectors from the full effect
  •        Difficult structural change occurs through to               of international carbon prices6.
           2040, with socioeconomic impacts as a result         •      Strong economic growth occurs in the early
           of the economic transformation leading to                   part of the period, however midway through
           lower GDP growth in this period.                            the scenario period New Zealand becomes
  •        While generating international respect,                     less desirable as a trading partner, and – to
           initially this does not translate into                      some extent – as a tourist destination.
           economic benefits.                                   •      The world starts to be more selective about
  •        After decades of change, from 2040 onwards,                 how it buys from New Zealand, especially
           New Zealand begins to return to higher GDP                  since New Zealand has consistently lagged
           growth with a new low-emissions economy                     behind at this point.
           and improving productivity resulting from the        •      Domestic political inertia resulting from
           transformation.                                             two decades of conservative policy making
  •        Economic well-being, as measured by GDP,                    is such that New Zealand can’t adapt as
           rises above Tūī before the end of the period.               quick as hoped.
                                                                •      These two factors mean that growth of GDP
                                                                       in the Tūī scenario tapers off after 2040.

In TIMES-NZ, specific sub sector estimates are built up of activity in the following sectors:
1. Agriculture and Forestry based on land use projections
2. Industrial activity
      a.    Methanol
      b.    Aluminium
      c.    Agriculture related processing (meat/dairy)
      d.    Steel (capped at current capacity)

                                                           35
Macro-economic assumptions CHAPTER 4
3. Population-driven
a. Domestic households
b. Healthcare
c. Education
The remaining sectors then apply GDP growth assumptions given below:
2020 2025 2030 2035 2040 2045 2050 2055 2060
Kea 2.0% 2.0% 2.0% 2.5% 2.5% 3.0% 3.0% 3.0% 3.0%
Tūī 4.0% 4.0% 4.0% 2.5% 2.5% 1.0% 1.0% 1.0% 1.0%
The impact of all GDP assumptions considered by the model results in the assumed composite GDP
growth which is approximately:
2020 2025 2030 2035 2040 2045 2050 2055 2060
Kea 2.5% 1.6% 1.6% 2.0% 2.5% 2.6% 2.6% 2.6% 2.7%
Tūī 2.4% 3.4% 3.3% 2.1% 0.8% 0.8% 0.8% 0.8% 0.9%
4.2 Population
Population growth is another key driver of the demand for energy services, and thus is another core
component of the quantification of the scenarios.
Kea: Tūī:
• Population grows at only 0.6% p.a. during • Due to the continued growth in the New
the period of transformation 2021 – 2040. Zealand economy, migrants are initially
attracted to the wealth generation
• Most growth has been in the major cities,
prospects in New Zealand.
fuelled by the prospect of service sector • Governments are open to immigration,
and technology jobs. seeing it as a way to continue fuelling
• Some rural areas suffer as a result of being economic growth, and hoping for
left behind by the transforming economy. increasing productivity as well.
• Immigration in the early years of the Kea • In the first part of the scenario period,
immigration and thus population growth,
transformation is limited by reduced
grows strongly at 1.2%.
employment prospects in primary industries. • However, as New Zealand’s international
• Governments will actively limit reputation begins to be eclipsed by other
immigration to those with the skills to countries who are making greater strides
contribute positively to the economic to reduce emissions and transform their
transition away from dependence on fossil economies, immigration, and population
growth wanes.
fuels and towards low emissions activities.
• Later in the scenario period, as the
transition is nearly complete, future
governments are more receptive to wider
immigration, and NZ’s world-leading
economy is highly attractive to people
offshore who want to play a part.
• Net population grows at around 0.8% during
the economic boom later in the period.
36Macro-economic assumptions CHAPTER 4
4.3 Number of households
TIMES-NZ estimates the number of new occupied dwellings under each scenario up to 2060, by dividing
population increase projections by the ratio of the number of new residents per new occupied dwelling,
which was calculated from historical data.
MBIE’s Construction Pipeline Report forecasts 39% of dwelling consents to be joined dwellings in 2025. In
order to differentiate the projections between dwelling types, TIMES-NZ assumes the proportion of 39%
joined dwelling consents continues beyond 2025.
4.4 Carbon price
The assumed international carbon price trajectories are based loosely around the World Energy Council’s
‘Modern Jazz’ and ‘Unfinished Symphony’ scenarios7 as they reference global prices in Tūī and Kea respectively,
but ‘spread’ the prices to reflect how New Zealand positions itself relative to the rest of the world.
Kea: Tūī:
• Consistent with the global leadership • Global efforts to combat climate change
aspiration, the domestic carbon price is are, on average slower than they are in
Kea; hence the scenarios tend to mirror
allowed to run ahead of the global price of
this global narrative.
carbon (which itself is rising rapidly) as policy • Tūī lags the international carbon price,
settings constrain the supply of carbon units. reflecting the effort to protect strategic
• Access to international units is constrained. wealth-generating industries from the full
• Over time, carbon prices rise to levels effect of the carbon price.
required for significant emissions reductions
to be incentivised.
4.5 Discount rate
The computation of the present value of future investments and costs requires a discount rate, which is
entered exogenously. The discount rate is in fact a key parameter in energy system models, with sensitivity
studies showing its strong impact on the technological preferences selected by the model.
Discount rates considered in TIMES modelling exercises are typically social discount rates and, in some
cases, they also include hurdle rates to account for barriers for certain technologies. The lower the social
discount rate is, the higher the renewable contribution in the resulting energy mix8.
In TIMES-NZ, discount rates were defined as follows:
• Under Tūī, a discount rate of 5% p.a. is assumed for energy demand technologies, as per Treasury CBA
guidance9 , reflecting an investment environment that continues to prioritise relatively short-term
economic investment.
• Under Kea, a discount rate of 2.5% p.a. is assumed for energy demand technologies, reflecting the
scenario assumption that long-term outcomes such as avoiding climate change receive higher priority
than short-term returns. The lower discount rate helps to incentivise capital intensive investments.
• For both scenarios, a discount rate of 2.5% is used for for biomass and hydrogen production technologies,
to mitigate the risk and barriers associated with the installation of these available technologies.
4.6 Energy service demand projections
Table 5 shows the sources for the exogenously determined energy service demand projections that have
been considered in each subsector of the model. For some cases, demand projections were calculated
based on key drivers.
37Macro-economic assumptions CHAPTER 4
Table 5: “Drivers” for energy service demand projections that have been considered in each subsector of the model
Sector Subsector Source (or driver) for energy service demand projections
Residential Detached dwellings Number of households (detached)
Residential Joined dwellings Number of households (joined)
Commercial Education Population projections
Healthcare
Commercial Office blocks Sub sectoral GDP
Warehouses, Supermarkets
and Retail (WSR)
Other
Industrial Aluminium Sub sectoral GDP
Construction
Food Processing
Metal Product Manufacturing
Methanol Production
Mineral Production (includes
non-metallic minerals e.g.
cement/lime)
Mining (of aggregates/metals)
Petroleum/Chemicals
(includes plastic/
pharmaceutical
manufacturing)
Refining of petroleum
products
Urea Production
Wood Product Manufacturing
Industrial Dairy Product Manufacturing MPI land and animal projections
Meat Processing
Industrial Iron/Steel Manufacturing None
Wood Pulp and Paper
Processing
Transport Road Transport VFEM scenarios from MoT adjusted due to different
population assumptions between MoT’s scenarios
and the BEC2060 scenarios
Transport Aviation MoT’s Air Passenger Forecasts, adjusted by energy
efficiency improvements and behavioural change
Transport Shipping MoT’s Freight Model, population projections and
domestic GDP projections
Transport Rail MoT’s Updated Future State Model results and MoT’s
Freight Model
Agriculture, Forestry Dairy Farming Land use projections
and Fishing Livestock Farming
Outdoor Horticulture &
Arable Farming
Forestry
Agriculture, Forestry Indoor Cropping Population projections
and Fishing
Agriculture, Forestry Fishing None
and Fishing
38You can also read